HAL Id: hal-02990445
https://hal.archives-ouvertes.fr/hal-02990445
Submitted on 5 Nov 2020HAL is a multi-disciplinary open access archive for the deposit and dissemination of sci-entific research documents, whether they are pub-lished or not. The documents may come from teaching and research institutions in France or abroad, or from public or private research centers.
L’archive ouverte pluridisciplinaire HAL, est destinée au dépôt et à la diffusion de documents scientifiques de niveau recherche, publiés ou non, émanant des établissements d’enseignement et de recherche français ou étrangers, des laboratoires publics ou privés.
Copyright
Structural insights into the membrane receptor ShuA in
DDM micelles and in a model of gram-negative bacteria
outer membrane as seen by SAXS and MD simulations
Stéphane Abel, Massimo Marchi, Justine Solier, Stephanie Finet, Karl Brillet,
Françoise Bonnete
To cite this version:
Stéphane Abel, Massimo Marchi, Justine Solier, Stephanie Finet, Karl Brillet, et al.. Structural insights into the membrane receptor ShuA in DDM micelles and in a model of gram-negative bacteria outer membrane as seen by SAXS and MD simulations. Biochimica et Biophysica Acta:Biomembranes, Elsevier, In press, pp.183504. �10.1016/j.bbamem.2020.183504�. �hal-02990445�
1
Structural insights into the membrane receptor ShuA in DDM
micelles and in a model of gram-negative bacteria outer membrane
as seen by SAXS and MD simulations
Stéphane Abela*,Massimo Marchi a,Justine Solier b, Stéphanie Finet c, Karl Brillet d and Françoise
Bonneté e*
aUniversité Paris-Saclay, CEA, CNRS, Institute for Integrative Biology of the Cell (I2BC), 91198,
Gif-sur-Yvette, France
b Laboratoire d’Electrochimie et de Physico-chimie des Matériaux et des Interfaces, UMR 5279 CNRS
Univ. Grenoble Alpes, Univ. Savoie Mont Blanc, INP, F38000 Grenoble, France
c Institut de Minéralogie, de Physique de Matériaux et de Cosmochimie, UMR 7590 CNRS-Sorbonne
université, Bioinformatique et Biophysique, 4 Place Jussieu, F75005 Paris, France
d Institut de Biologie Moléculaire et Cellulaire UPR 9002 CNRS, Architecture et Réactivité de l’ARN, 2
allée Konrad Roentgen, F67000 Strasbourg, France
e Institut de Biologie Physico-Chimique (IBPC) UMR 7099 CNRS Université de Paris, Laboratoire de
Biologie Physico-Chimique des Protéines Membranaires, 13 rue Pierre et Marie Curie, F75005 Paris, France
* Email: stephane.abel@cea.fr and bonnete@ibpc.fr
Keywords: Membrane transporter ShuA, DDM, Outer membrane model, SEC-MALLS, SEC-SAXS, Molecular dynamics simulations
2
Abstract
Successful crystallization of membrane proteins in detergent micelles depends on key factors such as conformational stability of the protein in micellar assemblies, the protein-detergent complex (PDC) monodispersity and favorable protein crystal contacts by suitable shielding of the protein hydrophobic surface by the detergent belt. With the aim of studying the influence of amphiphilic environment on membrane protein structure, stability and crystallizability, we combine molecular dynamics (MD) simulations with SEC-MALLS and SEC-SAXS (Size Exclusion Chromatography in line with Multi Angle Laser Light Scattering or Small Angle X-ray Scattering) experiments to describe the protein-detergent interactions that could help to rationalize PDC crystallization. In this context, we compare the protein-detergent interactions of ShuA from Shigella dysenteriae in n-Dodecyl-β-D-Maltopyranoside (DDM) with ShuA inserted in a realistic model of gram-negative bacteria outer membrane (OM) containing a mixture of bacterial lipopolysaccharide and phospholipids. To evaluate the quality of the PDC models, we compute the corresponding SAXS curves from the MD trajectories and compare with the experimental ones. We show that computed SAXS curves obtained from the MD trajectories reproduce better the SAXS obtained from the SEC-SAXS experiments for ShuA surrounded by 268 DDM molecules. The MD results show that the DDM molecules form around ShuA a closed belt whose the hydrophobic thickness appears slightly smaller (22 Å) than the hydrophobic transmembrane domain of the protein (24.6 Å) suggested by Orientations of Proteins in Membranes (OPM) database. The simulations also show that ShuA transmembrane domain is remarkably stable in all the systems except for the extracellular and periplasmic loops that exhibit larger movements due to specific molecular interactions with lipopolysaccharides (LPS). We finally point out that this detergent behavior may lead to the occlusion of the periplasmic hydrophilic surface and poor crystal contacts leading to difficulties in crystallization of ShuA in DDM.
3
1. Introduction
Membrane proteins (MPs) play major roles in living organisms. They participate to exchanges and communications between cells and their immediate environment as receptors, transporters, ion channels, etc. MPs are also involved in a large number of pathologies (influenza, HIV, etc.) and genetic diseases (cystic fibrosis). Their physiological and biomedical relevance makes them major targets for at least 60 % of pharmaceutical molecules in development. Despite their importance, the three-dimensional structures at atomic level of MPs represent barely 2% of biological macromolecular structures in the Protein Data Bank (PDB). This deficit is due to difficulties in the preparation of suitable samples for structural studies by NMR, cryo-EM or crystallography. These structural techniques require the use of membrane-mimetic environments, such as detergents, amphipathic polymers or nanodiscs, to extract proteins from their native lipidic environments and to keep them stable, functional and monodisperse. In the case of crystallography, growing well-ordered diffracting crystals directly from detergent solutions (also named crystallization in surfo) remains the most largely used method, because of its ease of implementation similar to soluble proteins (vapor diffusion, batch, dialysis). However, this crystallization method is very dependent on the nature of the detergent used (tail length, size and charge of polar head). The detergent must both shield the hydrophobic surface of the MP to maintain it stable and avoid its inactivation and possible aggregation deleterious for crystallization, and favor polar contacts between MP-detergent complexes within the crystal [1][2], while keeping the MP-detergent complex monodisperse during the crystal growth. In that goal, information about the influence of detergents on the 3D structure of MPs, the homogeneity of the complex in detergent solution, and the size and shape of the detergent buoy around the MP is essential to select the suitable detergent that will best mimic the native MP structure, i.e. MP within the biological membrane, and that will help in the crystallization of the MP-detergent complex.
4
There are few experimental/computational studies describing both the MP-detergent complex and the detergent interactions with the protein. In the last ten years, some studies on structural properties of protein-detergent micelle complexes have been published describing either the protein conformation in amphiphilic environments or the detergent organization around the protein. Pioneer [3][4][5] and more recent works [6][7][8] using experimental and MD analysis focused on the dynamics or folding of MPs in detergent or lipid environments. Other studies specifically focused on the geometrical modeling of detergent organization around MPs by fitting of SAXS data [9][10][11]. For our part, we study the organization and the specific interactions of different amphiphilic environments around a MP as well as the conformational behavior of the protein in these environments by independent techniques: SEC-MALLS and SEC-SAXS on one hand, and MD simulations on the other hand. Indeed, molecular dynamics (MD) simulations have become a standard approach to study detergent/membrane protein (MP) interactions and help to better understand experimental data [12][13][14]. Besides the fact that the MD technique enables to study the temporal characteristics of a molecular system, it also gives access to structural and temporal characteristics of the detergent/MP interactions at atomic resolution and therefore provides valuable information that complete experiments. For instance, coupled to SAXS (or SANS), which gives access to the form factor of the complex and to SEC-MALLS, which permits to calculate mass fractions of protein and detergent in the complex and to deduce the homogeneity of the complex, MD could help to describe and understand the role played by detergent environments on MP structure and the ability of detergents to make MP crystallization possible.
Here, we report the structural and dynamics analyses of ShuA from Shigella dysenteriae in detergent micelles allowing us to better understand the mechanism of stabilization and crystallization. ShuA, which is known to cause severe forms of fever and gastrointestinal infections (such as acute diarrhea) in children in many developing countries [15][16][17], is a TonB-dependent heme outer membrane (OM) transporter (TBDT). The TBDT proteins share common structural features as antiparallel β-strands that form the
5
outer membrane. In addition, hydrophobic residues face the lipid bilayer exterior, and polar residues line the interior of the β-barrel. This transmembrane β-barrel protein enables passage of various polar ligands
into the cell [18][19]. In particular, ShuA binds heme as an iron source from the methemoglobin. Iron is transported into the periplasm and then translocated into the cytoplasm through an ABC transporter [20]. ShuA is a monomeric MP of 70 kDa with 640 amino acids. Its 3D structure obtained at 2.6 Å, crystallized with n-octyl-D-glucopyranoside (OG) detergent (PDB ID: 3FHH) reveals 5 short helices and 33 β-strands with different sizes (including 22 β-β-strands forming the β-barrel transmembrane domain of the protein) filled by the N-terminal plug domain (residue 1-130) (Fig. 1 and Table 1) [21]. The β-strands forming the β-barrel are connected by 11 long extracellular and 11 periplasmic “short turn” flexible loops that coalesce at the mouth of the pore opening. The lengths, the flexibilities and the content of conserved amino-acids of the extracellular loops play an important role in the ligand recognition and transport as shown by several mutagenesis experiments [22]. In fact, the extracellular loops (ECL) contain mixture of hydrophobic, acidic and basic residues that vary in length from 6 to 32 residues [21]. Short regions of the extracellular loops of ShuA can interact with hemoglobin via accumulation of hydrogen bonds, electrostatic, and hydrophobic interactions [21]. Mutagenesis experiments showed that several histidine residues such as His86 in the plug domain or His428 located in one of the short β-stands in the extracellular loop 7 (ECL7) directly exposed to the solvent play an important role in the binding of the free heme [22][23]. In this paper, we study using atomistic MD simulations the interactions between ShuA and the n-Dodecyl-β-D-Maltopyranoside (DDM) detergent, the most widely used detergent for MP stabilization and crystallization [2]. To perform MD simulations with an appropriate number of detergent molecules around the MP, independent SEC-MALLS experiments were beforehand performed on ShuA solubilized in DDM. Then from comparison between SAXS profile from SEC-SAXS experiments and theoretical SAXS profiles from MD trajectories, we examine the impact of the amphiphilic environment on the structural stability of ShuA for its crystallization in detergent micelles (in surfo). The results are finally
6 compared with a realistic model of gram-negative bacteria outer membrane (OM) of Shigella flexneri (same bacterial family) containing a mixture of bacterial lipopolysaccharide and phospholipids.
2. Materials and methods
2.1. Detergent and protein solutionsAll salt and buffer reagents were purchased from Sigma. n-Dodecyl-β-D-Maltopyranoside (DDM) was obtained from Anatrace (CAS number 69227-93-6; critical micelle concentration (CMC) 0.015 mM).
The recombinant protein was prepared as described in Brillet et al. [24], purified in 1 % octylpolyoxyethylene from Bachem (Octyl-POE, CAS number 27252-75-1; CMC 0.23 %) with 50 mM Tris-HCl pH 8.0, 500 mM NaCl. For SEC-MALLS and SEC-SAXS experiments, the Octyl-POE was exchanged with the DDM by three successive dilution/concentration steps using Vivaspin 2 ultra-centrifugal filters (Sartorius) with a 30 kDa molecular weight cutoff. So, 50 µL of ShuA in OPOE 1 % was diluted in 1 mL of DDM in 50 mM Tris pH 7.5 (named Tris buffer). Concentrations of DDM for SEC-MALLS and SEC-SAXS experiments were chosen above its CMC and high enough to cover the MP in an arbitrary ratio of 1 g of detergent/g of ShuA. The concentration of the new detergent in the sample was checked after each step of dilution/concentration by refractive index measurement. The filtrate was also checked by UV absorbance at 280 nm for evaluation of protein recovery. SEC-MALLS and SEC-SAXS were done using a silica gel Yarra SEC-3000 (300 X 4.6 mm) 3 µm column (Phenomenex) with an elution buffer containing the detergent at concentration above CMC.
2.2. SEC-MALLS analysis of protein-free detergent micelles and protein-detergent complexes
SEC-MALLS experiments for absolute mass determination of protein-free detergent micelles (Mic) and protein (P) and detergent (D) mass fraction determination in protein-detergent complexes (PDC) were carried out on a Shimadzu HPLC coupled to an Optilab® T-rEX™ refractometer and a miniDawnTM
7
molecules passing through a SEC column can be determined without calibration by measuring their static light scattering, knowing their concentration, by using the classical Rayleigh relationship:
𝑅𝜃,sample− 𝑅𝜃,solvent= 𝐾𝑐𝑀 (1) with 𝐾 = 4𝜋 2𝑛 0 2 𝑁𝐴𝜆4 ( 𝜕𝑛 𝜕𝑐) 2 (2)
K is an optical constant, which depends on the refractive index (RI) of the buffer (n0), the wavelength λ of the laser light, the refractive index increment n/c of the scattering molecule and 𝑁𝐴 the Avogadro number. θ is the angle between the incident and the scattered light. For the PDC, a two-component analysis must be carried out to determine both detergent and protein mass fractions. This methodology has been thoroughly described in recent articles [25][26]. Briefly, in this case, the accessible information from triple-detection SEC is the concentration (UV and RI) and the static light scattering (LS) of the PDC, which finally gives the molar mass of the complex through the equation:
𝑀PDC =
𝑅𝜃,PDC− 𝑅𝜃,solvent 𝐾𝑐PDC
(3)
PDC molar mass and concentration depend on the mass fraction (a) of the protein and (b) of the detergent or on the mass ratio (=b/a) of bound detergent to protein through the expressions:
𝑀PDC = (1 + 𝛿)𝑀P
𝑐PDC = (1 + 𝛿)𝑐P= 𝑎𝑐P+ 𝑏𝑐D
(4)
Although 𝑐𝑃𝐷𝐶and a, b and are not directly known, the protein and detergent concentrations can be determined via UV absorbance and refractive index:
𝑐PDC = Δ𝐴𝑏𝑠280nm 𝜀PDC = Δ𝐴𝑏𝑠280nm 𝑎𝜀P+ (1 − 𝑎)𝜀D 𝑐PDC = Δ𝑛 (𝑛𝑐) PDC = Δ𝑛 𝑎 (𝑛𝑐) + (1 − 𝑎) (𝑛𝑐) D (5)
Knowing the respective extinction coefficients and refractive index increments of the protein and the detergent and thus the PDC concentration, the Rayleigh equation allows us to estimate the PDC molar
8
mass and the respective mass fraction of protein and detergent on each point of the SEC elution peak. The automatic procedure Protein Conjugate from Astra V permits the direct calculation of detergent and protein mass fraction using for ShuA ε0.1% = 1.664 L.g-1.cm-1 at 280 nm and n/c = 0.185 mL.g-1 and
for DDM, ε0.1% = 0 at 280 nm and n/c = 0.1473 mL.g-1. 20 µL of ShuA at 1.6 mg.mL-1 in 3 mM DDM
was injected in triplicate through the size exclusion column (Yarra-SEC 3000, Phenomenex) and eluted at a flow rate of 400 µL.min-1.
2.3. SEC-SAXS analysis of protein-detergent complexes
Small Angle X-ray Scattering experiments were performed on the beamline SWING at the French synchrotron facility (SOLEIL, St Aubin). With a wavelength of 1.03 Å and a sample-to-detector distance of 1,788 m, the achievable q-range was 0.0056 to 0.62 Å-1, with q=4πsinθλ and 2θ the scattering angle. 5 and 50 µL of ShuA at 5.5 mg.mL-1 in 10 mM DDM were injected through the same size exclusion
column (Yarra-SEC 3000, Phenomenex) on an Agilent HPLC system, a UV-Vis cell to measure protein concentration at 280 nm and the SAXS flow cell at a flow rate of 300 µL.min-1. 180 SAXS images were collected at the beginning of elution for buffer subtraction and 255 SAXS images for samples during the elution, each with a frame duration of 750 msec. The 2D-SAXS patterns were normalized to the transmitted intensity and azimuthally averaged by using the Foxtrot program [27]. The 180 frames corresponding to elution buffer signal were averaged to provide a buffer signal for subtraction of individual sample frames. Both forward intensity, I(0), and radius of gyration, RG, were determined from
the Guinier approximation I(q) = I(0)exp(−(qRG)2/3) at very small angles, assuming that qRG < 1 and
then were plotted as a function of sample frames in order to determine ranges of frames where the radius of gyration presents no significant variation. The resulting scattering curves were analyzed, and a merged curved from the diluted ShuA_DDM at low q-range and the concentrated ShuA_DDM at high q-range was obtained and used for MD simulations.
9 2.4.1 Composition of the simulation box containing the protein in detergent or in outer membrane
In this work, as a starting structure for the protein, we used the unique crystal 3D-structure of ShuA obtained in n-Octyl-β-D-Glucopyranoside (OG) at 2.6 Å resolution (PDB entry: 3FHH) (Figure 1) [21]. The missing residues and atoms (i.e. N280TGSSG285, H328HHHHHPGGA337 and S579SY581) located in the
extracellular loops of the protein, ECL4, ECL5 and ECL10, were rebuild with the ChimeraX [28] and SCWRL4.0 [29] programs. The protein, detergents and the bacterial phospholipids were modeled with the CHARMM36m [30] force fields for lipids and carbohydrates [31][32][33]. All the protein side chains were modeled with their typical protonation states at pH 7.
The initial configuration of ShuA in the two DDM detergent systems (ShuA_DDM) was constructed with a pre-assembled approach with the Micelle Builder module in CHARMM-GUI (www.charmm-gui.org) [34][35][36]. This tool places the desired number of detergent molecules (i.e. 268 or 294) obtained from SEC-MALLS analysis (see below) around the ShuA transmembrane domain delimited by 22 β-strand segments (Fig. 1). The PDC was then solvated in a cubic box containing 18 Na+ ions to
neutralize the system and 90000 TIP3P water [37] to have enough room (20 Å) between the MP-complex and the box edge, leading to detergent concentrations between 0.17 and 0.19 M respectively for the two systems. We point out that to improve the sampling and examine the influence of the simulation starting conditions on the MD results, we performed two simulations (named hereafter, replica) with different random seeds of each ShuA_DDM system during 200 and 220 ns.
In case of ShuA in the OM system (ShuA_OM), we constructed a molecular model of the outer membrane formed with a mixture of lipopolysaccharide (LPS) of Shigella flexneri without O-antigen polysaccharide and chemical modifications (“user” core choice) and with bacterial phospholipids (PL)
available in the CHARMM-GUI database. To do this, we used the Membrane Builder module in
CHARMM-GUI and followed the steps described in Wu et al.[36]. Hence, the OM consisted of an asymmetric membrane where the outer layer is composed of a model of LPS and the inner layer with a mixture of PL. The LPS structure is quite complex and depends on the bacterial strains and the
10 environments [38]. Here, it contains a LipidA moiety formed with phosphorylated β-d-glucosaminyl-(1→6)-α-N-glucosamine linked to a disaccharide backbone ester-linked and amide-linked to fatty acids with one C12 and five C14 chains (Fig. 2e). In case of the LPS inner and outer cores they contain a high proportion of rare saccharides such as 2-keto-3-deoxyoctulosonate (AKDO) and l-glycero-D-manno-heptose (AHEP) linked with 1→2, 1→5 to standard hexoses (such as α/β- glucose and α-galactose), respectively. In the case of the inner membrane leaflet, it is formed with a mixture of 1-palmitoyl(16:0)-2-palmitoleoyl(16:1cis-9)-phosphatidylethanolamine (PPPE, Fig. 2b), 1-palmitoyl(16:0)-2-vacenoyl(18:1cis-11)-phosphatidylglycerol (PVPG, Fig. 2c) and 1,1′-palmitoyl-2,2′-vacenoyl
cardiolipin with a net charge of −2e (PVCL2, Fig. 2d) at a ratio of 15:4:1, respectively [39]. To have enough lipids between the MP surface and the box edge, we constructed an outer membrane model with 48 LPS, 105 PPPE, 28 PVPG and 7 PVCL2, which gives a membrane with initial XY sizes around 106 X 106 Å. The ShuA_OM system was then solvated with 37970 TIP3P water. Since, the LipidA and the oligosaccharide core of the LPS are strongly negatively charged (the total charge of each LPS is −9e in
this study) and require divalent cations to form stable membrane [38][40], we have also added in the simulation box 216 Ca2+, 163 K+ and 103 Cl- ions to neutralize the system and have a KCl concentration around 150 mM. A summary of the characteristics and snapshots of all the systems extracted from the three simulations trajectories are given in Table 2 and in Fig. 3, respectively.
2.4.2 MD simulation parameters
The simulations discussed in this paper were carried out in the constant pressure and temperature (NPT) ensemble at 300 and 310 K (the latter temperature is consistent with the liquid-disordered structure of the OM, see ref. [36]) and 1.015 bar for the simulations carried out with the ShuA_DDM and ShuA_OM systems, respectively, with the GROMACS MD package (v2018.2) [41]. To prepare the system prior to the simulation productions, each system was minimized and equilibrated by using the CHARMM-GUI default simulation parameters. In brief, we minimized each initial molecular configuration with the
11
steepest descent algorithm and an energy tolerance lower than 1000 kJ.mol−1.nm−1. In the second stage, the minimized systems with restrained forces on the protein-detergent/membrane complex were equilibrated at constant volume and temperature (NVT) at 300 K (ShuA_DDM) and 310 K (ShuA_OM) for 400 ps using the Berendsen thermostat (with a coupling constant τT = 1.0 ps). This stage was followed
by two restrained and unrestrained equilibration stages (30 ns in total) in the NPT ensemble with the temperature and the pressure controlled with the velocity-rescale (v-rescale) thermostat [42] (with τT =
1.0 ps) and the Parrinello–Rahman barostat [43,44] (with τp = 5.0 ps and a compressibility value of 45 x
10−6 bar−1), respectively. During these stages, the restraint forces on the ShuA-detergent/lipids complex were gradually reduced from 1000 to 0 kJ.mol−1.nm−1. The MP-detergent/lipid complexes were then simulated with the Nose-Hoover thermostat [45,46] (with τT = 5 ps) and the Parrinello–Rahman barostat
and with an isotropic (ShuA_DDM) and semi-isotropic (ShuA_OM) pressure coupling schemes. As previously [36][47], additional dihedral angle restraints were also applied to keep all the sugar rings in the LPS in the chair conformation and these restraints were kept in the production simulation. The electrostatic interactions were evaluated with the particle mesh Ewald (PME) algorithm [48] with a cutoff of 12 Å and the van der Waals interactions were smoothly switched off at 10 – 12 Å by a force-switching function [49]. The P-LINCS algorithm [50] was applied to constrain bond lengths to their equilibration values. Periodic boundary conditions and a time step of 2 fs for integration of the equations of motion were used with the neighbor list updated every 100 fs. The atomic configurations of the five systems were collected every 5 ps and the structural properties analyzed and discussed in the main text or in the supporting information using different GROMACS tools and programs developed by us.
3. Results and discussion
3.1. SEC-MALLS and SEC-SAXS analysis
12
SEC-MALLS analysis has been performed on ShuA_DDM complex in order to characterize the homogeneity of ShuA_DDM complex, the oligomerization state of ShuA in the complex and determine the number of DDM molecules bound to the ShuA transmembrane domain, value that will be used in MD simulations. Fig. 4a shows both UV absorbance at 280 nm (blue line) and LS90° (red line) signals for a solution of ShuA at 1.6 mg/mL in 3 mM DDM eluted through the Yarra 3000 column with the Tris buffer containing 0.3 mM DDM (i.e. 2 CMC). The chromatograms display two main peaks corresponding to ShuA_DDM complex (peak 1) and DDM micelles (peak 2), the peak at V0=1.9 mL
corresponding to the void volume of the column. The light scattering (LS) signal from the MP complex is well separated from that of detergent micelles and aggregates meaning that this elution condition could be used for SEC-SAXS experiment. The molar mass (black symbols) of extra DDM micelles (~67 kg/mol for a corresponding number of 131 DDM per micelle) agrees well with literature (around 130) [51][52], and shows that the detergent exchange is achieved. The elution peak 1 presents an asymmetrical shape, suggesting the presence, at V ≈ 2.4 - 2.5 mL, of inhomogeneous complexes of molar mass higher than 400.000 kg/mol (blue symbols). Molar masses and composition of ShuA_DDM complex are determined from excess Rayleigh ratio (equations 1 to 5) using the procedure Protein Conjugate from Astra V and are depicted on the Figure 4a. The mean value of the weight-average molar mass of ShuA (empty red dots) is 84.4 ± 2% kg/mol, ca. 19% above the expected value from its 6 his-tag sequence (i.e. 70.77 kg/mol), but suggesting mostly a monomeric form of ShuA. The discrepancy could be due to accuracy of the light scattering technique, which is about 5 %, but more likely to some oligomeric forms of ShuA in DDM, which could not be separated on the Yarra 3000 column and which overestimate the protein mass fraction. The detergent mass (full red symbols) bound to ShuA was evaluated to be between 137 and 150 kg/mol, corresponding to 268 and 294 DDM molecules and a mean mass ratio of bound DDM of 1.8 ± 0.2 g/g consistent with literature [9][26][53]. These minimum and maximum numbers of DDM molecules were then used in MD simulations.
13 3.1.2. Form factor of ShuA_DDM complex from SAXS
To validate further MD simulations, SEC-SAXS experiments have been performed by injecting two samples (5 and 50 µL) of ShuA_DDM at 5.5 mg/mL, exchanged in 10 mM DDM, through the same HPLC column as for SEC-MALLS experiment and eluting with a 0.1 % DDM Tris buffer. Figure 4b depicts the forward intensity I(0) (left axis, empty red dots) and the radius of gyration RG (right axis,
empty blue square) for ShuA_DDM complex (5 µL) obtained from the Guinier analysis of each SAXS image recorded during elution. The SEC-SAXS elution profile shows as for SEC-MALLS two peaks, the first peak (frames 20 to 120) corresponding to the complex ShuA_DDM and the second peak (from frame 175) corresponding to the DDM micelles. As in SEC-MALLS experiment, the peak of ShuA_DDM complex presents an asymmetrical shape, suggesting presence of oligomers (ca. frames 25-50). We have analyzed SAXS data in the zone (> frame 50) where RG remains constant and corresponds
to the SEC-MALLS analysis. For the two injection volumes, SAXS curves have been averaged in the stable RG-zone (i.e. frames 110 to 120) and merged using the 5µL sample in the low q-range (q < 0.08Å -1) and the 50 µL sample in the large q-range (q > 0.08Å-1) (Fig. 4c). The radius of gyration of the
ShuA_DDM complex is 42 ± 0.7Å and the maximum dimension Dmax from the pair distribution function
using the program GNOM [54] is about 113 Å. By using SEC-MALLS analysis and SEC-SAXS experiment that provide respectively the number of DDM molecules around ShuA and the form factor of the ShuA_DDM complex in solution, we conducted MD simulations.
3.2. MD simulations
The MD results will be used in the next sections to discuss the structural properties of the five systems in the DDM and OM environments. Before to analyze of the simulation results, we verified that each simulated system reached equilibrium. In case of the ShuA_DDM complexes, visualization of the MD trajectories shows that the integrity of the PDC complexes during the course of two production runs is maintained. We also noticed that all the DDM molecules formed a detergent corona with a typical
14
toroidal shape around the MP as previously observed for similar systems [5][9][55][56]. Moreover, all the detergent molecules remained attached to the corona during the course of the two systems and its replicas with their maltose headgroup facing the aqueous solution and their alkyl chain in contact with the ShuA TM domain (see discussion below). For instance, computation of the total PDC-water surface contacts between all the PDC non-hydrogen atoms and the water oxygen from Voronoi-Delaunay tessellation [57] with trjVoronoi [58][59][60], shows no drifts and fluctuates along the trajectories around an average value of 88200 and 92150 Å2 indicating a stable structure for the PDC complex with 268 and
294 DDM molecules, respectively (Figure S2).
In case of the ShuA_OM system, we also checked the equilibration and the convergence of the membrane structure by plotting the lengths of X/Y box vectors (in Å). As shown in the Fig. S3, the membrane X/Y box vectors also shows no drifts during the course of the MD and fluctuates around values of 107 – 108.5 Å with an average value computed from the last 100 ns of 107.6 ± 2.6 Å, indicating that the membrane converged on the simulation timescale.
3.2.1 ShuA_DDM structure and interactions
3.2.1.1. SAXS analysis. To discuss the influence of the different environments on the structural properties
of ShuA, we have firstly validated our models of ShuA_DDM complex against SEC-SAXS experiments. To this aim, we computed the theoretical SAXS intensity curves from collection of successive snapshots extracted from the four ShuA_DDM simulations using explicit-solvent calculations with trjSaxs [56][60]. As described in details in Ref. [56], the calculation of the theoretical SAXS intensity is based on 3D fast Fourier transforms and particle meshing similar to the one used in smooth PME for computing electrostatic energies and forces. The calculations of the solution 𝐼sol(𝑞) is performed by computing the
theoretical small angle scattering intensity as the difference: 𝐼sol(𝑞) = 𝐼PDC(𝑞) − 𝛼𝐼buf(𝑞) [61][62]. 𝐼PDC(𝑞), 𝐼buf(𝑞) are the scattering intensities of the PDC and the buffer (i.e. the solution with only the
15
to take into account buffer over-subtraction [61]. For these calculations, the “solution” contained the ShuA_DDM complex and the “pure buffer” was composed by only 90000 TIP3P water and 18 Na+ ions
and simulated in the same thermodynamic conditions of the protein complex for 30 ns. In both cases, the calculation of 𝐼sol(𝑞) is carried out from conformational ensembles with 5000 individual frames as observed in last 150 – 200 ns with a grid of 2883 points, with a cubic B-spline interpolation of order 6
and a supercell σ = 4. The results of these calculations are shown in Fig. 4c in blue, red continue and
violet and green dashed lines for the four ShuA_DDM complexes simulated with 268 and 294 DDM molecules, respectively, and with the experimental SAXS curve obtained from the SEC-SAXS experiment (empty black dots). The agreement with the experimental curves is rather good reproducing well the experimental SAXS profile characteristics for all the systems, i.e. minimum at q = 0.1 Å–1 and the double-peak feature between q ≈ 0.12 and 0.2 Å–1, which differs with a single broad peak observed for pure DDM micelle [63]. We point out that the use of different trajectory points at different times in the last 50 ns of each trajectory in these calculations give very similar results (not shown) indicating that averages are fully converged. Similar profiles were obtained, for instance, with the Aquaporin0 protein in DDM [14][56]. The averaged RG of the ShuA complexed with 268 and 294 DDM, obtained from the
computed SAXS curves for each replica with the Guinier approximation at small q’s, are similar and, on average, equal to 42.0 and 42.8 Å, respectively. These values are in good agreement with the experimental value obtained from the Guinier analysis (42 Å). However, at larger q values the experimental SAXS curve better fits with a monomeric ShuA complex surrounded with 268 DDM molecules.
3.2.1.2 Protein-Detergent complex characteristics. To obtain a more detailed picture of the spatial
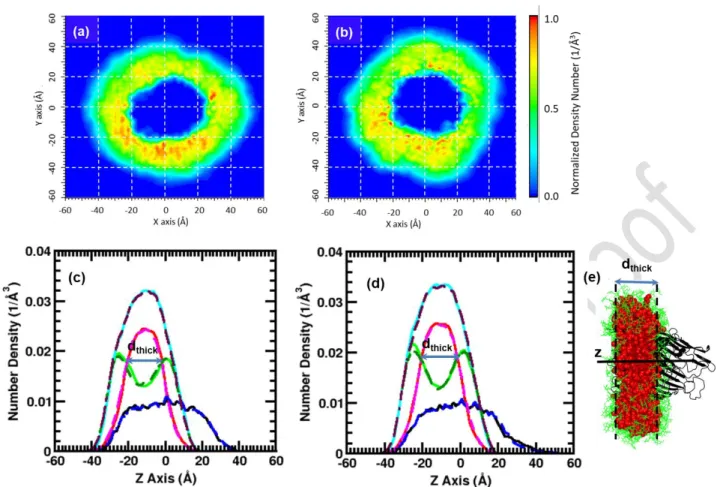
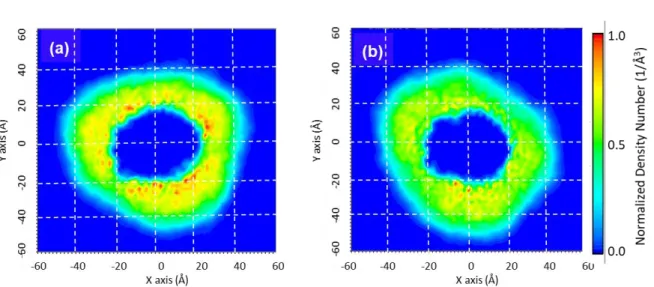
extents of the different components (i.e. the protein, protein detergent complex, the detergent, the DDM headgroup and tail) of the ShuA_DDM complex, we have computed the one-dimensional (1D) and two-dimensional (2D) density distributions along the three X, Y and Z axes from the last 150 ns of the simulations with 268 and 294 DDM molecules, using 0.5 Å grid points (Figs. 5a-c and S4). The averaged
16
2D density distributions (Figs. 5a-b and S4) show some differences in the distribution of the DDM around the molecules between the two replicas indicating a slight dependence of the starting conditions in this structural property. However, in all the case, the detergent corona forms a closed belt that follows the protein shape leading to ellipsoidal objects for the two ShuA_DDM complexes. It is also evident from the Figures 5b and S4b and the MD snapshots extracted from the ShuA_DDM complex shown in Figures 3a-b that the increase in the number of DDM molecules leads to an accumulation of some detergent molecules around the MP. The density curves overlap indicating similar structure of the PDC along the Z axis for each replica and that thedensity variation of the DDM headgroup around -28 Å compared to position ~8 Å observed for one ShuA_294DDM simulation is caused by the difference of the distribution of the DDM around the protein. From the average 1D density distributions of the PDC oriented along the Z axis and centered at Z = 0 Å (Fig. 5c-d) computed for the two replicas from the 150 ns of the runs, it is also possible to deduce the thickness of the hydrophobic (estimated as the distance where the red and green curves intersect, dthick, violet arrow) domain of the DDM corona. For the four ShuA_DDM
simulations dthick, are similar and around 22 Å. This value a bit smaller than the value estimated from the
OPM to be 24.6 ± 0.9 Å [64][65].
In Table 3, we report the corresponding average lengths of the semi-axes X, Y and Z for the protein (i.e.
Xp, Yp and Zp), the overall complex (i.e. XPDC, YPDC and ZPDC) and the DDM corona (i.e. XDDM, YDDM and ZDDM) alone estimated from the 1D and 2D density distributions for the two ShuA systems and their replicas. The average dimensions of the MP alone are similar and do not change indicating no deformation of the protein with the increase of the number DDM molecules in the corona with Xp, Yp and Zp values around to 20.0 Å, 20.0 Å and 35 Å, respectively. In case of the dimensions of the ShuA_DDM complexes, we obtained values that change a little between each replica and are on average of 42 – 46.0 Å, 43.5 – 46.5 Å and 39.0 Å that confirm that two complexes can be modeled as oblate (X = Y > Z) or tri-axials ellipsoids. In case of the average dimensions of the detergent belt (i.e. XDDM, YDDM and ZDDM),
17
the length of a DDM molecule (around 24 Å calculated with Pymol [66]). A more detailed analysis of the interactions between the detergents and the different protein domains will be described in the section
Structure of the DDM in the PDC corona. There are few studies characterizing the properties of the
detergents in the corona of membrane proteins and in DDM in particular. For instance, the works of Berthaud et al [9] showed that the DDM corona of the solubilized Aquaporin-0 tetramercould be fitted using parameters (i.e. overall thickness of the detergent layer and extent of hydrophobic/hydrophilic regions) that were in agreement with experimental parameters of protein-free detergent micelles [67]. But can we generalize this result to all MPs solubilized in DDM and compare MP-corona to protein-free micelles? To examine this aspect in case of the simulations with the ShuA_DDM complexes, we completed our analysis by investigating specifically the hydration and conformational properties of the DDM molecules forming the corona and compared with previous MD results obtained, for instance, with pure DDM micelles simulated with the same CHARMM36 force field (Tables S1-3) [31]. All these analyses were done for each ShuA_DDM and its replica and detailed in the sections S1 and S2 in supplementary information and a brief discussion of the overall results is given below.
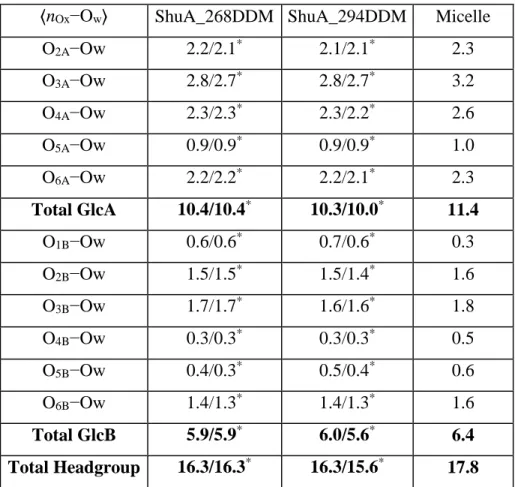
Concerning the surface contacts properties between the water and DDM, they were investigated by computing the Voronoi surface with the trjVoronoi code [58][59][60]. The results reported in Table S1 show similar values independently of the replica and the number of DDM in the complex. The surface contacts shared between the different parts of the DDM molecule (namely the headgroup and alkyl chain) decrease a little with the increase of the number of DDM in the corona but remain close to the value found for pure DDM micelle (around 200.0 and 20.0 Å2, respectively). Also in agreement with the micelle results [31], we found that the surface contact between the water and DDM headgroup in the two systems represents the major part (92 %) of the total hydration of the DDM corona.
When one focuses specifically on the average number of hydration water of the DDM maltose headgroup and alkyl chain in each system, our calculations showed that the average number of water within 3.5 Å each DDM is around 10, which is similar to the values found for DDM micelle with MD [31] or estimated
18
from SAXS [51], fluorescence quenching (TRFQ) techniques [68] or DDM around a model of membrane protein (RC-LH1-PufX) [63] or OmpA [11] reported to be 8 and 12.5, respectively. Moreover, consistent with the calculated larger surface areas mentioned above, the results also show that the hydration of the DDM headgroup show some differences depending on the position of the glucose on the headgroup (see Tables S1 and S2 and discussion), in agreement with results obtained in DDM micelle [31].
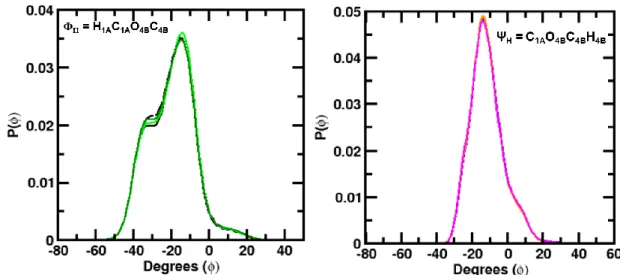
In previous papers [31][69], we also showed that the slight changes of the detergent conformation can modify the detergent hydration or the interaction between adjacent headgroup at the micelle surface. To investigate this in more details, we focused on the conformational properties of the DDM headgroup and alkyl chain of the two ShuA_DDM systems. The detailed analysis are reported in the section S2 in supplementary information. Taking together, the results show that the conformations of the DDM in the corona are quite similar between the four systems and close to results we found previously in micelle [31]. In particular, we found that the alkyl chain of the surfactant are similarly folded (with 72.1 % of CCCC in trans conformation) lending a significant reduction of the DDM alkyl chain 12.0 Å (16.7 Å when stretched according to Tanford [70]), which is similar to the length of the DDM alkyl chain in micelle (12.3 Å) [31] or approximatively equal to the half of the dthick value estimated above with the
radial density functions. For the DDM headgroup, its thickness is also reduced (9.6 Å, to be compared to the length of the maltose in fully extended conformation (10.3 Å) computed with Pymol [66]) due to its partial folding and comparable to the thickness value found in micelle (9.8 Å) [31]. The slight differences in the two ShuA_DDM systems for the headgroup conformations (see Fig. S1) may explain the slight differences in the headgroup hydration mentioned above (see results in Table S3 and Fig. S1 and discussion).
3.2.2 ShuA structure in the micelle and the membrane environments
3.2.2.1. Stability and structure of ShuA with the DDM and in the outer membrane. In the following
19
structure and stability of ShuA. To this aim, we firstly evaluated the stability of the protein by monitoring the root mean-square deviation (RMSD) of the overall protein Cα atoms (in black and grey colors) and
those located in the 11 ECL (in red and magenta colors) and in 22 TM β-barrels (in green and dark green colors) from the minimized crystal structure (Figs 6a-c). Overall, one can first remark that the two replicas of each ShuA_DDM system give similar results and that the detergent corona and the OM imposed only minor structural changes on ShuA compared to crystal structure, since we see that the RMSDCα for the overall protein are stable during the course of the three MD runs with a plateau between
3.0 - 3.5 Å, which is indicative of the conformational similarity of our MD simulations to the protein minimized structure. The jumps of the RMSD for overall Cα atoms observed at ~180 and 160 ns in the
simulations of the 268 and 294DDM systems, respectively, are mainly caused by larger structural fluctuations of protein EC loops (in red and magenta) and in less extent of the protein helices (not shown) as suggested by the corresponding RMSDCα. We also notice that the amplitude of the RMSDCα values of
the Cα atoms in the 22 TM β-barrels slightly differ between the DDM and OM environments (RMSDCα
= 1.0 vs. 2.0 Å) probably caused by the slight arrangement of the conformation of the ShuA TM domain induced by the membrane environment during the equilibration stages. But as reported elsewhere (for instance in refs [18][45][46][71]), the RMSDCα values of 22 TM β-barrels are found very stable
indicating that the TM barrel domain of the protein is strongly stabilized by the detergent corona and the membrane lipids during the course of the simulations. These results contrast with RMSDCα of EC loops
that shows significant differences between the two environments. This behavior can be explained by the fact that in DDM the ECLs are in direct contact with the solvent and can move freely whereas, in the OM environment, the loops can interact with the surrounding LPS reducing their structural changes. These behaviors are confirmed by the time evolution of the secondary structure of the ShuA computed with the
do_dssp tool [72] of GROMACS and depicted in Figs S5-7. This stabilizing effect of the LPS sugar core
on the EC loops stability was also observed in other MD simulations [36] and could be important in the function of ShuA and BtuB protein as noted previously [8][22].
20
The calculated root mean-square fluctuation (RMSF) of the protein Cα from the last 100 ns for the five
systems and the crystal are plotted in Fig. 7f. In addition to these figures and to better visualize the different protein regions that have the larger flexibility in the different environments, we provided in Figs 7a-e, the 3D representations of ShuA with its different domains colored according to the residues RMSFCα. We first point out that the amplitudes of the fluctuations of residues (e.g. around 50, 90, 135,
etc.) located in some loop regions of the protein slightly vary depending on the replica and may be caused by the localization differences of the surfactant near these loop regions that affects their motilities. The computations of the correlation coefficients R for the protein α carbons from “Crystallographic vs. simulation RMSF” estimated for the former with the crystallographic Debye–Waller B-factor
(with RMSFCα,i= √(3Bi/8π2) where B
i is the B factor of the ith protein Cα atom [73][74]) are shown in
Fig. S8 for all the systems. The figures clearly identified the greater mobility of some residues located in the loops compared to the crystal and leading to a comparable weak correlation (R = 0.335 – 0.526) between the mobility of the ShuA residues in crystal and in the simulations. A more detailed analysis of the RMSF for all the simulations shows that the β-barrels are very rigid in both environments independently of the replica, with RMSFCα values smaller than 1.0 Å, indicating, once again, a strong
stabilizing effect on the detergent corona and the membrane lipids on this domain. In particular, the N‐
terminal plug domain (delimited with Thr1 to Gln130, not shown in the Figs), is also stable (low
RMSFCα) in the two environments. We also notice that some regions of the protein such as the 5th helix (e.g., H5 (residue 599-603)) or some extracellular loops (e.g. ECL2 (residues 176 – 189), ECL3 (residues 225 – 238)) or those missing in the crystal (e.g.; ECL4 (residues 279 – 286), ECL5 (residues 325 – 344) and ECL10 (residues 572 – 586)) or the long loop ECL7 (residues 416 – 447) and the periplasmic loops (e.g. PPL1 (residues 131 – 136), PPL5 (residues 304 – 308) PPL6 (residues 360 – 363) or PPL8 (residues 462 – 469)) can exhibit large nobilities depending on the replica due their different contacts with the DDM or membrane lipids (Fig. 7). Several of these loops contain important residues involved in the
21
protein function such as ECL7 that contains the NPNL (Asn434-Leu437) domain, which is highly conserved in all heme transporters.
3.2.3 ShuA detergent and membrane interactions
To highlight the different factors that may influence the conformational stability of ShuA in the detergent and outer membrane environments, it is important to consider how the detergent molecules and the membrane lipids interact with the different domains of the protein. To visualize the different interaction sites between the detergents and the protein, we performed a contact analysis and computed the average number of atomic contacts between the alkyl chain and headgroup of the detergent and each protein residue non-hydrogen atoms during the last 100 ns of each run (Fig. S9-10). For these calculations, to define a contact, we used a cutoff distance of 4.0 Å [31,36], i.e. a residue was considered a contact if any of its atoms was at a distance less than a cutoff from any of the detergent atoms. In addition, as for the RMSFCα calculations, we provided a colored 3D representation showing the different contact sites of
ShuA according to the average number of contacts between each residue and the overall DDM (Figs. 8 - 9 and S9). From these figures, one can first notice that the contact patterns for the two ShuA_DDM systems present similar features and the results are comparable between the replicas. In particular, as it would be expected from the ShuA structure where the interior of the β-barrel is polar and partially filled with water, most of the inward-facing β-barrel residues (colored in blue in the Figs.) as well as the N‐ terminal plug domain (Thr1- Gln130) including the TonB‐box (Met4‐TVTAT‐Gly10) do not interact with any DDM molecules. Moreover, the residues in the β-strands mainly interact with the headgroup or the tail of the DDM. Another interesting feature is that, in agreement with the 3D representation (Figs. 8 - 9 and S9) and the 1D-density profiles (Fig. 5c-d), most of the ShuA periplasmic loops that are located near the limit of corona or that are very mobile (e.g., PPL5 (residues 304-308), PPL6 (residues 360-363), PPL8 (residues 462 – 469) or PPL11 (residues 604 – 611)) can interact with the detergent molecules.
22
This is in contrast with the ShuA extracellular loops where most of them interact only with water since the DDM corona is located a bit far from them.
The crystal structure of ShuA (PDB entry: 3FHH) crystallized with OG (Figure S12) suggests that specific residues, such as Trp566, Phe570, Gly588, Asp590 located in the outer-surface of the 19th and 20th β-strands, respectively, are in close contact (distance < 4.0 Å) and thus can interact with the OG.
From the Figs. S6 and S7, one can see that these residues (highlighted with a star in the Figures) are also in close contact (recover) with the headgroup or the alkyl chain of the DDM in the four ShuA_DDM systems.
In the case of the ShuA_OM system, we built a model of an asymmetric membrane with an outer leaflet composed of LPS, and with a mixture of bacterial phospholipids (75% PPPE, 20 % PVPG and 5% cardiolipin) in the inner leaflet. Therefore, it would be expected that the ShuA TM domain traverses the two membrane leaflets and interacts with the LPS or the phospholipids. To investigate this in more details, we also computed the average 1D density profiles for the different components of the OM (i.e. LipidA, LPS sugar core, PPPE, PVPG, PVLC2, the K+/Cl- and Ca2+ ions and water, Figure S13) and performed the same type of contact analysis as for ShuA_DDM systems for the lipids (Figure S14). From the 1D density profile and similarly to previous studies [36][75][76], one can first notice that the LipidA and the sugar cores of the LPS recover a large part of the protein extracellular domain (delimited region of 10 Å < Z < 30 Å) whereas the bacterial lipids are mainly located in the periplasmic region (Z < -10 Å) of ShuA. Some portions of the extracellular loops (e.g. ECL4 and 5) and β-strands (e.g. 19th and 21th) can interact with both the LipidA headgroup and the inner core or the water; the β-strands mainly interact with LPS or phospholipid acyl tails and finally the turns on the periplasmic side mainly interact with PPPE and PVPG phospholipids and water. Interestingly, a closer examination of the possible contact between the protein and the cardiolipin molecules show no significant interaction sites on the protein during the course of the simulation (Figs. 9 and S14). This may be explained by the fact that these molecules are too far from ShuA (not shown) and their lateral diffusion is too slow to see their
23
rapprochement towards the protein within the simulation time scale (∼200 ns). In case of the K+/Cl-ions,
they are widely distributed into the water phase or for few of them near the membrane (Fig. S13 left). The Figure S13 also shows the distribution of the Ca2+ ions and indicates that they are mainly localized in the LPS inner core domain (delimited region of 5 Å < Z < 30 Å) with two well-defined peaks (a strong peak at ~10 Å and smaller peak at ~22 Å). Few Ca2+ ions were also found in the periplasmic domain of
the protein. The first peak corresponds to the binding sites of the LPS phosphate groups (maroon in Fig. S13 right) in agreement with refs. [38][40][77] and the second peak to possible Ca2+-protein binding sites such as Asp380, 384 and 386 that are located at the protein surface in the ECL6 and at the beginning of the 21th β strand. These residues are also found to bind the Pb2+ ions in the crystal (Fig. S15)[21]. The water density profile also shows that water molecules penetrate deeply inside the inner and outer core sugar of the LPS and solvate the lipid headgroup regions (not shown) with a slight penetration into the hydrophobic hydrocarbon tail region. Water also fills the ShuA β-barrel and, as we found for ShuA in the DDM environment, the N‐terminal plug domain interacts only with water and the ions.
In previous simulations of OMPs in various models of outer membranes [78], it was shown that the lengths of the lipidA and the phospholipids have a strong influence on the membrane properties such as the membrane hydrophobic thickness, Tmemb. Here, we simulated a membrane formed with LipidA with
four C14 and one C12 chains and with phospholipids with C16 and C18 chains. It is therefore expected that our membrane model will have a larger Tmemb than other OM membranes such as for P. aeruginosa
or E. Coli, which are made of LipidA with shorter alkyl chain (i.e.; C12) [36][76] of 20 – 22 Å in length. To investigate this aspect, we computed the hydrophobic thickness of the membrane, Tmemb, from the
average distributions along the Z axis of C2 and C4 atoms (i.e., the carbon bonded to carbonyl group) of lipid A and the acyl chain C2 carbon atoms (i.e., the carbon bonded to carbonyl group) of PPPE, PVPG and PVCL2 phospholipids [76] and compare with the density profile of the ShuA TM β-barrel domain only (blue and red peaks and black curve, respectively in Figure S16a). We estimated a value for Tmemb
24
to be 24.6 ± 0.9 Å [64][65] but also with length of the hydrophobic domain of the DDM corona computed above.
Finally, ShuA is rich in positively charged residues such as Lys and Arg located at its outer surface and in particular at the beginning of some β-strands (i.e., region Z > 10 Å) or some extracellular loops (Fig. S17 and Table 1). These preferential localizations may enhance their bindings with the surrounding negatively charged PO32-and COO– groups of the LipidA headgroup or the AHEP and AKDO sugars of
the LPS inner core located nearly at the same level in the membrane. In the inner part, negatively charged residues such as Asp and Glu located in some periplasmic loops, which participate to polar contacts in the ShuA crystal lattice (Figure S18), are masked by DDM sugar heads, in contrast to OG where the headgroup and the alkyl chain of this surfactant are significantly smaller and gives to a surfactant corona with a smaller thickness (data not shown).
4. Conclusion
To shed light the impact of the amphiphilic environment on the structural stability of membrane proteins in view of their crystallization in detergent micelles, we investigated the large heme/hemoglobin outer membrane transporter, ShuA from Shigella dysenteriae by experimental (SEC-MALLS & SEC-SAXS) and explicit MD simulations. ShuA contains 640 residues and shares common structural features with other TBDTs such as a rigid cylindrical β-barrel formed with 22 antiparallel β-strands connected by long ECL loops and short PPL turns. The protein was first studied in presence of DDM micelles, which is one of the most commonly used detergent. Thus, by SEC-MALLS and SEC-SAXS experiments we could first determine, the number of the detergent molecules bound to the protein TM-domain (about 268 - 294 DDM / ShuA) and the shape of the ShuA_DDM complex, respectively. Using these experimental results, we could meaningfully model the protein detergent complex by atomistic MD simulations and compare its structural behavior with that of the protein inserted in a realistic model of gram-negative bacterial outer membrane formed by a mixture of lipopolysaccharide and long chain bacterial phospholipids. Our
25
model and simulations of the PDC were also validated by the calculation of the theoretical SAXS curves from the multiple MD trajectories, which were found in good agreement with the SAXS profile obtained from SEC-SAXS experiments.
Concerning the structural properties of ShuA in detergent micelles, we find that the DDM corona forms a large closed belt (with a thickness of 22 Å) located near the periplasmic region of the protein and covers a large part of the ShuA TM domain. The study of the DDM properties in the corona indicates that the detergent molecules share similar structural features as already described for pure DDM micelles, such as, similar accessibility to the solvent, hydration degree and conformation of the detergent alkyl chain and headgroup. Concerning the structure of ShuA in the DDM and OM environments, our MD simulations reveal that the detergent and the membrane impose only minor structural changes to the inner core of the protein structure compared to the crystal structure. Indeed, in agreement with previous studies, we find that the TM domain delimited by the 22 β-barrels covered by the DDM molecules or the membrane lipids are very stable (RMSDCα < 2.0 Å) in contrast with the extracellular and periplasmic
loops where we observe larger flexibilities in DDM environments than in OM. In both cases, a value of less than 4.0 Å for the RMSDCα of the overall protein Cα was found. The analysis of the interactions
between the protein and the different lipids of the outer membrane shows that the LipidA and the sugar core of the LPS recover protein extracellular domains and that the bacterial lipids (PPPE, PVPG) interact with the periplasmic loops. The thickness of the membrane formed with the C14 and one C12 chains of the LPS and the C16 and C18 chains of the PPPE and PVPG is close to the thickness of the TM hydrophobic domain of ShuA (around 24.6 Å), thus favoring its stability. We also observe that the preferential localizations of the positively and negatively charged residues at the outer surface of the β-barrel or the ECL may enhance their bindings to the surrounding positive ions (such as Ca2+) and
negatively charged PO32- and the COO- groups of the LipidA headgroup or the AHEP and AKDO sugars
in the LPS inner core, thus reducing significantly their movements. On the other hand, it may also favor polar contacts with negatively charged residues of the inner surface leading to possible crystallization.
26
To conclude, this combined study of experiments and MD simulations have been able to discriminate between effects observed on the structure and the interactions of ShuA due to detergent and native environments. Thus, our approach should be beneficial in future studies for choosing adequate detergents for crystallization.
27
List of Figures
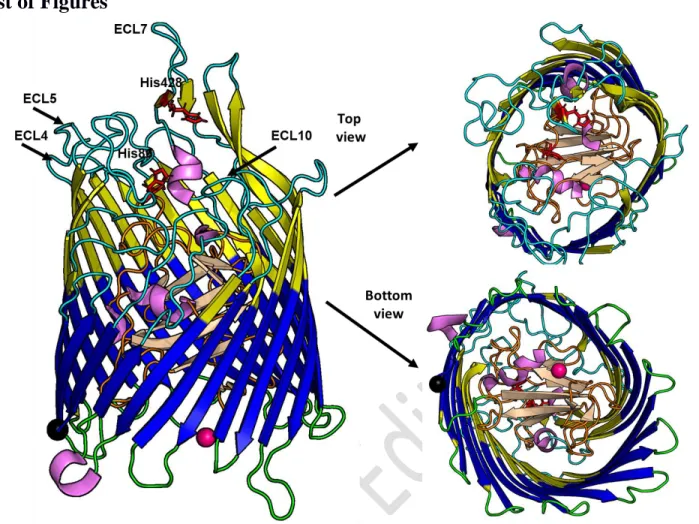
Figure 1: Representative views of the complete structure of ShuA from Shigella dysenteriae (PDB entry:
3FHH) with all the extracellular loops and missing residues (ECL4, ECL5 and ECL10 in the Figure) rebuild with ChimeraX [28] and SCWRL4.0 [29]. The N and C term residues are highlighted in hot pink and black spheres, respectively. The 11 extra and periplasmic loops are in cyan and green colors respectively whereas the five helices are in pink. The 10 β-strands in the TonB plug domain as shown in cartoon and in the wheat color.The transmembrane domain region is highlighted in blue color and taken from Orientations of Proteins in Membranes (OPM) database (http://opm.phar.umich.edu/) [64].The conserved histidine residues H86 and H428 in the ShuA rebuild structure are shown in red stick.The protein has 640 residues and contains 54.5 %, 3.1 % and 41.7 % of β-strands according to the DSSP program [79], (see also Table 1). Figures were produced with the PyMOL program [66].
28
Figure 2: Chemical structures of the detergent, the bacterial lipids and the lipopolysaccharide (LPS) of Shigella flexneri strain used in this study. (a) n-Dodecyl-β-D-Maltopyranoside (DDM), (b) palmitoleoyl(16:1cis-9)-phosphatidylethanolamine (PPPE), (c) 1-palmitoyl(16:0)-2-vacenoyl(18:1cis-11)-phosphatidylglycerol (PVPG) (d) 1,1′-palmitoyl-2,2′-vacenoyl cardiolipin (PVCL2) and (e) lipid A and the inner and core region denoted by colored hexagons. EtN, ethanolamine; Glc, glucose; Hep, heptose; KDO, 2-keto-3-deoxyoctulosonic acid; P, phosphate. The lipid A of Shigella flexinari consists of two d-glucosamine residues joined by a β-(1→6)-linkage, two monophosphoester groups at O1 and O4’, and six amide/ester-linked fatty acids with different chain lengths. The inner R1 core has two Kdo residues and two Hep residues, one of which have a diester-phospho-ester group at their O4 position and bonded to an ethanolamine (EtN). The outer core consists of five hexopyranoses, three D-glucoses, and two D-galactoses, all of which are α-linked, except for
29
Figure 3: Representative snapshots of ShuA in the 268DDM (a), 294DDM (b) and embedded the outer
membrane (c) with Lipid A, sugar core, PPPE, PVPG, and PVCL2 in red, black (sticks), magenta, orange, and lime green spheres, respectively. The different regions of the proteins were colored as in Figure 1. Calcium ions are green cyan sphere. Water molecules and KCl ions are omitted for clarity (see main text for details). Figures were produced with the PyMOL program [66].
30
Figure 4: (a) SEC-MALLS elution profile of ShuA_DDM, 20 µL injected at 1.6 mg.mL-1 in 3mM DDM, eluted on a silica gel Yarra SEC-3000 at flowrate of 400µL.min-1, with 50mM Tris pH 7.5, 0.3mM DDM: UV absorbance at 280 nm in blue (solid line), Rayleigh ratio in red (solid line), symbols (and
) represent the calculated molar masses for the protein and the detergent respectively. (b) SEC-SAXS profile of ShuA_DDM, 5 µL injected at 5.5 mg.mL-1 in 10 mM DDM, eluted on a silica gel Yarra SEC-3000 at flowrate of 300µL.min-1, with 50mM Tris pH 7.5, 0.1% DDM: forward intensity I(0) (empty red dots), radius of gyration (empty blue dots). (c) The merged SAXS curve of ShuA_DDM complex is obtained from the 5 µL-sample at 5.5 mg/mL in the low q-range and the 50 µL-sample at 5.5 mg/mL in the large q-range. Comparison between the experimental SAXS (empty black dots) and the calculated SAXS curves for the four ShuA_DDM systems.31
Figure 5: Averaged 1D density profiles (bottom) and 2D density maps (top) of the DDM detergent
atoms. Here the ShuA_DDM complex was centered at Z = 0 Å. The Z-axis is the principal axis of the protein. A grid spacing of 0.5 Å was used. In the 1D profiles, the protein, the alkyl chain, the headgroup and the whole DDM are shown in black, red, green, violet and blue, magenta, dark green, cyan lines for the first and second replicas, respectively. (a and c) 268 DDM, (b and d) 294 DDM. The 2D density maps of the second replicas are shown in Fig. S4 in the supporting information.
32
Figure 6: Root mean square deviations (RMSD) computed from the minimized X rays structure of ShuA
for all Cα (black and grey colors), extracellular loops (red and magenta colors) and TM barrels (green
and dark green colors) in the micelle with 268 (a) and 294 (b) DDM molecules and their replicas and in the outer membrane (c).
33
Figure 7: Colored 3D representation of ShuA (a and c) with 268, (b and d) 294 DDM and (c) in the outer
membrane environments according to the RMSFCα. In the panel (d) RMSFCα calculated from the MD
simulations of ShuA with 268DDM (black), 294DDM (red) and in the bacterial membrane (blue) and from the experimental B-factor (green). For each picture, the minimum and maximum RMSFCα values
are indicated in the right of each color bars. The ECLX and PPLX labels indicate the extracellular and periplasmic loops with the highest RMSFCα. The orange spheres delimit the transmembrane domain
according to OPM [64]. See main text for details. The RMSFCα fluctuations of the ith protein atom were
estimated from the crystallographic Debye-Waller B-factors, (with 𝑅𝑀𝑆𝐹Cα = √(3Bi/8π2) where ith
protein atom) [73][74]. The orange, red, cyan and maroon vertical bars in RMSF figures delimit the TM barrels, periplasmic, helix, and extracellular loop regions according to the data listed in the Table 1. Figures were produced with PyMOL [66].
34
Figure 8: Colored 3D representation of ShuA in the DDM environment (first replica) with (a) 268 and
(b) 294 molecules according to the number of contacts between the protein heavy atoms and the DDM heavy atoms. The contact analysis was carried out using a cutoff of 4.0 Å and each residue colored based on its respective number of contacts from low (blue) to high (red). The orange spheres delimit the transmembrane domain according to OPM webserver [64]. See main text for details. The corresponding figures for the second replica are shown in Fig. S9. Figures were produced with PyMOL [66].
35
Figure 9: Colored 3D representation of ShuA in the outer membrane according to the number of contacts
between the protein and the lipid heavy atoms of the bacterial membrane. The contact analysis was carried out using a cutoff of 4.0 Å and each residue colored based on its respective number of contacts from low (blue) to high (red). The orange spheres delimit the transmembrane domain according to OPM webserver [64]. See main text for details. Figures were produced with PyMOL [66].
36
List of Tables
Secondary Structures
Number Residue Positions
Helix 5 (37 – 43), (67 – 69), (93 – 95), (418 – 424)+, (599 – 603) All β – Strands 9+24 (4 – 5), (13 – 14), (22 – 26), (48 – 50), (61 – 63), (71 – 75), (78,79), (97 – 104), (118 – 124), (137 – 146), (151 – 161), (165 – 176), (190 – 203), (208 – 224), (239 – 255), (265 – 278), (287 – 303), (309 – 325), (344 – 359), (364 – 379),(385 – 398), (404 – 415), (427 – 429)+, (437 – 439)+, (448 – 461), (470 – 491), (496 – 517), (522 – 534), (545 – 555), (562 – 571), (587 – 597),(605 – 611), (632 – 640) Transmembrane Domain Region 22 (138 – 146), (151 – 160), (165 – 174), (194 – 202), (208 – 216), (248 – 256),(263 – 271), (294 – 303), (309 – 319), (350 – 359), (364 – 372), (390 – 399), (404 – 411), (452 – 461), (470 – 478), (510 – 518), (521 – 528), (549 – 556), (562 – 570), (590 – 598), (605 – 612), (632 – 639) Internal Loop (BtuB domain) 10 (2 – 3), (6 – 12), (15 – 21), (27 – 36), (44 – 47), (51 – 60), (64 – 66), (80 – 92), (105 – 117), (125 – 130) Extracellular Loops (ECL) 11 (147 – 152), (176 – 189), (225 – 238), (279 – 286), (325 – 344), (379 – 384), (416 – 417)*, (425 – 426)*, (430 – 436)*, (440 – 447)*, (492 – 495), (535 – 545), (572 – 586), (612 – 631) Periplasmic loops (PPL) 11 (131 – 136), (162 – 164), (204 – 207), (257 – 262), (304 – 308), (360 – 363), (400 – 403), (462 – 469), (519 – 520), (557 – 561), (604 – 605)
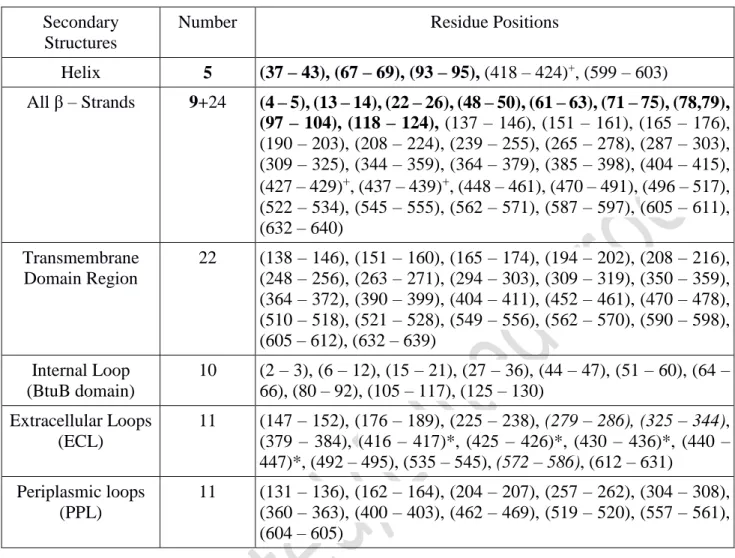
Table 1: List of the residues involved in the secondary structure domains of ShuA (PDB ID: 3FHH).
The 3 helix and 9 -strands in bold are considered to belong to the TonB plug domain. The transmembrane domain region lists 22 transmembrane -Strands in contact with the membrane according to OPM webserver [64] and that belongs to the 33 -Strands of the protein. The loops in italic contains the missing residues and atoms missing the protein crystal due to their flexibilities and those highlighted with an asterisk belong to 7th extracellular loop and are separated with 2 β-strands and one helix
highlighted with an upper cross.
System Det/Lipids Ndet/Nlipids NNot Nwater Nions Lbox tsim
ShuA_268DDM DDM 268 301398 90000 18 Na+ 143.03 200/220 ShuA_294DDM 294 303504 200/220 ShuA _OM LPSA/PPPE/ PVPG/PVCL 2 48/ 105/ 28/7 168147 37970 216Ca2+, 163K+, 103Cl -1062x160 200
37 Table 2: A summary of the simulated system. Ntot, Nions, Lbox and tsim are the total number of atoms in
the system, numbers of ions box lengths (Å) and the simulation time (ns), respectively.
Table 3: Average length (in Å) of the ShuA_DDM complex systems (PDC), the protein alone (P) and
the surfactant corona (DDM) for the first and the second replicas (*) estimated from the 1D and 2D density distributions. See main text for details.
Corresponding Authors
$ Stéphane Abel (stephane.abel@cea.fr) & Françoise Bonneté (bonnete@ibpc.fr)
Address where the experimental work was done
†Institut des Biomolécules Max Mousseron (IBMM) UMR 5247 CNRS-UM-ENSCM, Chimie
Bio-organique et Systèmes Amphiphiles, Université d’Avignon, 301 rue Baruch de Spinoza, F84000 Avignon, France
Author Contributions
K.B. purified and supplied the protein for experiments; J.S., S.F and F.B performed the experiments, analyzed the data: S.A and M.M performed simulations; S.A, S.F, M.M and F.B conceived, designed the project and wrote the manuscript.
Funding Sources
This project was supported by the ANR programs « Investissements d’Avenir ANR-10-LABX-05-01 » and “Laboratoires communs organismes de recherche publics – PME/ETI” ANR-14-LAB7-0002
System ShuA_268DDM ShuA_294DDM
XPDC 47/45* 45/40* YPDC 43/42* 46/47* ZPDC 39/39* 39/39* XP 20/20* 20/20* YP 20/20* 20/20* ZP 35/35* 35/35* XDDM 27/25* 25/20* YDDM 23/22* 26/27* ZDDM 16/16* 16/16*
38 CHEM2STAB. This work was also granted for access to the HPC resources of [CINES/IDRIS/TGCC] under the allocation 2018-A0040710413 made by GENCI. We also acknowledge the CCRT for accessing to the supercomputer Cobalt where some analyses were performed.
Supporting Information
Additional results, tables and figures
Acknowledgements: We acknowledge the French Synchrotron Radiation Facility (SOLEIL) for the
provision of synchrotron radiation facilities and Javier Perez on SWING (SOLEIL) for assistance in using the beamline. We also acknowledge Jean-Jacques Lacapère (LBC Paris) and Sophie Combet-Jeancel (LLB Saclay, France) for fruitful discussions.