HAL Id: hal-00295629
https://hal.archives-ouvertes.fr/hal-00295629
Submitted on 2 Mar 2005
HAL is a multi-disciplinary open access
archive for the deposit and dissemination of
sci-entific research documents, whether they are
pub-lished or not. The documents may come from
teaching and research institutions in France or
abroad, or from public or private research centers.
L’archive ouverte pluridisciplinaire HAL, est
destinée au dépôt et à la diffusion de documents
scientifiques de niveau recherche, publiés ou non,
émanant des établissements d’enseignement et de
recherche français ou étrangers, des laboratoires
publics ou privés.
ENVISAT: detection method, validation and analysis of
the northern hemisphere winter 2002/2003
R. Spang, J. J. Remedios, L. J. Kramer, L. R. Poole, M. D. Fromm, M.
Müller, G. Baumgarten, P. Konopka
To cite this version:
R. Spang, J. J. Remedios, L. J. Kramer, L. R. Poole, M. D. Fromm, et al.. Polar stratospheric cloud
observations by MIPAS on ENVISAT: detection method, validation and analysis of the northern
hemisphere winter 2002/2003. Atmospheric Chemistry and Physics, European Geosciences Union,
2005, 5 (3), pp.679-692. �hal-00295629�
www.atmos-chem-phys.org/acp/5/679/ SRef-ID: 1680-7324/acp/2005-5-679 European Geosciences Union
Chemistry
and Physics
Polar stratospheric cloud observations by MIPAS on ENVISAT:
detection method, validation and analysis of the northern
hemisphere winter 2002/2003
R. Spang1, J. J. Remedios2, L. J. Kramer2, L. R. Poole3, M. D. Fromm4, M. M ¨uller5, G. Baumgarten6, and P. Konopka1
1ICG I, Research Centre J¨ulich, Germany
2EOS/SRC, Department of Physics and Astronomy, University of Leicester, UK
3Atmospheric Science Competency, NASA Langley Research Center, Hampton, Virginia, USA 4Computational Physics, Incorporated, Springfield, Virginia, USA
5Alfred Wegener Institute, Potsdam, Germany
6Leibniz-Institute of Atmospheric Physics, K¨uhlungsborn, Germany
Received: 26 July 2004 – Published in Atmos. Chem. Phys. Discuss.: 6 October 2004 Revised: 18 January 2005 – Accepted: 18 February 2005 – Published: 2 March 2005
Abstract. The Michelson Interferometer for Passive
Atmo-spheric Sounding (MIPAS) on ENVISAT has made exten-sive measurements of polar stratospheric clouds (PSCs) in the northern hemisphere winter 2002/2003. A PSC detection method based on a ratio of radiances (the cloud index) has been implemented for MIPAS and is validated in this study with respect to ground-based lidar and space borne occul-tation measurements. A very good correspondence in PSC sighting and cloud altitude between MIPAS detections and those of other instruments is found for cloud index values of less than four. Comparisons with data from the Stratospheric Aerosol and Gas Experiment (SAGE) III are used to further show that the sensitivity of the MIPAS detection method for this threshold value of cloud index is approximately equiva-lent to an extinction limit of 10−3km−1at 1022 nm, a wave-length used by solar occultation experiments. The MIPAS cloud index data are subsequently used to examine, for the first time with any technique, the evolution of PSCs through-out the Arctic polar vortex up to a latitude close to 90◦north
on a near-daily basis. We find that the winter of 2002/2003 is characterised by three phases of very different PSC ac-tivity. First, an unusual, extremely cold phase in the first three weeks of December resulted in high PSC occurrence rates. This was followed by a second phase of only moder-ate PSC activity from 5–13 January, separmoder-ated from the first phase by a minor warming event. Finally there was a third phase from February to the end of March where only spo-radic and mostly weak PSC events took place. The
compo-Correspondence to: R. Spang
sition of PSCs during the winter period has also been exam-ined, exploiting in particular an infra-red spectral signature which is probably characteristic of NAT. The MIPAS obser-vations show the presence of these particles on a number of occasions in December but very rarely in January. The PSC type differentiation from MIPAS indicates that future com-parisons of PSC observations with microphysical and deni-trification models might be revealing about aspects of solid particle existence and location.
1 Introduction
Despite progress in the observation, modelling and under-standing of polar stratospheric clouds (PSCs) in recent years, there are still important questions which remain to be re-solved, particularly with respect to the microphysical for-mation of solid nitric-acid-containing particles such as ni-tric acid trihydrate (NAT). Recently, the presence of NAT in the stratosphere has been definitively confirmed (Voigt et al., 2002) and the range of possible NAT particle sizes ex-tended to large radii (typically 5–10 µm) as inferred by Fa-hey et al. (2001). However, the nucleation mechanism for NAT particles remains unknown, although a large number of possible mechanisms have been suggested (Peter, 1997; Tabazadeh et al., 2001). This is important since solid parti-cles, particularly NAT partiparti-cles, are believed to contribute significantly to denitrification in a number of Arctic win-ters (e.g. Fahey et al., 2001; Carslaw et al., 2002; Mann et al., 2002) and subsequent ozone loss. It is clear that in or-der to distinguish NAT formation processes and to validate
microphysical and denitrification models, it would be highly beneficial to improve continuous monitoring of PSC cloud coverage and, where possible PSC composition, on a vortex-wide basis. Spaceborne sensors can provide an essential view of PSC evolution in both polar vortices and, in conjunction with satellite measurements of nitric acid concentrations, de-liver a better understanding and quantification of denitrifica-tion.
Since the end of the 1970s, observations of PSCs by space-borne occultation and emission instruments have been pub-lished frequently (e.g. McCormick et al., 1982; Taylor et al., 1994; Massie et al., 1998; Spang et al., 2001). The most recent instruments provide significantly enhanced ca-pabilities for the detection of PSCs including one or more of the following features: broadband and high spectrally re-solved measurements of PSCs, dedicated latitude coverage or narrow fields-of-view (FOV). In this paper, we present new results from the Michelson Interferometer for Passive Atmospheric Sounding (MIPAS) from the Arctic winter 2002/2003. The MIPAS instrument provides infra-red (IR) spectra of PSCs at high spectral resolution with unprece-dented latitude coverage of up to nearly 90◦south and north. Locations of PSCs in the Antarctic and Arctic polar vortices can be tracked daily and indications of PSC type obtained from the data. The analyses conducted in support of the ma-jor Vintersol/SOLVE II campaign, which took place during winter 2002/2003 in the Arctic, are described in this paper.
The paper is structured as follows. Sections 2 and 3 give an overview of the instrument and the cloud detection and type differentiation method, followed by a detailed valida-tion against PSC observavalida-tions from ground-based lidar and spaceborne solar occultation instruments in Sect. 4. Sec-tion 5 describes the temporal and geographical distribuSec-tion of the PSC occurrence with respect to the evolution of the polar vortex.
2 The MIPAS instrument
On 1 March 2002, the Michelson Interferometer for Pas-sive Atmospheric Sounding (MIPAS) was launched on the ENVISAT platform. It is a Fourier transform spectrome-ter providing limb sounding spectra of atmospheric infra-red emission between 685 cm−1(14.60 µm) and 2410 cm−1 (4.15 µm) at a spectral unapodised resolution of 0.025 cm−1
(Fischer and Oelhaf, 1996). The high spectral resolution en-ables for a better separation to be made between the line emission of the atmospheric trace gases and continuum emis-sion from PSCs and tropospheric clouds compared to the moderate resolution IR instruments such as the CRyogenic Infrared Spectrometers and Telescopes for the Atmosphere (CRISTA) instrument (Riese et al., 1997). With MIPAS, ver-tical profiles are scanned from 6 km to 68 km with a verti-cal spacing of 3 km in the lower stratosphere, commensurate
with the field-of-view of the instrument and hence its nomi-nal vertical resolution.
The PSC information is extracted from the MIPAS level 1b product, which consists of calibrated IR radiance spec-tra. The calibration is based on views of a warm blackbody (238 K), cold space (235 km tangent height) and a correction for non-linearity of the detectors. In this study, we utilise near-real-time (NRT) data for MIPAS processed by the ESA NRT operational processor with software versions 4.53 to 4.57 (November 2002–December 2003).
Validation studies indicate that the offset along one orbit is less than 6 nW/cm−2sr cm−1(personal communication: A. Kleinert, IMK, Research Centre Karlsruhe) and tests show that the offset error in the calibrated spectra induced by this variation is less than 2–3 nW/cm−2sr cm−1. Not all the
de-sirable MIPAS level 1b datasets were available for this anal-ysis, which was performed at the time of the Vintersol cam-paign. However, the available data are sufficient to demon-strate the key characteristics of the observed PSC distribution during the winter studied and to identify the important spatial variations of the PSCs.
3 MIPAS cloud information
3.1 Cloud detection method
The occurrence of clouds, such as PSCs, in the field-of-view of a limb-scanning instrument produces a characteristic en-hancement in the broadband continuum radiation component of the measured infra-red spectra. This enhancement can be detected with a relatively coarse spectral resolution (2 cm−1)
as was shown for the CRISTA instrument (for example, Spang and Remedios, 2003). We therefore follow the experi-ence of the CRISTA cloud analyses (Spang et al., 2002) in the cloud detection for MIPAS. This is accomplished by using the ratio of radiances in the 788–796 cm−1range, dominated by CO2, and the 832–834 cm−1 range in the atmospheric
window regions, dominated by aerosol and clouds emissions (Fig. 1). The latter region contains only weak emissions of ozone and CFC11 in comparison to the background aerosol and the enhanced cloud radiation. Both wavelength regions are in the MIPAS detector band A (685–970 cm−1)and in the following the defined ratio will be referred to as the cloud-index (CI). The method has been successfully applied to the MIPAS measurements (Remedios and Spang, 2002; Spang et al., 2004) and is in the process of implementation and val-idation in ESA’s operational MIPAS retrieval processor; the operational implementation includes cloud index derivations for MIPAS bands A, B and D (Remedios and Spang, 2003) but only CI profiles for band A are used here.
In principle, retrieved extinction profiles would be most useful for the detection of PSCs. This approach works quite well for solar occultation experiments in the visible and near-IR but is much more difficult for near-IR-emission instruments
cloud continuum offset
Fig. 1. An apodised MIPAS spectrum (in black) of an optically thin PSC with a characteristic spectral signature around 820 cm−1 mea-sured on 11 December 2002 08:09 UT at 69.9◦N and 32.8◦E in the northern hemisphere polar vortex. A curve showing a spectrum with reduced spectral resolution similar to CRISTA is superimposed in green. The red symbols present the mean radiances used for cloud detection and type differentiation (details see text).
due to problems in representing the mixed continuum and trace gas contributions when scattering is important. H¨opfner et al. (2002) have shown that the scattering of tropospheric radiation by PSCs can become significant for particle radii
>1 µm. Modelling of such clouds in the IR is then not only prohibitively expensive for routine retrievals but also it is often hampered by a lack of knowledge of source terms such as the underlying tropospheric clouds. The radiance-based cloud detection method employed here has the big adv-antage that no time-consuming retrieval process is necessary. It delivers a qualitative measure of the optical thickness of the cloud and allows a robust detection of PSCs.
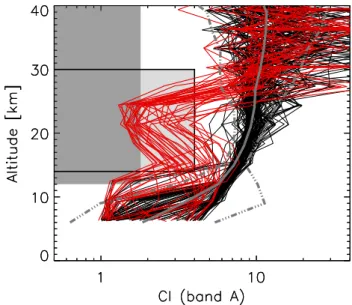
Typical CI profiles for MIPAS are shown in Fig. 2 for files for which a CI>4 does not indicate PSCs (black pro-files) and for profiles with PSCs (red propro-files). The radiance ratio decreases rapidly from one altitude step to the next from background values of around 6–10 to 1–4, if a cloud is in the field-of-view. Constant values of CI close to unity indicate optically thick conditions. Sensitivity studies for CI with the CRISTA forward radiance model and the MIPAS refer-ence forward model (RFM) were carried out and reported in Spang et al. (2004) and references therein. The temperature dependence of CI was shown to be especially weak (less than 1%/K in the 10 to 30 km range), so that a single threshold value is sufficient for the PSC study here.
In MIPAS operational processing, a conservative threshold of 1.8 has been implemented, which guarantees the detection of strong cloud events over relatively broad height range of 12–40 km. The clouds identified with this threshold value are those which are most likely to affect the retrieval of trace gases from MIPAS data. For the detection of PSCs we ex-tended the threshold value to 4 but limited the height region
Fig. 2. Cloud index profiles for the MIPAS wavelength band A in the time frame 1 to 11 December in the latitude band 75◦N to 80◦N (total 174). Red curves are highlighting profiles which are marked as ‘cloudy’ by a CI threshold value of CI<4 above 14 km. Shaded box areas indicate (a) the cloudy area in the CI height space for the MIPAS operational processor (dark grey), (b) the threshold values used in the analyses below (grey plus dark grey, framed by black line). Red curves highlight profiles which are marked as ’cloudy’ by a CI threshold value of CI<4 above 14 km. Shaded box areas in-dicate (a) the cloudy area in the CI-height-space for the MIPAS op-erational processor (dark grey) with CI<1.8 and altitudes between 12 and 40 km, (b) the threshold values used in the analyses below (grey plus dark grey, framed by black line) with CI< 4 and altitude range 14 to 30 km. A mean of PSC-free profile between 50◦-55◦N of log(CI) and log(CI) +/−2× standard deviation of log(CI) (dash-dotted) are superimposed in thick grey.
to 14 to 30 km. At this threshold level, optically thinner cloud events are detectable at levels which are still in excess of the noise level; at this threshold CI values at 15 km should still be treated with caution due to the relatively coarse FOV of MIPAS and potential effects by high tropospheric clouds.
The analysis also allows us to approximate a cloud top height (CTH) by computing the first tangent height where CI falls below the specified threshold. Essentially, this indi-cates the highest tangent altitude for MIPAS at which a PSC is observed in one vertical scan. Cloud effects at the tan-gent heights below CTH are difficult to interpret due to the mixing of emission from clouds at the actual tangent height with emission from the layers of the limb path above. In-creasing CI values below the CTH, as commonly observed for almost all PSC profiles in this study, provide indirect and approximate information about the optical thickness and ver-tical extent of the cloud since they would be consistent with an increasing thickness of PSCs if the cloud field is homo-geneous. An optically thick cloud would generate a CI value close to one. Due to the blocking effect of this layer, the
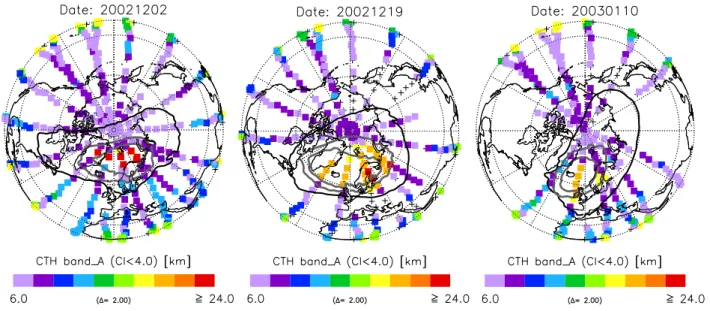
Fig. 3. Northern polar projection of CTH observations (CI<4) by MIPAS for 2 December, (the first day of distinctive PSC occurrence) 19 December and 10 January. Cloud-free profiles down to the minimum tangent height of around 6 km are marked by crosses. The black line highlights the vortex boundary (Nash-criterion) and the grey contour pair belongs to T-TN AT=0 K and −3 K, respectively, where TN AT is
calculated with constant 10 ppbv HNO3and 5 ppmv H2O). The contours are for the 575 K isentrope with the exception of 10 January for the 525 K isentrope.
CI values would stay constant at all the tangent heights be-low the first optically thick layer. For an optically thin cloud, CI values will increase for tangent heights below the altitude which contains the largest optical thickness (simply by the limb path). However, generally the CI values do not reach cloud-free values again, because the limb path is still passing through the cloud layers even for the tangent height layers below the cloud bottom. Therefore the vertical extent sug-gested by the CI profile is generally overestimated and an ac-curate determination is not achievable by the simple colour ratio method.
Examples of resulting maps of CTHs for 2 and 19 Decem-ber 2002 and 10 January 2003 are given in Fig. 3 (details in Sect. 5.2). 2 December shows the first day of distinctive PSC occurrence in the MIPAS observations (weak PSC ac-tivity is also observed on 1 December). Lower CTHs can be observed later in the season (Fig. 3c). The absolute pointing error of the MIPAS instrument and the subsequent CTH error is estimated to be of the order of 1–1.5 km. Unfortunately the pointing error drifts with time and increases for high northern latitudes. Tangent heights retrieved by the method of von Clarmann et al. (2004) show (+)0.2 km higher alti-tudes in November 2002 than the so-called MIPAS engineer-ing heights of the ESA NRT product. Until March the dif-ference changes nearly linearly to (−)1.7 km lower altitudes (M. Kiefer, Research Centre Karlsruhe, personal communi-cation). For December data in particular, the error should be smaller (<500 m) than the width of the field-of-view. Finally, the relatively broad FOV of the instrument is an additional
error source for CTH determination (±1.5 km for optically thick clouds). For thinner clouds, which need some coverage of the FOV to be detected, the error becomes asymmetrical around the tangent height and MIPAS detects systematically lower clouds.
3.2 PSC type differentiation method
A large subset of the MIPAS PSC spectra show a characteris-tic spectral feature at 820 cm−1(Fig. 1), +/−10 cm−1width, which has been analysed by Spang and Remedios (2003) using the CRISTA data. The authors showed that the ob-served features are most likely related to NAT clouds with particle size distributions of small and moderate mean radii (<2–3 µm). Those clouds which do not show the spec-tral feature and are not optically thick are most likely to be clouds of liquid sulfuric ternary solution droplets (STS, PSC type 1b), mixed clouds dominated by STS, or clouds of larger NAT particles. For a better differentiation between the so-called radiance-enhanced (RE) events at 820 cm−1
and those events which are not radiance-enhanced (NRE), we computed the percentage radiance enhancement of the mean 818.3–821.45 cm−1 emission in relation to an esti-mated background value at 820 cm−1. The latter term is computed by a simple interpolation between the mean ra-diances at the neighbouring wavenumber regions 810.25– 811.65 cm−1and 832.3–834.4 cm−1(see Fig. 1). A visual check of the spectra detected by this method gives us confi-dence that the method works properly and an enhancement
of greater than 10% has been defined for a clear signature in the continuum-like part of the MIPAS spectrum around 820 cm−1. For example, the spectrum in Figure 1 shows an
extremely large enhancement of 35%. Such strong RE events have been observed in many CRISTA PSC spectra in the southern polar vortex (Spang and Remedios, 2003, Fig. 2a) but not so frequently in MIPAS observations of the northern hemisphere.
4 Validation results
For winter 2002/2003, a number of observations of PSCs are available for comparison with the detections of PSCs from MIPAS using our analysis method. We compare here two ground-based lidar instruments and satellite occultation instruments which provide reasonable statistics for coinci-dences with the MIPAS data. Two factors are important. For the validation tests performed here, the CI threshold was set to 4, consistent with the possibilities discussed in Sect. 3.1. In addition, a visual check for each coincidence was per-formed to exclude potential misinterpretations of the CI pro-files. Secondly, each coincidence between a measurement by MIPAS and a measurement by another instrument is charac-terised by a miss-distance and a miss-time which are min-imised whilst retaining reasonable coincidence statistics. 4.1 Lidar comparisons
During winter 2002/2003 several lidar-stations at high north-ern latitudes observed PSC events quite frequently. We have concentrated the comparisons in this study on the AWI li-dar at Ny-Alesund, Spitsbergen (79◦N, 12◦E) and the ALO-MAR RMR lidar in Northern Norway (69◦N, 16◦E) (von Zahn et al., 2000). Each lidar operated at three wavelengths (353 nm/355 nm, 532 nm, 1064 nm) and measured the depo-larisation at 532 nm. As well as PSC detection, these mea-surements allow the classification of the observations into different PSC types in the traditional manner for lidar (Brow-ell et al., 1990). The classification criteria applied utilise the lidar backscatter ratio at 532 nm (R532) and volume
depo-larisation. Here liquid STS particles show no depolarisation whereas both ice and NAT particles show depolarisation but are separated by the strong R532>10 for ice particles.
Coinci-dences were calculated and analysed on a statistical basis for the December/January period for both lidar stations. For all measurement periods of the lidar stations, coincidences with MIPAS measurements were computed. The number of coin-cident MIPAS and lidar measurements is limited (1) by the number of lidar measurements, which are occasionally ham-pered by bad tropospheric weather conditions and (2) by the reduced temporal and geographical coverage of MIPAS data currently available for winter 2002/2003. Nevertheless, for cloudy and non-cloudy lidar conditions for both stations 55
0 1 2 3 10 12 14 16 18 20 22 24 26 28 30 Backscatter Ratio Altitude / km
Ny−Ålesund 09−Dec−2002 00:27 − 00:38 UTC
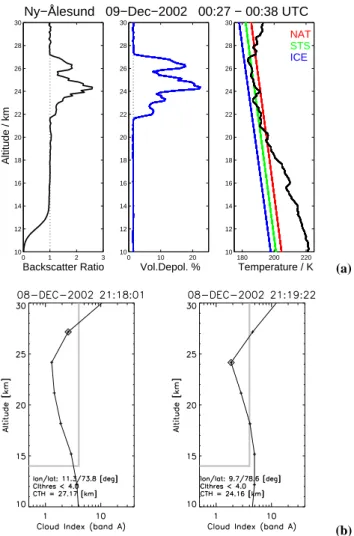
0 10 20 10 12 14 16 18 20 22 24 26 28 30 Vol.Depol. % 180 200 220 10 12 14 16 18 20 22 24 26 28 30 Temperature / K NAT STS ICE (a) (b) Fig. 4. (a) AWI lidar single profiles of backscatter ratio and volume depolarisation as well as corresponding radiosonde measurements at the station. (b) MIPAS coincidences with a miss-time of ∼3 h and miss-distance of 383 km (left) and 167 km (right).
coincidences with MIPAS were found with miss-time <4 h and miss-distances <400 km (see the summarising Table 1). Figure 4 shows a single profile comparison between the AWI lidar and two MIPAS profiles around midnight on 8 December 2002. The backscatter ratio indicates a PSC layer between 22 and 27 km. High depolarisation gives clear indi-cations of solid type clouds and the event was classified as a PSC type Ia. The collocated MIPAS profiles show a very good correspondence in the cloud top height. The closer profile (right side of the figure) with 167 km miss-distance shows only weak indications of PSC particles at around 27 km. However, these are more strongly developed in the 380 km miss-distance profile on the left side of the figure (CI<3 at ∼27 km). The increasing CIs with decreasing al-titude for the closer MIPAS profile give the impression of a vertically limited extent of the cloud of around three tangent height layers (6–9 km), which is only a rough estimate with large uncertainties (see Sect. 3.1). However, for the presented
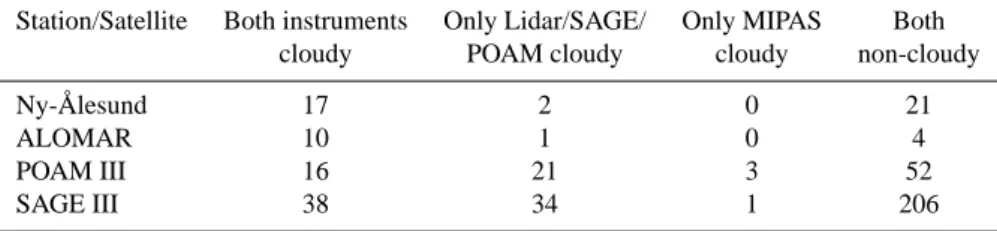
Table 1. Summary of validation comparison for miss-time <4 h, miss-distance <400 km and CI<4 for coincidences in December to January 2002/2003.
Station/Satellite Both instruments Only Lidar/SAGE/ Only MIPAS Both
cloudy POAM cloudy cloudy non-cloudy
Ny- ˚Alesund 17 2 0 21
ALOMAR 10 1 0 4
POAM III 16 21 3 52
SAGE III 38 34 1 206
coincidence the limited extent of the cloud is confirmed by the vertically resolved lidar PSC measurements.
In general, the MIPAS-lidar comparison gives a nearly per-fect match in the detection of cloudy and non-cloudy events (Table 1). Only 3 of 55 coincidences show dissimilar re-sults, hence MIPAS shows sensitivity comparable to that of the lidars for the detection of these PSC events. The good correspondence is probably positively influenced by the relatively large vertical and horizontal extent of the li-dar PSC-events and there is evidence that at these lili-dar lo-cations the whole winter was dominated by synoptic-scale PSC events. Backscatter ratios >1.1 were used to derive lidar CTHs and to compare the results with MIPAS. The MIPAS detection method shows a generally good agreement with the Ny Alsesund lidar (mean CTH difference MIPAS − lidar of
−1.3 km, with a standard deviation σ =1.6 km), but also indi-cations of a systematic negative bias to the ALOMAR lidar (mean difference −2.5 km and σ =0.9 km).
4.2 Satellite-satellite intercomparisons
Only solar occultation satellite measurements are available for comparison with the MIPAS data during Arctic win-ter 2002/2003. The comparisons which are performed here with the Polar Ozone and Aerosol Measurement (POAM) III (Bevilacqua et al., 2002) and the Stratospheric Aerosol and Gas Experiment (SAGE) III (Poole et al., 2003) exper-iments are therefore restricted in latitude and temporal cov-erage within the polar vortex by the requirements for sun-rise/sunset geometry of these instruments.
4.2.1 MIPAS-POAM III coincidences
POAM III is a solar occultation experiment that makes mea-surements mainly at high northern and southern latitudes (Bevilacqua et al., 2002). POAM makes 14–15 profile mea-surements per day in each hemisphere. The northern hemi-sphere measurement latitudes varied from about 64◦in early December 2003 and increased monotonically to a maximum of about 68◦ in early March 2004. The vertical resolution of POAM III (1.5–1.9 km) is better than MIPAS, and is im-proved by a slightly over-sampled vertical spacing of 1 km between two tangent heights, without any altitude bias for
the tangent heights themselves. Due to the orbit geome-tries of the two satellites, only miss-times of close to 4 and close to 8 h are possible. For better count statistics and in agreement with the relatively large measurement volume for each instrument (MIPAS: 3×30×400 km3, POAM III:
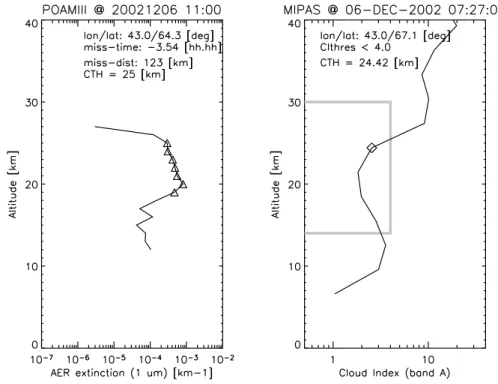
∼1.5×25×250 km3) a maximum miss-time of 4.5 h and a miss-distance of 400 km were chosen. Figure 5 shows a sin-gle profile comparison for a small miss-distance of 123 km and minimal possible miss-time of 312h. PSC detection heights in the POAM profile (left side of figure) are high-lighted by triangles (POAM Version 3 data); the PSC detec-tion method for POAM is described and validated in Fromm et al. (2003). Briefly, any retrieved aerosol extinction value which is greater than 2.7 standard deviations, higher than a appropriate clear air average, and which occurs at tempera-tures lower than a threshold value is assumed to be a PSC.
The broad vertical structure of enhanced extinction of 6– 7 km in the POAM III cloud event in Fig. 5 (left) is very well confirmed in the MIPAS CI profile (right). The simple detec-tion method of MIPAS does not allow an easy determinadetec-tion of the vertical extent of the cloud. However, the recovery in CI to higher values below 21 km is a clear indication of opti-cally thinner conditions at 18 km and levels below. The cloud top heights for both profiles are in very good agreement. This is also the case for most of the 16 “good” matches in Table 1. The mean MIPAS CTH is 0.5 km (σ =1.5 km) higher than for POAM, which compares very well given the wider FOV of MIPAS and its current pointing accuracy.
Although the single profile above shows a very good corre-spondence between MIPAS and POAM III, the overall statis-tic for all potential coincidences in Table 1 results in a sig-nificantly larger number of PSC profiles detected by POAM. Most of these 21 profiles are characterised by thin layers in the POAM data (<3–4 tangent heights layers within 3–4 km vertical extent) of enhanced extinction and/or relatively low extinction enhancement (optically thin clouds), which could be hard to detect by MIPAS. Only five of the 21 coincidences show strong extinction enhancement for POAM and no cloud indications in the MIPAS spectra, which might be due to viewing geometries or spatial inhomogeneities in the PSC locations.
Fig. 5. POAM aerosol extinction profile with PSC altitudes highlighted by triangles (left) versus CI profile of a MIPAS coincidence (right) with miss-time of 3.5 h and miss-distance of 123 km. MIPAS CTH marked by a diamond.
4.2.2 MIPAS-SAGE III coincidences
The SAGE) III instrument has been operating in a sun-synchronous polar orbit onboard the Russian Meteor 3M satellite since late February 2002. SAGE III uses the solar occultation technique to measure 0.5-km vertical resolution profiles of aerosol extinction (with RMS uncertainties) in nine spectral channels ranging in centre wavelength from 384 to 1545 nm. Poole et al. (2003) showed that a two-channel (449 nm and 1022 nm) analysis approach enables discrimi-nation of PSC Types 1a and 1b (a method first applied by Strawa et al., 2003 to POAM data) and illustrated that SAGE III is sensitive to mixtures of background aerosol with very few large NAT particles (i.e. NAT rocks).
The approach used to determine SAGE III PSC top alti-tudes for this paper is similar to Poole et al. (2003), except that data from a third aerosol channel (1545 nm) were also included to enhance the sensitivity to large particles. SAGE III version 2 data were used for all analyses. Specifically, the analysis used the following SAGE III variables: aerosol extinction at 1022 nm (e1022), the colour ratio of extinctions
at 1022 nm and 449 nm (CR1), and the ratio of extinctions at
1545 nm and 1022 nm (CR2); data points with >100%
un-certainty in any of the three variables were excluded. Arctic data for the period November 2002–March 2003 were di-vided into monthly ensembles, which were partitioned into 50 K potential temperature bins over the 400–700 K range. Background aerosol (non-PSC) data points were identified as
those with United Kingdom Meteorological Office tures of more than 5 K above the NAT equilibrium tempera-ture (see Poole et al., 2003 for details). For these background aerosol subsets, median values (medi) of e1022, CR1, and
CR2were calculated, as well as mean absolute deviations (δi)
about the medians. The PSCs were then identified as those outlying points for which any of the three variables minus its RMS uncertainty exceeded medi+3δifor the particular
back-ground aerosol subset. The PSC top altitudes are identified as the maximum altitude at which a data point was identified as a PSC in any SAGE III vertical profile, as with the MI-PAS detection method. In addition, PSC top altitude points were classified as Type 1b if the value of e1022was greater
than the med(e1022) + 3δ(e1022) for the background aerosol
(“outlier”), accompanied by only a modest increase in the values of CR1 and CR2 relative to the background aerosol, as would be expected from an STS cloud; as Type 1a if the point was an outlier primarily in either CR1or CR2; and as
type “mixed” if neither Type 1a or 1b could be determined with confidence. It should be mentioned that the differen-tiation methods described here and by Strawa et al. (2003) are based on the different size distributions of STS and NAT, while that of MIPAS is a real spectroscopic method.
The comparison between MIPAS and SAGE III benefits from a better correspondence in the orbit and observation ge-ometry of both instruments, which results in generally much smaller miss-times (<60 min) and a significantly larger num-ber of coincidences (279) than for the POAM III comparison
(∼4 h/92 coincidences). In total we found 72 coincident MIPAS profiles for 54 SAGE profiles using miss-time and miss-distance criteria of <4 h and <400 km, respectively. There are quite a number of SAGE PSC profiles with two nearby MIPAS profiles (18). These “double-coincidences” frequently show one PSC and one non-PSC event for MIPAS (11), although the PSC events are not necessarily those with the better miss-time and/or miss-distance match. One pos-sibility is that the result of coincidences might be sensitive to the viewing geometry with respect to each other. In to-tal, we found a corresponding MIPAS PSC coincidence for 38 (70%) of the 54 SAGE PSC profiles. The overall statistic show a slightly better agreement than for the POAM III com-parison, which might be a consequence of the latitudes of the coincidences (optical thickness of the PSCs, homogene-ity of PSC fields), the viewing geometries, and the miss-time and miss-distance values for the SAGE-MIPAS coincidences which are slightly better than for POAM-MIPAS. The num-ber of PSC events not detected by MIPAS (34) is now smaller than the number of corresponding cloudy profiles (38).
The SAGE III instrument reports a generally higher CTH than MIPAS. The mean difference in CTH is 3 km, with dif-ferences of up to 5 km for single events. We therefore con-sider detection limits for MIPAS in relation to the extinc-tions measured by SAGE III. A good estimate of the verti-cal optiverti-cal depth (OD) of a PSC observed by SAGE is the integrated extinction profile in the 1022 nm channel from 2 km above the tropopause over all altitudes upwards minus a time-dependent background value of the same quantity of non-cloudy profiles. The analysis shows that for CI<4 MI-PAS will detect PSCs with a 1022-nm vertical OD>0.005 with a probability of 85%, but with only 50% probabil-ity for OD<0.005. The comparison with lidar measure-ments showed that MIPAS detected PSC with OD>0.003 at 1064 nm. In conclusion, the MIPAS detection method is most sensitive to PSCs with a vertical OD greater than 0.005. A similar analysis was performed based on the SAGE limb extinctions at 1022 nm at cloud top height with very similar results. For CI<4, the MIPAS PSC detection method is most sensitive to PSCs with equivalent extinctions >10−3km−1at 1022 nm (>80% probability), it is moderately sensitive be-tween 10−3to 10−4km−1(40% probability) and is not sen-sitive to PSCs with extinctions <10−4km−1. Both estimates should provide helpful information for comparisons with mi-crophysical models where it is usual to estimate the equiva-lent 1022 nm extinction and/or optical depth of the modelled PSCs for comparisons with lidars and satellite measurements (e.g. Santee et al., 2003).
Overall, the general good agreement between MIPAS and the two solar occultation experiments gives us confidence that the MIPAS cloud detection works well and provides a large number of events for statistical analyses over whole winter periods. The detection method is limited by the coarse FOV and it seems that PSC events with very small vertical extent (<FOV) and the combination of vertical and optical
thickness (e.g. low number densities like NAT rocks) might be difficult to detect with MIPAS.
4.3 MIPAS and SAGE III PSC type differentiation Although there are limitations in the PSC type differentia-tion scheme for MIPAS outlined in Sect. 3.2, we performed a first comparison with results from the SAGE III instrument. The SAGE differentiation method is described in the previ-ous section. We found a perfect agreement between all MI-PAS events classified as RE events and SAGE events where the CTH measurement is classified as a PSC Type 1a (7 co-incidences, all in December). However, there are also quite a number of SAGE events classified as Type 1a where no RE could be observed in the coincident MIPAS PSC spec-tra (e.g. 20 events in December) although PSCs were de-tected by both. This disagreement can, on the one hand, be caused by the smearing effect by the broad FOV of MIPAS, which hampers the analysis of layered cloud structures (e.g. a NAT cloud above an STS cloud), and vertically very thin clouds, on the other hand. In addition, Mie-scattering cal-culations have already shown (Spang and Remedios, 2003) that the spectral signature around 820 cm−1disappears in the extinction spectra for large mean radii (r 1µm) and in con-sequence an assignment as RE is not necessarily expected for a PSC dominated by NAT ’rocks’ for example. Nevertheless, the very promising agreement of the MIPAS RE events with SAGE PSC Type 1a events provides some further evidence that the RE signature in MIPAS spectra is related to clouds with radiation properties dominated by NAT particles, as in-ferred by Spang and Remedios (2003) from CRISTA data.
5 PSC occurrence and distribution over the winter
The following section gives a detailed overview of the PSC distribution observed by MIPAS between November 2002 and March 2003 in combination with ECMWF analyses of the meteorological situation. The results shown are the out-put of an automated process in which CI was set to 4. This approach is sufficient to identify major PSC episodes which occurred during the winter of 2002/2003.
5.1 Meteorological condition of the Arctic winter 2002/2003
The winter of 2002/2003 was characterised by a very early phase (mid November) of cold temperatures in the polar vor-tex over a large altitude range in the lower and middle strato-sphere (Fig. 6). A first minor warming occurred in the up-per stratosphere in late December. However, in the lower stratosphere the temperature distribution was scarcely dis-turbed and the vortex was very strong and symmetric during the entire month of December until the first week in January. Afterwards strong wave activity shifted the vortex core over northern and central Europe (15 January) before – caused
−50 0 50 100 Days since 01.01.2003 400 600 800 1000 1200 1400 Theta [K]
ECMWF inner vortex temperatures ECMWF inner vortex temperatures
−50 0 50 100 Days since 01.01.2003 400 600 800 1000 1200 1400 Theta [K] 184 187 190 193 196 199 202 205 208 211 214 217 220 223 226 229 232 235 238 241 244 281 Temp [K] mW1 MW mW2 mW3 FW
Fig. 6. Inner vortex temperature evolution from 1 November 2002 to 30 April 2003 based on ECMWF analyses. Vortex boundary cri-terion by Nash et al. (1997) was used. Dates of the minor, ma-jor warming (mW and MW, respectively) and final warming (FW) events are marked by arrows.
by a major warming – a vortex split happened on 20 Jan-uary. Reunified, the vortex started to cool again, however it never reached the very low temperatures of the Decem-ber period. Following a second minor warming the vortex split again around 20 February. Subsequent reunification of the vortex was followed by a period of only moderately cold temperatures in the last week of February and a third minor warming at the beginning of March (day 65). A final period of cold temperatures occurred before a warming of the en-tire stratosphere took place (>day 90). The vortex degraded slowly but still survived with temperatures generally too high for PSC formation until the final warming occurred in mid April (further details in Naujokat and Grunow, 2003). 5.2 Temporal evolution
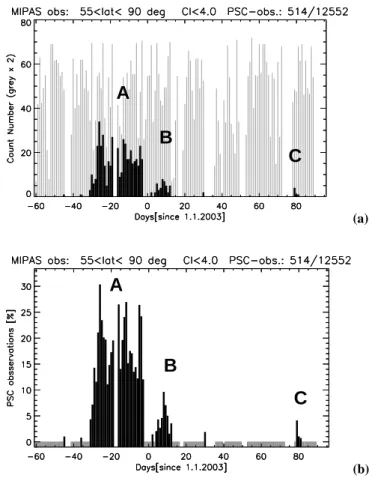
MIPAS detected around 500 profiles with clear indications of PSCs in the November to March period 2002/2003. Al-though the coverage (temporal and spatial) of the MIPAS ob-servations during winter 2002/2003 was not continuous due to data gaps in the NRT Level 1b data from ESA, days with no data or with only limited observations north of 55◦N are quite infrequent (gaps in the grey bars in Fig. 7a and b) and the statistical significance of the count statistics (number of PSC events) is high. The PSC activity shown in Fig. 7a as simple count statistics and in Fig. 7b as occurrence frequen-cies can be separated into three phases.
Phase A: The whole of December was characterised by
high PSC activity. In late November sporadic PSC events with CI<4 already observed (1 event per day) before 1 De-cember showed the first initiation of greater PSC activity fol-lowed by a strong increase in activity, reaching the highest occurrence rates of the whole winter on 6 December (nearly 30% of all MIPAS profiles north of 55◦N on that day). Until 25 December occurrence rates were at a lower but still high
A
B
C
(a)B
C
A
(b) Fig. 7. PSC count statistics and occurrence frequencies: (a) PSC count statistics (black bars) with respect to the total number (grey bars: to be scaled by factor 2) of observations and (b) PSC occur-rence frequency in percentages. All statistics are for north of 55◦N and running from 1 November to 31 March.level of around 15–20%. The apparent day-to-day variabil-ity in the occurrence rate is mainly caused by a variation in the number of MIPAS observations inside the cold pole of the polar vortex. The PSC activity decreased rapidly in the fourth week of December with final PSC observations on 29 December.
Phase B: After a short warming of polar vortex in the first
days of January – during which time no PSCs with CI<3 were observed (30 December–4 January) – weak PSC activ-ity started from 5 January onwards, strengthened gradually and reached a peak between 9 January to 13 January when PSCs were observed by MIPAS in the vicinity of the UK. The occurrence frequencies were significantly lower than in phase A and on 13 January the last strong PSC of this main episode was observed.
Phase C: In February and March, only sporadic PSC
events could be observed, mostly with cloud profiles in the domain of 3<CI<4. On 21 and 22 March a last phase of cloud observations occurred at low altitudes (Tilmes et al., 2003). These observations are consistent with some localised
(a) (b)
(c) (d)
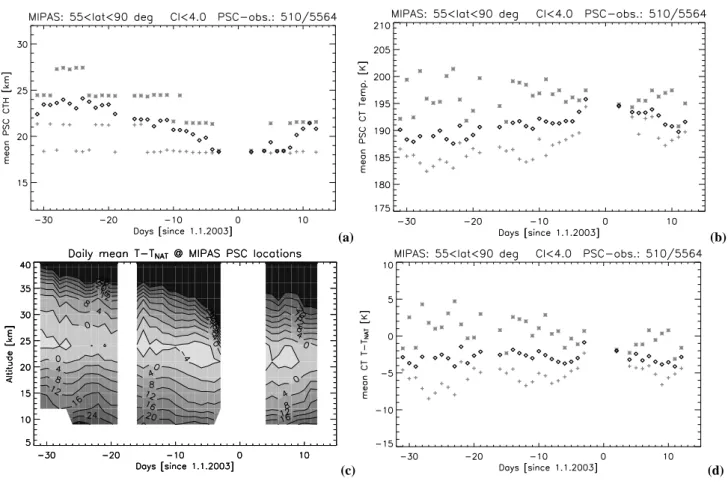
Fig. 8. Temporal evolution on a daily basis during the main PSC activity phase December 2002 to mid January 2003 for cloud top param-eter: (a) mean cloud top height, (b) mean PSC cloud top temperature based on ECMWF temperatures and (d) mean CTT minus TN AT
(minimum/maximum values for each day are superimposed by grey symbols), and (c) the mean ECMWF temperature profiles minus TN AT
(calculated with constant HNO3=10 ppmv and H2O=5 ppmv for the entire height range) at MIPAS profile locations.
small areas of T<TN AT, despite the mean temperature of the
polar vortex already being relatively high due to the num-ber of minor warming events. The POAM data also show a few PSC profiles in March, but no coincidences between the two instruments could be found for these profiles. The PSC observations are all observed around 65◦ latitude and
are unfortunately out of the latitude coverage of the SAGE instrument for this part of the season.
It should be noted that on several days in late November (16 November onwards) MIPAS measured a number of CI profiles in the areas of T<TN AT with no indications of PSCs
although the POAM and SAGE instruments observed a few profiles with very low extinction coefficients (these profiles were not coincident measurements with MIPAS). This is not necessarily an inconsistency. Steele et al. (2002) already showed for air parcel trajectories that the existence of NAT condensation temperatures, or temperatures below this, for periods of a day or more do not necessarily initiate freezing. Further investigations of MIPAS data with more sensitive CI thresholds need to be performed for this time period and are under way.
Figure 8 shows daily mean CTH in relation to the evo-lution of mean ECMWF temperature for the main activity phases A and B (1 December–15 January). In the early pe-riod, a substantial number of PSCs had cloud top heights in the MIPAS observations in the region of 25 km and a few ex-tended to even higher altitudes (6/7 December, Fig. 8a). This is consistent with very low mean inner vortex temperatures (<190 K) up to an isentropic layer around 700 K in Fig. 6.
After the first phase (1–10 December) of nearly constant mean CTHs, the values decreas to 16 km until the end of phase A. Over the same period the ECMWF temperature at the tops of the clouds (CTT) increases by around 5 K. This is caused by two effects: First, the cold temperatures of the vor-tex slowly move down to lower altitudes, which is illustrated by the evolution of the mean T-TN AT at the PSC profile
loca-tion (Fig. 8c). And secondly, at the same time a warming of the entire vortex took place, which resulted in a cut in PSC activity at the end of December. This is consistent with the fact that the mean CTT only reaches the NAT existence tem-perature with the last observations of PSCs at end of phase A (Fig. 8d). It should be noted that the large daily maximum
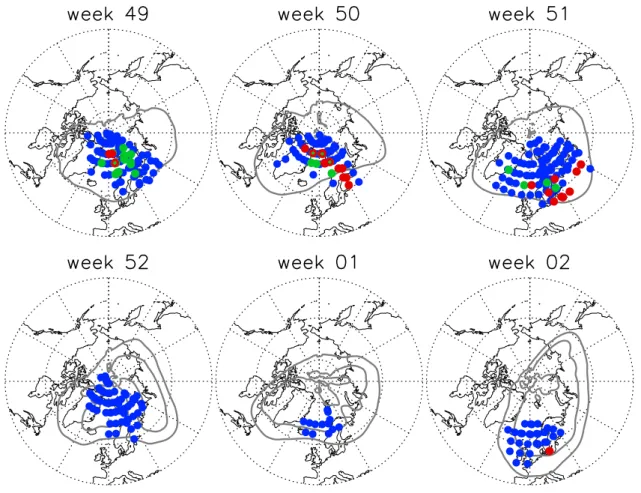
Fig. 9. Temporal evolution of the PSC events with (most likely NAT /red) and without a strong radiance enhancement at 820 cm−1 (presum-ably STS and/or mixed type clouds/in blue) shown for the last four weeks of 2002 (week 49–52) and first two weeks in January 2003 (week 1–2) in the latitude range 40◦to 90◦N. Green dots highlight events with CI<1.5 which refers to events with large optical thickness. The grey contours represent the 60 and 80 PVU contour for midweek conditions at 550 K.
temperature differences with respect to TN AT (grey
aster-isks) might be caused by uncertainties in the corresponding temperature profile (ECMWF profile at noon) and the as-sumption of constant HNO3and H2O values of 10 ppbv and
5 ppmv, respectively, for all altitudes.
To some extent the decreasing CTHs can potentially be caused by denitrification. Irreversible removal of HNO3by
sedimentation of large PSC particles will effectively reduce the TN AT threshold temperatures. Indications of
denitrifi-caton and corresponding reduction in TN AT were found in a
comparison between model runs for winter 2002/2003 by the denitrification model DLAPSE (Carslaw et al., 2002) and the Ny-Alesund lidar. Towards the end of phase A, in the levels above 19.5 km the model predicts a 1 K reduction in TN AT
above Ny-Alesund due to the denitrification in the levels above during the previous weeks (K. Carslaw and G. Mann, University of Leeds, personal communication), which cor-responds to the reduction in the PSC top heights deduced from the lidar data. Denitrification was also observed in the MIPAS HNO3 data and will be analysed in detail in a
an-other paper. However, we cannot observe the corresponding
decrease in NAT existence temperatures and in mean CTT minus TN AT Fig. 3d) within the scatter of the data. At the
beginning of phase B, the CTHs remained at low altitudes (18 km) before they started to increase, but simultaneously the height range for temperatures of NAT existence shrank and in consequence the PSC activity died out.
5.3 Geographical distribution
In the following section we will give a short summary of the geographical PSC distribution over the winter, which is shown in Fig. 3 and Fig. 9. A more detailed picture is given on the homepage of the EU framework 5 project MAP-SCORE (http://www.leos.le.ac.uk/mapscore; link to NRT data), where daily maps of CTH are available throughout the whole of winter 2002/2003. In phase A, the region of PSC activity stretched from the north of Greenland to northern Scandinavia. By 5 December, the region of PSC formation extended to the North Pole and into northern Russia. This early December period, as well as a second period in mid-December, was unusually cold enough for the formation of
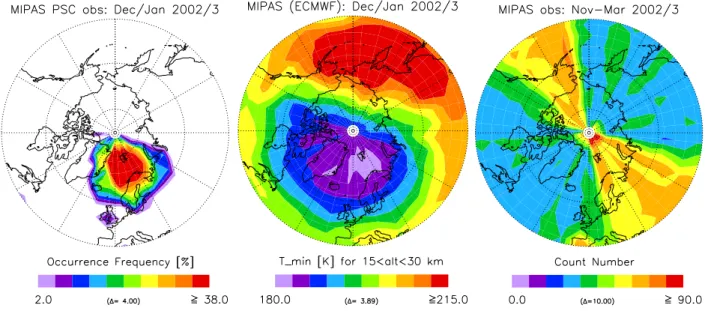
Fig. 10. (a) Occurrence frequency of the MIPAS PSC observations for the time period December–January for 10◦×5◦longitude-latitude grid boxes and (b) the minimum ECMWF temperatures sampled by the MIPAS measurement locations in the 15 to 30 km height range. (c) Total number of observations in the same grid boxes for November 2002 to March 2003.
water ice clouds. However the area of T<TI CE was rather
small (not shown) compared to the large region of T<TN AT
(Fig. 3a).
From 12 December, PSCs were only observed towards the pole and were observed only sporadically above north-ern Scandinavia. However by 16 December PSCs again ap-peared over northern Scandinavia and by 17 December had penetrated to southern Greenland and southern Scandinavia. This episode of lower latitude PSC formation lasted until 23 December when the PSCs were observed northwards again for nearly two weeks. In early January the polar vortex was strongly elongated towards the UK and centred over the North Sea. Although the PSC episode did not appear to be as intensely cold as earlier in December, nonetheless a sub-stantial region of PSCs did form at a significantly southerly location in this period (for example traceable over England and south Ireland, Figs. 3, 9f and 10).
The geographical distribution is summarized in Fig. 10 by the polar projection of the PSC occurrence frequencies com-puted for 10◦×5◦longitude-latitude boxes for the December-January period. The highest occurrence rates were found north of Scandinavia up to the pole. This area is coincident and consistent with the area where the lowest minimum tem-peratures (Tmin)occurred during the December-January pe-riod. The minimum temperatures of Fig. 10b are based on ECMWF analyses sampled with MIPAS profile locations in the height range 15–30 km. All occurrence statistics may be slightly biased by the inhomogeneous measurement net of MIPAS, which is illustrated in Fig. 10c by the total count number per grid box. Obviously not all regions of the cold area are sampled with the same density. In consequence,
the occurrence frequencies, for example, over Newfound-land, Greenland and IceNewfound-land, where low temperatures also occurred, might be underestimated.
5.4 Temporal and geographical evolution of PSC types The temporal and spatial evolution of the RE events or NAT cloud type indicator for MIPAS (Sect. 4.3) is shown in Fig. 9 for the key PSC phases of the winter (phases A and B). In the first three weeks of observations in December 2002, a change in the occurrence of RE events is obvious. In the first week (starting 2 December) only a few events with a significant enhancement could be observed (red symbols). In the second week, the number of observed RE events in-creased, followed by a slight decrease in the activity during the third week, before any indications of RE events disap-peared in the last week of December and first week of Jan-uary. At first sight, it appears that the RE events are linked to the episode of the coldest temperatures in the polar vor-tex (mid-December). However, the mean temperature differ-ence (T-TN AT)for RE and NRE events shows no obvious
indications of this hypothesis, and only an insignificant ten-dency for warmer temperatures for RE events (−2.9 K) than for NRE events (−3.0 K). A separation in T-TN AT between
RE events (NAT clouds) and non-optically thick NRE events (STS clouds) is shown by Spang and Remedios (2003) for the CRISTA Antarctic observations. However, the relatively low number of cloud events for this northern hemisphere winter compared to the CRISTA observations in the SH prevents a proper comparison. Likewise the subset of RE events for this winter is much smaller (<20%) than in the CRISTA analyses
(>60%), which might refer to some fundamental differences between the formation of PSC in the two hemispheres.
A further possibility is that mixed-type cloud might be present in the majority of the northern hemisphere obser-vations, where the temperatures are closer to PSC threshold temperatures and air parcel trajectories cross these thresholds more frequently than in the southern hemisphere. Indication for this effect can be found in the lidar data, where many layered structures of the PSC types were found (“sandwich structures”). Mixed type clouds in the FOV of the instrument make any separation and classification of cloud type events more difficult and will produce enhanced scatter in any sta-tistical analysis.
Figure 9 additionalls shows events with a significantly high optical depth (CI<1.5, optically thick cloud: CI close to one, e.g. Spang and Remedios, 2003). No extreme events with CI<1.2 were detected and only a few events with very high optical depth could be found (1.2<CI<1.5). The latter were detected only in the first three weeks of PSC sightings (Phase A). This is in agreement with the vortex evolution, with temperatures mostly well above the ice saturation tem-perature TI CE and the fact that an optical thickness close
to one can only be produced by ice or in specific cases by STS clouds (M. H¨opfner, IMK, Research Centre Karlsruhe, personal communication). Events with 1.2<CI<1.5 can be related to clouds with large particles (r>1 µm) and in con-sequence to enhanced radiation by scattering processes (e.g. ice or NAT), and/or clouds with a large volume density of the particles (e.g. a very dense STS cloud). The lack of observa-tions of low CI events throughout January and the rest of the winter is in agreement with the higher vortex temperatures with respect to TN AT for this part of the winter.
6 Conclusions
The cloud detection method developed for CRISTA has been successfully implemented for MIPAS. The method provides a fast and simple technique for retrieving spatial location and altitude information (cloud top height) of polar stratospheric clouds. The PSC detection scheme with a threshold value of CI<4, was validated, based on comparisons with lidar and satellite data. The agreement in the detection of PSC events between MIPAS and the lidars is excellent, which gives con-fidence that the method can be applied to multi-year analy-ses. The PSC CTHs and locations inferred from MIPAS are also in good agreement with POAM III extinction analyses. However, the occultation measurements, especially SAGE III, potentially show a higher sensitivity for the detection of optically thinner clouds than the equivalent 10−3km−1limit
(1022 nm) for CI<4 and, in consequence, display apparently higher CTHs.
For the first time, coverage of PSC evolution could be ex-amined throughout the Arctic polar vortex up to the pole on many days during the winter period. Winter 2002/2003 was
analysed in detail and can be characterised in three phases: (1) A very intense and unusual early cold phase in the first three weeks of December with high PSC activity and partly optically thick cloud events. This phase is also characterised by a reduction in the mean CTH consistent with a descent of the height of the vertical temperature minimum in the polar vortex. (2) After a slight warming of the polar vortex temper-atures were again cold enough between 5 to 13 January for a phase of more moderate PSC activity. Nonetheless, PSCs were spread extremely far towards mid latitudes, down to the U.K. and the south coast of Ireland. (3) A few PSC pro-files were observed in mid February (3>CI>4) and around 20 March when the vortex – already warmer after two ma-jor warming events and vortex splits – was reunified again. The observations are consistent with the last small areas of T<TN AT deduced from ECMWF analyses.
A number of MIPAS PSC spectra show the same distinc-tive spectral feature around 820 cm−1 as found previously for CRISTA data in the Antarctic. The spatial distribution of these RE events was examined through winter 2002/2003 as they are expected to indicate NAT particles, albeit with mean particle sizes less than 2–3 µm radius. The subset of spectra is considerably smaller than for CRISTA and so far no sig-nificant temperature separation between NRE and RE events could be found. The main occurrence of the NAT particles is seen to take place in December and not in January when a second phase of PSC formation was observed. Further stud-ies with microphysical and denitrification models would be interesting to examine the apparent differences in NAT for-mation in phases of winter 2002/2003 and the differences be-tween Arctic and Antarctic winters.
Acknowledgements. The work presented in this paper was supported by the EU framework 5 project MAPSCORE, EVK2-CT-2000-00072. We would like to thank ESA for the early delivery of preliminary MIPAS Level 1b and Level 2 data as part of AO357 proposal CUTLSOM. The authors acknowlege the helpful comments by the two reviewers.
Edited by: K. Carslaw
References
Bevilacqua, R. M., Fromm, M. D., Alfred, J. M., et al.: Obser-vations and analysis of polar stratospheric clouds detected by POAM III during the 1999/2000 Northern Hemisphere winter, J. Geophys. Res., 107(D20), 8281, doi:10.1029/2001JD000477, 2002.
Browell, E. V., Butler, C. F., Ismail, S., Robinette, P. A., Carter, A. F., Higdon, N. S., Toon, O. B., Schoeberl, M. R., and Tuck, A. F.: Airborne lidar observations in the wintertime Arctic strato-sphere: polar stratospheric clouds, Geophys. Res. Lett., 17, 385– 388, 1990.
Carli, B., Alpaslan, D., Carlotti, M., et al.: First results of MI-PAS/ENVISAT with operational Level 2 code, Adv. Space Res., 33, 1012–1019, 2004.
Carslaw, K. S., Kettleborough, J., Northway, M. J., Davies, S., Gao, R.-S., Fahey, D. W., Baumgardner, D. G., Chipperfield, M. P., and Kleinb¨ohl, A.: A Vortex-Scale simulation of the growth and sedimentation of large nitric acid hydrate particles, J. Geophys. Res., 107, 8300, doi:10.1029/2001JD000467, 2002.
Fahey, D. W., Gao, R. S., Carslaw, K. S., et al.: The detection of large HNO3-containing particles in the winter Arctic strato-sphere, Science, 291, 1026–1031, 2001.
Fischer, H. and Oelhaf, H.: Remote sensing of vertical profiles of atmospheric trace constituents with MIPAS limb emission spec-trometers, Appl. Opt., 35(16), 2787–2796, 1996.
Fromm, M., Alfred, J., and Pitts, M.: A unified, long-term, high-latitude stratospheric aerosol and cloud database using SAM II, SAGE II, and POAM II/III data: Algorithm description, database definition, and climatology, J. Geophys. Res., 108(D12), 4366, doi:10.1029/2002JD002772, 2003.
H¨opfner, M., Oelfhaf, H., Wetzel, G., et al.: Evidence of scattering of tropospheric radiation by PSCs in mid-IR emission spectra: MIPAS-B observations and KOPRA simulations, Geophys. Res. Lett., 29(8), doi:10.1029/2001GL014443, 2002.
H¨opfner, M.: Study on the impact of polar stratospheric clouds on high resolution mid-IR limb emission spectra, J. Quant. Spec. Rad. Trans., 83, 93–107, 2004.
Nash, E. R., Newman, P. A., Rosenfield, J. E., and Schoeberl, M. R.: An objective determination of the polar vortex using Ertel’s potential vorticity, J. Geophys. Res., 101, 9471–9478, 1997. Naujokat, B. and Grunow, K.: The stratospheric arctic winter
2002/03: Balloon flight planning by trajectory calculations. Pro-ceedings of the 16th ESA Symposium on European Rocket and Balloon Programmes and Related Research, St. Gallen 2003 (ESA SP-530), 421–425, 2003.
Mann, G. W., Davies, S., Carslaw, K. S., and Chipperfield, M. P.: Factors controlling Arctic denitrification in cold winters of the 1990s, Atmos. Chem. Phys., 3, 403–416, 2003,
SRef-ID: 1680-7324/acp/2003-3-403.
Massie, S. T., Baumgardner, D., and Dye, J. E.: Estimation of po-lar stratospheric cloud volume and area densities from UARS, SAGE II, and POAM II extinction data, J. Geophys. Res., 103, 5773–5783, 1998.
McCormick, M. P., Steel, H. M., Hamill, P., Chu, W. P., and Swissler, T. J.: Polar stratospheric cloud sightings by SAM II, J. Atmos. Terr. Phys., 39, 1387–1397, 1982.
Peter, Th.: Microphysics and heterogeneous chemistry of polar stratospheric clouds, Annu. Rev. Phys. Chem., 48, 785–822, 1997.
Poole, L. R., Trepte, C. R., Harvey, V. L., Toon, G. C., and van Valkenburg, R. L.: SAGE III observations of Arctic polar strato-spheric clouds – December 2002, Geophys. Res. Lett., 30(23), 2216, doi:10.1029/2003GL018496, 2003.
Riese, M., Spang, R., Preusse, P., Ern, M., Jarisch, M., Offermann, D., and Grossmann, K. U.: Cryogenic Infrared Spectrometers and Telescopes for the Atmosphere (CRISTA) data processing and atmospheric temperature and trace gas retrieval, J. Geophys. Res., 104, 16 349–16 367, 1999.
Remedios J. J. and Spang, R.: Detection of cloud effects in MI-PAS spectral data and implications for the MIMI-PAS operational processor, Proceedings of the ENVISAT Calibration Review, 9– 13 September 2002, ESA-ESTEC, Noordwijk, The Netherlands, 2002.
Remedios, J. J. and Spang, R.: MIPAS observations of clouds and their effects on Level 2 trace gas products, Proceedings of the ENVISAT Validation Workshop, 9–13 December 2002, ESA-ESRIN, Frascati, Italy, 2003.
Santee, M. L., Tabazadeh, A., Manney, G. L., Fromm, M. D., Bevilacqua, R. M., Waters, J. W., and Jensen, E. J.: A Lagrangian approach to studying Arctic polar stratospheric clouds using UARS MLS HNO3 and POAM II aerosol ex-tinction measurements, J. Geophys. Res., 107(D10), 4098, doi:10.1029/2000JD000227, 2002.
Spang, R. and Remedios, J. J.: Observations of a distinctive infra-red spectral feature in the atmospheric spectra of polar strato-spheric clouds measured by the CRISTA instrument, Geophys. Res. Lett., 30(16), 1875, doi:10.1029/2003GL017231, 2003. Spang, R., Riese, M., and Offermann, D.: CRISTA-2 observations
of the south polar vortex in winter 1997: A new dataset for polar process studies, Geophys. Res. Lett., 28, 3159–3162, 2001. Spang, R., Eidmann, G., Riese, M., Offermann, D., Preusse, P.,
Pfister, L., and Wang, P. H.: CRISTA observations of cirrus clouds around the tropopause, J. Geophys. Res., 107(D23), 8174, doi:10.1029/2001JD000698, 2002.
Spang, R., Remedios, J. J., and Barkley, M. P.: Colour indices for the detection and differentiation of cloud types in infra-red limb emission spectra, Adv. Space Res., 33, 1041–1047, 2004. Steele, H. M., Lumpe, J. D., Turco, R. P., Bevilacqua, R. M.,
and Massie, S. T.: Role of temperature history in polar strato-spheric clouds sightings, J. Geophys. Res., 107(D22), 4618, doi:10.1029/2001JD001261, 2002.
Strawa, A. W., Drdla, K., Fromm, M., Pueschel, R. F., Hop-pel, K. W., Browell, E. V., Hamill, P., and Dempsey, D. P.: Discriminating Types Ia and Ib polar stratospheric clouds in POAM satellite data, J. Geophys. Res., 107(D20), 8291, doi:10.1029/2001JD000458, 2002.
Tabazadeh, A., Jensen, E. J., Toon, O. B., Drdla, K., and Schoeberl, M. R.: Role of the stratospheric freezing belt in denitrification, Science, 291, 2591–2594, 2001.
Taylor, F. W., Lambert, A., Grainger, R. G., Rodgers, C. D., and Remedios, J. J.: Properties of northern hemisphere po-lar stratospheric clouds and volcanic aerosol in 1991/92 from UARS/ISAMS satellite measurements, J. Atmos. Sci., 51, 20, 3019–3026, 1994.
Tilmes, S., M¨uller, R., Grooß, J.-U., H¨opfner, M., Toon, G. C., and Russell III, J. M.: Very early chlorine activation and ozone loss in the Arctic winter 2002–2003, Geophys. Res. Lett., 30(23), 2201, doi:10.1029/2003GL018079, 2003.
Voigt, Ch., Schreiner, J., Kohlmann, A., et al.: Nitric acid trihydrate (NAT) in polar stratospheric clouds, Science, 290, 1756–1758, 2000.
von Clarmann, T., Glatthor, N., Grabowski, U., et al.: Retrieval of temperature and tangent altitude pointing from limb emission spectra recorded from space by the Michelson Interferometer for Passive Atmospheric Sounding (MIPAS), J. Geophys. Res., 108(D23), 4736, doi:10.1029/2003JD003602, 2003.
von Zahn, U., von Cossart, G., Fiedler, J., Fricke, K. H., Nelke, G., Baumgarten, G., Rees, D., Hauchecorne, A., and Adolfsen, K.: The ALOMAR Rayleigh/Mie/Raman lidar: objectives, configu-ration, and performance, Ann. Geophys., 18, 815–833, 2000, SRef-ID: 1432-0576/ag/2000-18-815.