HAL Id: hal-00295911
https://hal.archives-ouvertes.fr/hal-00295911
Submitted on 4 May 2006
HAL is a multi-disciplinary open access
archive for the deposit and dissemination of
sci-entific research documents, whether they are
pub-lished or not. The documents may come from
teaching and research institutions in France or
abroad, or from public or private research centers.
L’archive ouverte pluridisciplinaire HAL, est
destinée au dépôt et à la diffusion de documents
scientifiques de niveau recherche, publiés ou non,
émanant des établissements d’enseignement et de
recherche français ou étrangers, des laboratoires
publics ou privés.
Screening the ESA ATSR-2 World Fire Atlas
(1997?2002)
B. W. Mota, J. M. C. Pereira, D. Oom, M. J. P. Vasconcelos, M. Schultz
To cite this version:
B. W. Mota, J. M. C. Pereira, D. Oom, M. J. P. Vasconcelos, M. Schultz. Screening the ESA ATSR-2
World Fire Atlas (1997?2002). Atmospheric Chemistry and Physics, European Geosciences Union,
2006, 6 (5), pp.1409-1424. �hal-00295911�
www.atmos-chem-phys.net/6/1409/2006/ © Author(s) 2006. This work is licensed under a Creative Commons License.
Chemistry
and Physics
Screening the ESA ATSR-2 World Fire Atlas (1997–2002)
B. W. Mota1, J. M. C. Pereira1, D. Oom2, M. J. P. Vasconcelos2, and M. Schultz3
1Department of Forestry, Instituto Superior de Agronomia, Tapada da Ajuda 1349-017 Lisboa, Portugal 2Remote Sensing Centre, Tropical Research Institute, Tv. Conde da Ribeira 9, 1300-142 Lisboa, Portugal 3Max Planck Institute for Meteorology, Bundesstr. 53, 20146 Hamburg, Germany
Received: 22 March 2005 – Published in Atmos. Chem. Phys. Discuss.: 12 July 2005 Revised: 16 January 2006 – Accepted: 1 February 2006 – Published: 4 May 2006
Abstract. We screened the algorithm 2 (308 K threshold)
European Space Agency (ESA) World Fire Atlas (WFA), for the period 1997–2002, using ancillary land cover, night-lights and volcanic activity datasets, combined with statisti-cal techniques to detect the occurrence of space-time clus-ters of anomalous observations. The WFA is built using night time data from the Along Track Scanning Radiome-ter (ATSR) onboard the Second European Remote-Sensing Satellite (ERS-2). The spatial resolution of the data is 1 km and the satellite revisiting period is 3 days at the equator. The WFA is the first and longest archive of global fire observa-tions and has been used in numerous biomass burning stud-ies. Known limitations of the WFA are the inclusion of warm surfaces, gas flares, and city lights, and an underestimation of actual global fire activity, due to the time of satellite overpass. Nevertheless, it has been considered that the WFA contains a relatively small proportion of observations that do not cor-respond to vegetation fires, which is not corroborated by our findings. During the study period, the annual percentage of false alarms and non-vegetation fires varied from a minimum value of 20.6% in 1997 to a maximum of 27.9% in 1998. Gas flares and hot bare soils are the major sources of false alarms and non-vegetation fires.
1 Introduction
Vegetation fires play an important environmental role over large areas of the Earth surface, influencing ecosystem pro-ductivity (Houghton, 2003; Potter et al., 2003), vegetation distributions patterns (Bachelet et al., 2001), and climate (Oglesby et al., 1999; Menon et al., 2002). Fires also rep-resent a significant source of aerosols and trace gas
emis-Correspondence to: J. Pereira
sions (Bey et al., 2001; Kinne et al., 2003; Langenfelds et al., 2002). Recent analyses based on data from the Global Burned Area 2000 (GBA2000) project (Gr´egoire et al., 2003) estimate that 3.5 million km2burned globally during the year 2000 (Tansey et al., 2003), corresponding to 2580 teragrams (Tg, dry matter) of burnt biomass (Ito and Penner, 2003).
Multi-annual, very broad geographical scale analyses of fire occurrence are scarce, and rely primarily on active fires data. Dwyer et al. (2000) and Stroppiana et al. (2000) anal-ysed 21 months of global, daily daytime imagery from the Advanced Very High Resolution Radiometer (AVHRR) at 1 km spatial resolution, from April 1992 to December 1993. Arino and Rosaz (1999) and Arino and Plummer (2001) described the European Space Agency (ESA) World Fire Atlas (WFA), which is being produced using global daily night time data from the Along Track Scanning Radiometer (ATSR-2) at 1 km spatial resolution. Giglio et al. (2003) used data from the Tropical Rainfall Measuring Mission (TRMM) Visible and Infrared Scanner (VIRS), to map pan-tropical (40◦N to 40◦S) fire activity between January 1998 and Au-gust 2004. Other studies have analysed fire activity over smaller areas and shorter time periods, for example in sup-port of field research campaigns (Olson et al., 1999; Pereira et al., 1999; Anyamba et al., 2003) or to document excep-tional fire events (Malingreau et al., 1985; Gutman et al., 2000; Wooster and Strub, 2002).
Active fires detected by satellite provide a good indication of the spatio-temporal patterns of global fire incidence, but are inadequate to estimate biomass burning, due to areal and temporal sampling problems (Pereira et al., 1999a; Dwyer et al., 2000). Nevertheless, active fire data sets have been found useful by atmospheric chemistry researchers, to im-prove characterisation of the interannual variability and sea-sonality of emissions, and to assess the effects of biomass burning on the distribution dynamics of aerosols and trace gases. The ESA WFA has been extensively used for these
1410 B. W. Mota et al.: Screening the World Fire Atlas 41
Volcanoes Oil / gas Flares
Vegetation fires
Non-veg fires Acq / proc errors
Hot surfaces
Fires False alarms
Observations
Figure 1
Fig. 1. Hierarchical arrangement of the WFA data classes used in the study.
purposes, in spite of the limitations described by Arino and Plummer (2001). Table 1 lists articles that used ESA’s WFA data, mentioning the study area, the analysis time frame, and the main topic of the research.
A careful and thorough visual analysis of the WFA prod-uct in various regions of the world, namely in deserts and sparsely vegetated areas, suggested that the product con-tained a relatively large number of observations that did not correspond to vegetation fires. The purpose of the present work was to remove those observations from the WFA and provide the global change research community with an im-proved multi-annual, global fire activity dataset. Some of authors listed in Table 1 attempted screening of the WFA to remove non-vegetation fire data (for example, Generoso et al., 2003; Hoelzemann et al., 2003; Pereira, 2003; Pereira et al., 2004; Schultz, 2002), but less thoroughly than in the present study, and for shorter periods of time.
Throughout the paper we use the following terminology (Fig. 1): observation or count is the more generic designation and refers to each and every WFA element. False alarm des-ignates observations that do not correspond to fires. They can be data acquisition/processing errors or hot ground surfaces. Fires are observations that display a high temperature result-ing from energy generated by a combustion process. They in-clude vegetation fires, gas flares and volcanic eruptions. The latter two are jointly designated non-vegetation fires. Our goal is to classify and remove from the WFA dataset all ob-servations other than vegetation fires.
2 Data and methods
2.1 The World Fire Atlas
The ATSR-2 is a low spatial resolution sensor for environ-mental monitoring, carried onboard the Second European Remote Sensing Satellite (ERS-2). It has four visible and mid-infrared channels centred at 0.55 µm, 0.67 µm, 0.87 µm and 1.6 µm, and three thermal-infrared channels centred at
3.7 µm, 11.0 µm and 12.0 µm. The spatial resolution of the ATSR-2 is 1 km at nadir. A swath width of 512 km al-lows a revisiting period of 3 days at the equator. (Arino and Plummer, 2001). Additional information about the ATSR can be found at http://www.atsr.rl.ac.uk/documentation/docs/ userguide/index.shtml.
The WFA (http://dup.esrin.esa.int/ionia/wfa/index.asp) is built using data acquired at night by the ATSR-2 nadir view camera. WFA data are available from November 1995 to July 2005, with a gap between January and June 1996. We restricted our analysis to the six full years of ATSR-2 data, from January 1997 to December 2002. After this pe-riod WFA data are obtained with the Advanced Along-Track Scanning Radiometer (AATSR), onboard the Environment Satellite (ENVISAT). We do not analyse AATSR data in this study.
Interannual variability of vegetation fires at the global scale is large (Duncan et al., 2003a), and is strongly influenced by climatic conditions (Holmgren et al., 2001; Hashimoto et al., 2004). Our six-year anal-ysis encompasses a strong warm phase of the El Ni˜no Southern Oscillation (ENSO) during 1997–1998, a cold phase from late 1998 through 2001, and an-other warm phase during the second half of 2002, ac-cording to the National Oceanic and Atmospheric Ad-ministration (NOAA) National Weather Service/Climate Prediction Center (http://www.cpc.ncep.noaa.gov/products/ analysis monitoring/ensostuff/ensoyears.shtml). Thus, it ought to adequately characterise fire interannual variability, at least to the extent that it is affected by this global scale climatic phenomenon.
The detection of observations for the WFA is based only on the 3.7 µm channel, which is highly sensitive to radiation emitted at temperatures from 500 K to 1000 K. Use of night-time data is meant to minimise false alarms due to sun-glint, reflection off cloud edges, and bright soil surfaces. It is also expected to reduce false alarms caused by hot ground sur-faces. The detection capability of the 3.7 µm channel ranges
Table 1. Articles that used World Fire Atlas data.
Article Study area Time frame Topic
Balis et al. (2003) Northern Greece Summer 2001 Aerosols
Beirle et al. (2004) Central Australia 1999–2001 NOx
Brooks and Legrand (2000) Northern hemisphere Africa 1984–1993 Aerosols Bruzzone et al. (2003) Africa, Australia, Mexico, and Brazil 1996–1999 NO2
Chandra et al. (2002) Africa, Brazil, and Indonesia 1979–2000 O3
Chin et al. (2002) Global 1990, 1996, 1997 Aerosols
Clerbaux et al. (2001) Global June 1997 CO
Davison et al. (2004) Indonesia Aug–Nov 1997 Aerosols
Duncan et al. (2003a) Global 1979–2000 CO
Duncan et al. (2003b) SE Asia Sep–Nov 1997 CO, O3
Edwards et al. (2003) Africa, Atlantic Ocean Jan 2001 O3
Formenti et al. (2002) South Africa 1998–1999 Aerosols
Generoso et al. (2003) Global 1997–2001 Aerosols
Goloub and Arino (2000) Africa, America, Asia 1996–1997 Aerosols
Gumbricht et al. (2002) Botswana 1999–2000 Peat fire detection
Hoelzemann et al. (2004) Global 2000 40+ chemical species, and aerosols
Jenkins et al. (1997) Africa, Atlantic and Indian Oceans Not provided O3
Jenkins and Ryu (2003) Atlantic ocean, W. Africa, S. America 1979–2000 O3 Jenkins and Ryu (2004) Tropical Atlantic, Africa, S. America 1998–2001 O3 Kasischke et al. (2003) Alaska, Canada, Russia 1997–2002 Fire counts
Kelha et al. (2003) Scandinavia, W. Russia 1999–2000 Fire counts
Kim et al. (2001) Pantropical 1998–1999 O3
Ladst¨atter-Weißenmayer et al. (2004) Tropical Pacific ocean Sep 1999 O3
Langmann and Heil (2004) Indonesia 1997–1998 Aerosols
Legg and Laumonier (1999) Indonesia Aug–Sep 1997 Burned area
Martin et al. (2002a) Global July 1996 NO2
Martin et al. (2002b) Global 1996–1997 O3
Newchurch et al. (2001) Global 1978–1999 O3
Pereira (2003) Tropical savannas – Burned area
Pereira et al. (2004) Southern Africa – Burned area
Pinty et al. (2000) Africa 1996 Albedo change
Pochanart et al. (2003) Thailand 1997–2000 CO
Richter and Burrows (2002) Africa 1997 NO2
R¨odenbeck et al. (2003) Global 1982–2000 CO2
Sauvage et al. (2004) Equatorial Africa 1997–2003 O3
Schultz (2002) Global 1996–2000 CO
Silva et al. (2003) Southern Africa 2000 Burned area
Spichtinger et al. (2004) Panboreal 1997–1998 CO
Staudt et al. (2001) Pacific Ocean March–April 1999 CO
Sudo et al. (2002) Global 1988–1999 Multiple chemical species
van der Werf et al. (2003) Global 1998–2001 C
van der Werf et al. (2004) Global 1997–2001 CO2, CO, CH4
Wooster and Strub (2002) Indonesia 1997 Burned area
Yurganov et al. (2004) Northern Hemisphere 1996–2001 CO
Zhao et al. (2000) Northern Japan 1995–1997 HCN
Zhao et al. (2002) Northern Japan 1995–2000 CO, C2H6, C2H2, HCN
from a burning area of 0.1 ha at 600 K to 0.01 ha at 800 K (http://dup.esrin.esa.int/ionia/wfa/algorithm.asp). Wooster and Rothery (2002) calculated a sensor saturation envelope for observations of sub-pixel sized hotspots at 3.7 µm, as a function of hotspot temperature (◦C) and hotspot size (m2).
Two versions of the WFA are provided by ESA. The first includes all pixels with brightness temperature at 3.7 µm
larger than 312 K (saturation temperature), and the second sets the threshold at 308 K. In this study we used only the dataset created with the 308◦K threshold, designated algo-rithm 2. Underestimation of fire activity, considered the main limitation of the product (Kasischke et al., 2003), is ex-pected to be less severe with this threshold. The trade off is a higher number of false alarms (Arino and Plummer, 2001).
1412 B. W. Mota et al.: Screening the World Fire Atlas
Table 2. Annual results of WFA screening.
Year Original Screened %Screened Vegetation %Vegetation
Fires Fires 1997 164 221 33 878 20.63 130 343 79.37 1998 238 137 66 397 27.88 171 740 72.12 1999 155 718 39 461 25.34 16 257 74.66 2000 150 416 39 790 26.45 110 626 73.55 2001 141 215 35 460 25.11 105 755 74.89 2002 176 909 38 868 21.97 138 041 78.03 Mean 171 103 42 309 24.56 128 794 75.44
Single-channel (with the AVHRR channel 3, at 3.75 µm) al-gorithms for active fire detection were used before, namely by Muirhead and Cracknell (1985), Malingreau and Tucker (1988), Setzer and Pereira (1991), and Pereira and Setzer (1993). Mart´ın et al. (1999) and Li et al. (2001) reviewed limitations of this approach and discussed alternative algo-rithms.
Between January 1997 and December 2002 there are some periods with missing (not a single 512 km by 512 km data frame available) or incomplete data (a variable number of 512 km by 512 km data frames not available). The year 2000 has 14 days with missing data. In 2001 there are 16 days of incomplete data and 25 days with missing data. In 2002 there are 15 days of incomplete data and 12 days with ing data. Above 60 degrees latitude north, data are miss-ing from February to August 1997, due to processmiss-ing prob-lems. The various modes of operation of ERS-2 in 2001 af-fected significantly the geo-location accuracy of the ATSR data, mainly due to yaw mispointing in the satellite gyro-less mode (http://dup.esrin.esa.int/ionia/wfa/2001-ESA02-index. asp). The average magnitude of the location accuracy errors varied from 10 km between February and May 2001, down to 2–3 km from June 2001 onwards. Arino and Plummer (2001) discussed WFA limitations, identified during an extensive in-ternational product assessment. The main limitation of the WFA, for both temperature thresholds in channel 3, is under-estimation of actual fire activity. This problem is less severe for algorithm 2. Omission errors are attributed mainly to the timing of image acquisition, the instrument revisit time, the spatial resolution of the ATSR, and the thermal thresholds selected. Fire activity tends to peak during the afternoon, both for wildfires and for prescribed burns. Thus, the night time ATSR overpass samples a moment of reduced activity in the diurnal fire cycle. The revisit time of the ATSR at the equator is three days, meaning that many short duration fires are not observed. Biome specific differences in fire persis-tence are likely to introduce a bias in favour of the detection of forest fires, to the detriment of shorter duration savanna fires (Giglio et al., 2006). The spatial resolution of 1 km also limits the ability of the ATSR to detect many small fires, to
an extent that is dependent on fire intensity. This limitation is shared by other sensors, such as the AVHRR and MODer-ate resolution Imaging Spectrometer (MODIS), and is more severe in coarser resolution instruments, such as the Geo-stationary Operational Environmental Satellite (GOES). The thermal thresholds of algorithms 1 and 2 were designed to achieve an acceptable trade off between omission and com-mission errors. They may be too restrictive to capture active fires that affect only a small fraction of the area of a pixel. Underestimation of fire activity at high latitudes during the boreal summer was first described by Arino and Plummer (2001) and confirmed by Kasischke et al. (2003). Arino and Plummer (2001) considered commission errors to be less of a problem in the WFA than omission errors. They were attributed primarily to urban lights and oil and gas flares. Commission errors due to hot ground surfaces in deserts and sparsely vegetated areas were mentioned only for the algo-rithm 2 product. Overall, Arino and Plummer (2001) consid-ered the main advantages of the WFA to be the low level of commission errors, and the adequate spatial distribution and location accuracy of the hotspots.
2.2 Screening procedure
The screening, or filtering, of false alarms and non-vegetation fires from among the set of observations included in the WFA was implemented in two stages. In the first stage, a series of spatial masks were used to classify false alarms and non-vegetation fires generated by specific types of land cover, gas flares, and volcanic activity. In the second stage, the WFA data were visually analysed, to classify erroneous observations not detected in the first stage. This two-stage classification of WFA observations is exhaustive, i.e. it ad-dresses each and every count in WFA, but it is not mutu-ally exclusive, i.e., a given observation may be captured by more than one filter. This may not be the ideal classifica-tion structure, but it was impossible to construct a priori a strict partition of the data. With the procedure followed, the number of observations allocated to each filter is independent from the order in which the filters were actually applied to the data. The screening procedure required the use of ancillary
datasets, namely a land cover map, a stable lights map, and volcanic activity location data.
2.3 Screening based on land cover
Two global land cover products are contemporary with the WFA data, and thus are potentially appropriate for screening non-vegetation fire counts. These products are the Global Land Cover (GLC) 2000 map (Fritz et al., 2003), and the MODIS MOD12 Land Cover map (Strahler et al., 1999; Friedl et al., 2002). The accuracy of the MODIS land cover map is 71.6±0.25%. Accuracy assessment for the GLC 2000 map is still in progress, but preliminary results indicate an ac-curacy level comparable to that of the MODIS product. Giri et al. (2005) provide a detailed comparison of these two land cover maps. The GLC2000 map (www-gvm.jrc.it/glc2000) is based on SPOT-VEGETATION satellite imagery acquired during the year 2000, at a spatial resolution of 1km. The map distinguishes 22 land cover classes. The MOD12 Land Cover map also has a spatial resolution of 1 km, and is based on 12 months of data acquired between 15 October 2000 and 15 October 2001. It uses the International Geosphere-Biosphere Programme (IGBP) 17-class global vegetation classification scheme. The legend of the GLC 2000 map was considered more adequate for the purposes of the present study. It sepa-rates bare (incombustible) land from sparsely vegetated (po-tentially combustible) land, while the MOD12 IGBP legend has a “barren and sparsely vegetated class”, which is am-biguous from the standpoint of potential combustibility. The GLC 2000 land cover classes bare areas (24 629 888 km2), natural and artificial water bodies (471 061 857 km2), snow and ice (10 660 085 km2), and artificial surfaces and asso-ciated areas (3 217 319 km2) were considered incapable of supporting vegetation fires. Therefore, all WFA observa-tions falling on these land cover classes were classified as false alarms or non-vegetation fires. Visual inspection of the data also revealed the presence of numerous counts in peri-urban industrial areas, primarily in Europe, North America, and Asia. Screening of these observations, not eliminated by the GLC 2000 artificial surfaces and associated areas, was accomplished with a spatial mask including all areas that were lighted in over 25% of the cloud-free observations in the Elvidge et al. (2001) human settlements layer.
2.4 Screening non-vegetation fires
The screening of observations corresponding to gas flares re-lied on data from the Defense Meteorological Satellite Pro-gram (DMSP) Operational Linescan System (OLS) Night time Lights of the World data product http://www.ngdc.noaa. gov/dmsp/download world change pair.html. This product includes a gas flares layer for the year 2000, which contains mean OLS visible band digital numbers, from cloud-free ob-servations. Gas flares are a subset of stable lights, defined as those lights visible in at least 10% of cloud-free
obser-vations. Gas flares are identified in the stable lights dataset based on their large circular appearance and lack of coin-cidence with populated places (Elvidge et al., 2001). The gas flares mask covers an area of 887 007 km2. The WFA also contains counts generated by volcanoes. Elimination of these observations was based on volcanic activity timing and location data from the Global Volcanism Program (GVP) of the Smithsonian Institution http://www.volcano.si.edu/, from Volcano World http://volcano.und.edu/ and from the Hawaii Institute of Geophysics and Planetology (HIGP) MODVOLC WWW page http://modis.higp.hawaii.edu/.
Detailed reports available from these sources describing aspects of eruptions relevant for determining the nature of WFA observations, such as the extent and direction of lava flows, were used when deemed necessary. According to the GVP, 119 volcanoes were active globally between 1997 and 2002. The geographical coordinates of all 119 volcanoes were plotted together with the WFA data, and the dates of all WFA counts within a 10 km radius buffer around the cano location were compared against dates of reported vol-canic activity. The GLC2000 land cover map and Landsat scene bands 5-4-3 color composite quick-looks, with a nom-inal spatial resolution of 240 m–480 m (United States Geo-logical Survey (USGS) Global Visualization Viewer, http:// glovis.usgs.gov/) were often used, to determine if the counts might be vegetation fires, possibly ignited as a result of vol-canic eruptions. Observations that coincided with periods of volcanic activity, and did not appear to occur over vegetated areas were classified as non-vegetation fires.
2.5 Additional data screening
Preliminary visual inspection of the WFA data revealed the presence of large clusters of observations unlikely to cor-respond to vegetation fires. Some of the clusters exhibited regular geometric shapes, such as triangles and lines. These very conspicuous geometric clusters of observations were vi-sually identified and labeled false alarms caused by image acquisition/processing errors. Other clusters contained very large numbers of observations, concentrated in very short pe-riods of time, over sparsely vegetated areas that typically ex-hibited almost no fire activity. Identification of anomalous space-time data clusters was accomplished with exploratory spatial and temporal data analysis. The difference between daily observation counts and five-day moving means helped identify exceptional temporal clusters in a time-series of the full study period. Global counts maps were then generated for the periods of anomalous time clustering. The loca-tion of spatial clusters occurring during these periods was highlighted using kernel density estimation, a spatial inter-polation technique appropriate for individual point locations (Bailey and Gatrell, 1995). The likelihood of each space-time cluster of observations actually representing vegeta-tion fires was assessed via visual inspecvegeta-tion of contempo-rary Advanced Very High Resolution Radiometer (AVHRR)
1414 B. W. Mota et al.: Screening the World Fire Atlas
42
(a)
(b)
(c)
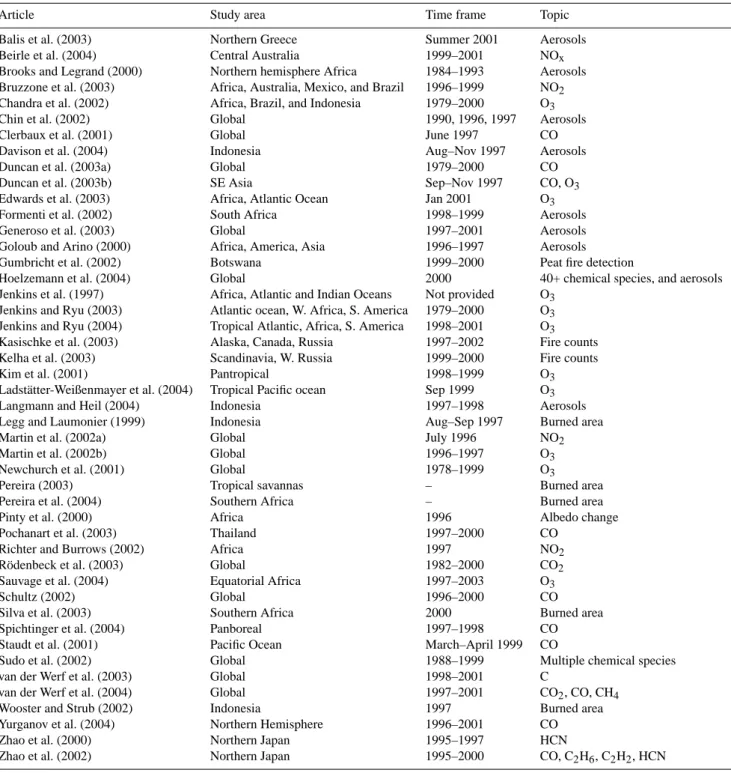
Figure 2.
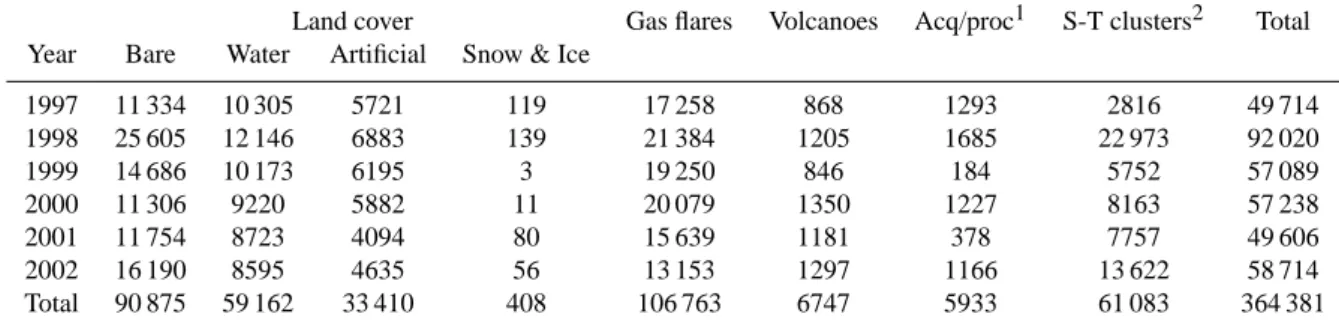
Table 3. Number of observations captured by each filter. An observation may have been captured by more than one filter.
Land cover Gas flares Volcanoes Acq/proc1 S-T clusters2 Total Year Bare Water Artificial Snow & Ice
1997 11 334 10 305 5721 119 17 258 868 1293 2816 49 714 1998 25 605 12 146 6883 139 21 384 1205 1685 22 973 92 020 1999 14 686 10 173 6195 3 19 250 846 184 5752 57 089 2000 11 306 9220 5882 11 20 079 1350 1227 8163 57 238 2001 11 754 8723 4094 80 15 639 1181 378 7757 49 606 2002 16 190 8595 4635 56 13 153 1297 1166 13 622 58 714 Total 90 875 59 162 33 410 408 106 763 6747 5933 61 083 364 381
1Data acquisition and processing errors. 2Space-time clusters.
3The grand total exceeds the number of screened observations due to counting by more than one filter.
satellite imagery, at 1 km2 spatial resolution, and/or Land-sat scene quick-looks. The AVHRR imagery was obtained from the National Oceanic and Atmospheric Administra-tion/National Environmental Satellite, Data and Information Service (NOAA/NESDIS) Comprehensive Large Array-data Stewardship System (CLASS), (http://www.class.noaa.gov/ nsaa/products/welcome).
3 Results
3.1 Temporal analysis
The original WFA dataset contained 1 026 616 observations, of which 772 762 (75.27%) were considered to actually rep-resent vegetation fires, while 253 854 (24.73%) correspond to false alarms and non-vegetation fires. The annual propor-tion of screened observapropor-tions varied between 21% and 28%. Table 2 summarizes the results of the WFA screening pro-cess, with results displayed per year. Figure 2 shows the daily resolution time-series of the original WFA data set (Fig. 2a), the time series of false alarms and non-vegetation fires re-moved from the WFA (Fig. 2b), and the time series of the screened dataset, containing only vegetation fires (Fig. 2c). The time-series in Fig. 2a reveals markedly seasonal patterns, with larger numbers of observations detected during the bo-real summer, approximately between July and October, and peaking in August–September. In 1997 the peak fire activ-ity occurred later, during the month of October. The year with the most counts was 1998, when very high numbers were detected between April and October. The time-series of non-vegetation fires and false alarms removed from the WFA (Fig. 2b) also exhibits a seasonal pattern, similar to that of the original data set. Most of the days with very large (>1000) number of counts screened occur between June and Septem-ber 1998. Smaller data spikes in other years also occur during the boreal summer. The screened WFA time-series (Fig. 2c) has fewer spikes and relatively to the original data
set, the seasonal component displays lower amplitude, while the phase does not appear to have shifted. The anomalously low numbers of observations recorded in January, February and December 2001, and in February and March 2002 cor-respond to periods of missing or incomplete data, as indi-cated in the WFA World Wide Web (WWW) page. Fig-ures 3a–e disaggregate the time-series of false alarms and non-vegetation fires into those of the various filters applied to the data. Note the scale variations in the different fig-ures. The observations screened with the land cover filter and with the gas flares filter (Figs. 3a–b) show a continuous distribution and a clearly seasonal trend, with more obser-vations during the boreal summer. In the case of the land cover filter, this seasonality is induced by hot land surfaces in the larger land expanses of the northern hemisphere. The seasonality in the counts screened with the gas flares filter results from an overlap with the land cover filter and with space-time clusters, as shown in Table 3. The seasonal trend is believed to be induced mostly by hot land surfaces, and ought not be inherent in the gas flares activity. Since our purpose is not to engage in a detailed analysis of the vari-ous types of observations included in the WFA, but only to eliminate those that do not correspond to vegetation fires, we did not attempt to remove the overlap between observations captured with the land cover and gas flares filters. Observa-tions screened with the volcanoes filter (Fig. 3c) also occur continuously but with a very low background level, and ex-hibit sporadic spikes corresponding to large eruptions. The acquisition/processing false alarms (Fig. 3d) occur sporadi-cally. Finally, the space-time hot surfaces clusters (Fig. 3e) display a discontinuous but markedly seasonal pattern, oc-curring only during the boreal summer.
3.2 Geographical and quantitative analysis
Figure 4 shows the location of space-time clusters of ob-servations, acquisition/processing errors, and counts due to volcanic activity. All acquisition/processing errors are
1416 B. W. Mota et al.: Screening the World Fire Atlas 0 200 400 600 800 1000 1200 1400 1600 1800 2000 Count s J an-97 Apr-97 Ju l-9 7 Oct-97 Ja n-98 Apr-98 Ju l-9 8 Oct-98 Ja n-99 Apr-99 Ju l-9 9 Oct-99 Ja n-00 Apr-00 Ju l-0 0 Oct-00 Ja n-01 Apr-01 Ju l-0 1 Oct-01 Ja n-02 Apr-02 Ju l-0 2 Oct-02 (a) 0 100 200 300 400 500 600 700 800 Count s J a n-97 Apr-9 7 Ju l-9 7 Oct-97 J an-98 Apr-9 8 Ju l-9 8 Oct-98 J an-99 Apr-9 9 Ju l-9 9 Oct-99 J an-00 Apr-0 0 Ju l-0 0 Oct-00 J an-01 Apr-0 1 Ju l-0 1 Oct-01 J an-02 Apr-0 2 Ju l-0 2 Oct-02 (b) 0 50 100 150 200 Count s J an-97 Apr-97 Ju l-9 7 Oct-97 Ja n-98 Apr-98 Ju l-9 8 Oct-98 Ja n-99 Apr-99 Ju l-9 9 Oct-99 Ja n-00 Apr-00 Ju l-0 0 Oct-00 Ja n-01 Apr-01 Ju l-0 1 Oct-01 Ja n-02 Apr-02 Ju l-0 2 Oct-02 (c) 0 100 200 300 400 500 600 700 800 900 1000 J an-97 Apr-97 Ju l-9 7 Oct-97 J an-98 Apr-98 Ju l-9 8 Oct-98 J an-99 Apr-99 Ju l-9 9 Oct-99 J an-00 Apr-00 Ju l-0 0 Oct-00 J an-01 Apr-01 Ju l-0 1 Oct-01 J an-02 Apr-02 Ju l-0 2 Oct-02 Count s (d) 0 1000 2000 3000 4000 5000 6000 Count s J an-97 Apr-97 Ju l-9 7 Oct-97 J an-98 Apr-98 Ju l-9 8 Oct-98 J an-99 Apr-99 Ju l-9 9 Oct-99 J an-00 Apr-00 Ju l-0 0 Oct-00 J an-01 Apr-01 Ju l-0 1 Oct-01 J an-02 Apr-02 Ju l-0 2 Oct-02 (e)
Fig. 3. Daily time series of observations removed from the WFA using various filters: land cover (a), oil and gas flares (b), volcanoes (c),
data acquisition/processing errors (d), and anomalous space-time clusters (e).
Table 4. Number of observations captured by various filter intersections.
Year LC1∩Fl LC ∩ Vol Fl ∩ Vol LC ∩ Fl ∩ Vol Clu ∩ LC Clu ∩ Fl LC ∩ A/P
1997 11 808 525 0 0 1829 84 524 1998 13 739 457 281 77 8558 836 15 1999 12 659 433 0 0 2851 441 16 2000 12 299 374 192 19 2880 443 60 2001 9724 539 125 19 2624 463 83 2002 8534 541 218 57 8690 101 704 Total 68 763 2869 816 172 27 432 2368 1402
"clusters" Acq/Proc Volcanoes
Fig. 4. Location of the major anomalous space-time clusters of observations, of data acquisition/processing errors, and of observations
resulting from volcanic activity.
located in the northern hemisphere, at relatively high lati-tudes. The space-time clusters of observations occur at lower latitudes, mostly in tropical and sub-tropical areas. No acqui-sition/processing errors, or space-time clusters are found in Africa or South America. Most counts of these three kinds occur in North America and Eurasia. Figures 5a–c display maps of the original WFA data set, the screened false alarms and non-vegetation fires, and the vegetation fires data set, re-spectively. At the scale used, Figs. 5a and c are very simi-lar, due to the strong spatial clustering of the screened data (Fig. 4b). Figure 5c displays the clusters of genuine fire ac-tivity, in southern Mexico, the cerrado savannas of Brazil, the savannas of the northern hemisphere of Africa, Indone-sia, and the Siberian Far East. The 1997–1998 El Ni˜no event strongly contributed to all of these concentrations of fire activity, with the possible exception of the African cluster (Nepstad et al., 1999; Siegert and Hoffmann, 2000; Page et al., 2002; Wooster and Strub, 2002; Haugaasen et al., 2003; van der Werf et al., 2004; Soja et al., 2004; Roman-Cuesta et al., 2004).
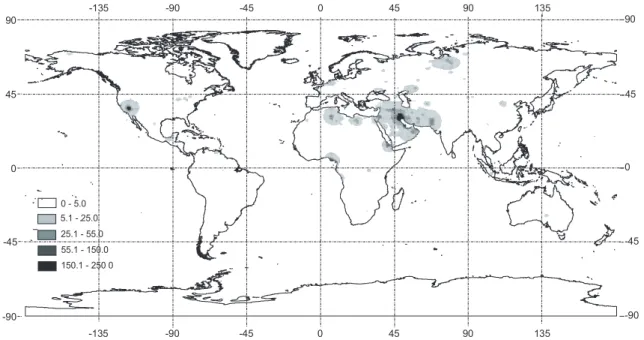
Figure 6 shows the histogram of counts screened per 0.5◦ cell, revealing the heavy positive skew of the distribution. In order to emphasize the location of the major observa-tion clusters, the data displayed in Fig. 5b were smoothed to a 0.5◦ grid cell (Fig. 7), using kernel density estima-tion (Bailey and Gatrell, 1995) with an adaptive Gaussian kernel encompassing 250 observations. This figure clearly shows the locations of the major clusters of screened ob-servations, in the Death Valley, California, USA, in Alge-ria and in coastal NigeAlge-ria, in the Persian Gulf region, ex-tending east to Pakistan, and in north-central Siberia. Ta-ble 3 shows the annual number of observations captured by each filter. The year with the largest number of counts is 1998, mostly due to false alarms. This is to be expected, since those counts are generated by hot ground surfaces and
1998 was the hottest year on record at the global scale, ac-cording to the NASA Goddard Institute for Space Studies (http://data.giss.nasa.gov/gistemp/). The year 2001 has the lowest number of observations, probably because it is the year with the most days of missing or incomplete data.
The land cover filter captured a total of 183 855 observa-tions, corresponding to 17.91% of the original WFA data. The bare areas class captures the most observations (8.85%), followed by water bodies (5.76%). Observations located over artificial surfaces and associated areas represent 3.3%, while only 0.04% of counts are found in the snow and ice class. Gas flares, volcanoes, acquisition/processing er-rors, and space-time clusters respectively represent 10.4%, 0.6%, 0.58% and 5.95% of the original number of WFA observations. One-hundred and nineteen volcanoes con-tained a total of 7145 observations within the 10-km radius buffer. Some of the observations located within the buffer of these volcanoes were considered actual vegetation fires, thus reducing to 6747 the number of observations screened out. In four cases, lava flows expanded beyond the buffer. Those observations were manually screened. The Kilauea, in Hawaii, USA, the Nyamuragira, in the Democratic Re-public of Congo, and the Etna, in Italy, generated the most counts (2307, 1004 and 658, respectively). Data acquisi-tion/processing errors were found in northern Alaska, the Bohai Bay in China, central Congo, western Siberia, Green-land, the Russia-Mongolia border area, the Bay of Bengal in the Indian Ocean, the Northwestern Territories, British Columbia and Quebec (Canada), and in the state of Ten-nessee (USA). The most important ones were those located in western Siberia (2193 counts) and in northern Alaska (917 counts). Corrupted satellite telemetry is a possible explana-tion for this kind of WFA counts. Figure 8 displays examples of data acquisition/processing errors.
1418 B. W. Mota et al.: Screening the World Fire Atlas 1-5 6-50 >500 51-500 6-50 >500 1-5 51-500 6-50 >500 1-5 51-500
Fig. 5. Global maps (1997–2002) of original WFA fire counts (a), data removed from the WFA (b), and screened data set (c).
Space-time observation clusters were all located in bare or sparsely vegetated surfaces of hot, arid regions, namely: Lake Eyre (Southern Australia), the Denakil depression (Ethiopia/Eritrea), the Zagros mountains foothills (Iran),
the Dead Sea (Israel), Death Valley (California, USA), the Kirthar range foothills (Pakistan), and southern Afghanistan. The most important ones are those in the Zagros foothills (12 898 counts) and the Kirthar foothills (9854 counts).
Table 4 displays the number of counts for the major filter intersections, i.e. numbers of observations that were captured by more than one filter. The filter intersections that capture the most observations are the one between land cover and gas flares, and the one between land cover and space-time clusters. The majority of gas and oil exploration sites are located either offshore or in desert areas. Thus, they intersect extensively with the water bodies and bare areas classes of the land cover mask. Space-time clusters typically occur on hot ground surfaces, and therefore predominate over the bare areas land cover class. Again, the year 1998 displays the largest and 2001 the lowest number of screened observations, for the reasons already mentioned.
4 Discussion and conclusions
The WFA algorithm 2 data set contains a large number of ob-servations that are not vegetation fires, in spite of having been built using only night time data. Commission errors, gener-ated by a variety of causes, including hot ground surfaces, gas flares, volcanoes, and image acquisition/processing prob-lems, represent almost one-quarter of all observations. We used a combination of geographical masks and visual data inspection to classify and subsequently remove these non-vegetation fires and false alarms from the dataset. The most time consuming step of the screening procedure was the identification of anomalous space-time clusters of observa-tions in areas that can carry fire, but where it is unlikely to oc-cur massively in very short periods of time. WFA screening based only on geographical masks would eliminate most of the unwanted data and is relatively easy to implement. How-ever, non-negligible errors would remain, located mostly in the Middle East and occurring during the boreal summer. Commission errors found are not randomly distributed but, on the contrary, are highly clustered in space and in time. Such clustering reflects, to some extent, the screening pro-cedures employed. By design, the gas flare screening, the night time lights screening, the volcano screening, and the visual/statistical cluster screening identify commission errors that are clustered in space an time. Any practical data screen-ing procedure for a dataset of this size can only be expected to remove the relatively more obvious false alarms and non-vegetation fires. Scattered, individual erroneous observations are very likely to escape the screening procedures employed, except for those eliminated by the land cover mask. Nev-ertheless, we believe that the clustered, relatively obvious false alarms and non-vegetation fires represent the majority of errors, especially the more persistent ones, and thus the filtered data set is considered a substantial improvement over the original, unfiltered WFA. Accuracy of the screening pro-cedure is expected to be lower during the periods of more im-precise data location, especially during the first semester of 2001, and mostly near the edges of the various spatial masks
0.00 0.50 1.00 1.50 2.00 2.50 3.00 1 201 401 601 801 1001 1201 1401 1601 1801 2001 2201 2401 2601 2801 3001 3201 3401 3601 3801 4001 4201 4401 l o g 10 # 0.5º cells
WFA counts screened
Fig. 6. Statistical distribution of the number of WFA counts
re-moved in each 0.5◦grid cell.
used. Screening based on visual and statistical cluster detec-tion procedures ought to remain essentially unaffected.
The temporal structure of errors may affect the character-ization of vegetation fire seasonality, but appears to have a larger impact upon estimates of inter-annual variability. The spatial pattern of errors may affect estimates of the magni-tude and geographical distribution of emissions sources, es-pecially in studies that included areas where large clusters of errors were found, and possibly also in the case of global analyses. These effects may have influenced results of re-search papers that used the original WFA data. The screened dataset provides a better characterisation of global fire geog-raphy, seasonality and inter-annual variability. It may con-tribute to improving the accuracy of emissions inventories based on statistics scaled with fire activity data (Schultz, 2002; Generoso et al., 2003), and also of burned area prod-ucts derived by combining the spectral signal of fire scars and that of active fires (Fraser et al., 2000; Giglio et al., 2006). Analyses of the relationships between fire and vegetation or land cover will also be more accurate, due to the removal of very large numbers of false alarms located in deserts and sparsely vegetated areas.
As additional WFA data become available, detection of ex-ceptional events may be automated using statistical methods for space-time cluster analysis (Baker, 1996; Kulldorff et al., 1998). In future near-real time active fire monitoring sys-tems, detection of space-time clusters may be implemented on-line, based on surveillance procedures such as those de-veloped by Rogerson (1997, 2001) and Kulldorff (2001).
The screened WFA dataset developed in this study will be available at the REanalysis of the TROpospheric chem-ical composition over the past 40 years (RETRO) project WWW page (http://retro.enes.org/datasets.html). Additional data screening, up to July 2005 is in progress.
1420 B. W. Mota et al.: Screening the World Fire Atlas
Fig. 7. Kernel density estimation maps of data removed from the WFA.
49
Figure 8.
Fig. 8. Examples of data acquisition/processing errors, located in northern Alaska, western Siberia, northeastern China, and northeastern
Acknowledgements. The data used in this study are from the
ATSR World Fire Atlas, European Space Agency-ESA/ESRIN, via Galileo Galilei, CP 64, 00044 Frascati, Italy. This research was funded by the European Union Fifth Framework Programme research project REanalysis of the TROpospheric chemical compo-sition over the past 40 years (RETRO) (EVK2 CT-2002-00170).
Edited by: A. B. Guenther
References
Anonymous: Validation of the consistent-year V003 MODIS land cover product, (http://www-modis.bu.edu/landcover/ userguidelc/), 2004.
Anyamba, A., Justice, C. O., Tucker, C. J., and Mahoney, R.: Sea-sonal to interannual variability of vegetation and fires at SAFARI 2000 sites inferred from Advanced Very High Resolution Ra-diometer time series data, J. Geophys. Res.-Atmos., 108(D13), 8507, doi:10.1029/2002JD002464, 2003.
Arino, O. and Rosaz, J.-M.: 1997 and 1998 World ATSR Fire Atlas using ERS-2 ATSR-2 data, Proceedings of the Joint Fire Science Conference (Boise, Idaho: University of Idaho and the Interna-tional Association of Wildland Fire), 177–182, 1999.
Arino, O. and Plummer, S.: The Along Track Scanning Radiometer World Fire Altas – Detection of night-time fire activity, IGBP-DIS Working Paper #23, Potsdam, Germany, 2001.
Bachelet, D., Neilson, R. P., Lenihan, J. M., and Drapek, R. J.: Cli-mate change effects on vegetation distribution and carbon budget in the United States. Ecosystems, 4, 164–185, 2001.
Bailey, T. C. and Gatrell, A. C.: Interactive Spatial Data Analysis, Burnt Mill, Essex, England: Longman Scientific & Technical, 1995.
Baker, R. D.: Testing for space-time clusters of unknown size, J. Appl. Stat., 23, 543–554, 1996.
Balis, D. S., Amiridis, V., Zerefos, C., Gerasopoulos, E., Andreae, M., Zanis, P., Kazantzidis, A., Kazadzis, S., and Papayannis, A.: Raman lidar and sunphotometric measurements of aerosol opti-cal properties over Thessaloniki, Greece during a biomass burn-ing episode, Atmos. Environ., 37, 4529–4538, 2003.
Beirle, S., Platt, U., Wenig, M., and Wagner, T.: NOx production by lightning estimated with GOME, Adv. Space Res., 34, 793–797, 2004.
Bey, I., Jacob, D. J., Yantosca, R. M., Logan, J. A., Field, B., Fiore, A. M., Li, Q., Liu, H., Mickley, L. J., and Schultz, M.: Global modeling of tropospheric chemistry with assimilated me-teorology: Model description and evaluation, J. Geophys. Res.-Atmos., 106, 23 073–23 096, 2001.
Brooks, N. and Legrand, M.: Dust variability over northern Africa and rainfall in the Sahel, in: Linking Climate Change to Land Surface Change, edited by: McLaren, S. and Kniveton, D., Dor-drecht: Kluwer Academic Publishers, 1–25, 2000.
Brown, J. F., Loveland, T. R., Ohlen, D. O., and Zhu, Z.: The Global Land-Cover Characteristics Database: The Users’ Per-spective, Photogrammetric Engineering and Remote Sensing, 65(9), 1069–1074, 1999.
Bruzzone, L., Casadio, S., Cossu, R., Sini, F., and Zehner, C.: A system for monitoring NO2emissions from biomass burning
by using GOME and ATSR-2 data, Int. J. Remote Sens., 24(8), 1709–1721, 2003.
Chandra, S., Ziemke, J. R., Bhartia, P. K., and Martin, R. V.: Tropical tropospheric ozone: Implications for dynamics and biomass burning, J. Geophys. Res.-Atmos., 107(D14), 4188, doi:10.1029/2001JD000447, 2002.
Chin, M., Ginoux, P., Kinne, S., Torres, O., Holben, B. N., Duncan, B. N., Martin, R. V., Logan, J. A., Higurashi, A., and Nakajima, T.: Tropospheric aerosol optical thickness from the GOCART model and comparisons with satellite and Sun photometer mea-surements, J. Atmos. Sci., 59(3), 461–483, 2002.
Clerbaux, C., Hadji-Lazaro, J., Hauglustaine, D., and Megie, G.: Assimilation of carbon monoxide measured from satellite in a three-dimensional chemistry-transport model, J. Geophys. Res.-Atmos., 106(D14), 15 385–15 394, 2001.
Danko, D. M.: The Digital Chart of the World, Photogrammetric Engineering and Remote Sensing, 58(8), 1125–1128, 1992. Davison, P. S., Roberts, D. L., Arnold, R. T., and Colvile, R. N.:
Estimating the direct radiative forcing due to haze from the 1997 forest fires in Indonesia, J. Geophys. Res.-Atmos., 109, D10207, doi:10.1029/2003JD004264, 2004.
Duncan, B. N., Bey, I., Chin, M., Mickley, L. J., Fairlie, T. D., Martin, R. V., and Matsueda, H.: Indonesian wildfires of 1997: Impact on tropospheric chemistry, J. Geophys. Res.-Atmos., 108(D15), 4458, doi:10.1029/2002JD003195, 2003b.
Duncan, B. N., Martin, R. V., Staudt, A. C., Yevich, R., and Logan, J. A.: Interannual and seasonal variability of biomass burning emissions constrained by satellite observations, J. Geo-phys. Res.-Atmos., 108(D2), 4100, doi:10.1029/2002JD002378, 2003a.
Dwyer, E., Pinnock, S., Gr´egoire, J.-M., and Pereira, J. M. C.: Global spatial and temporal distribution of vegetation fire as de-termined from satellite observations, Int. J. Remote Sensing, 21, 1289–1302, 2000.
Edwards, D. P., Lamarque, J.-F., Atti´e, J.-L., Emmons, L. K., Richter, A., Cammas, J.-P., Gille, J. C., Francis, G. L., Deeter, M. N., Warner, J., Ziskin, D. C., Lyjak, L. V., Drummond J. R., and Burrows, J. P.: Tropospheric ozone over the tropical Atlantic: a satellite perspective, J. Geophys. Res.-Atmos., 108(D8), 4237, doi:10.1029/2002JD002927, 2003.
Elvidge, C. D., Baugh, K. E., Kihn, E. A., Kroehl, H. W., and Davis, E. R.: Mapping of city lights using DMSP Operational Linescan System data, Photogrammetric Engineering and Remote Sens-ing, 63(6), 727–734, 1997.
Elvidge, C. D., Imhoff, M. L., Baugh, K. E., Hobson, V. R., Nelson, I., Safran, J., Dietz, J. B., and Tuttle, B. T.: Night-time lights of the world: 1994–1995 ISPRS, J. Photogrammetry and Remote Sensing, 56, 81–99, 2001.
Formenti, P., Winkler, H., Fourie, P., Piketh, S., Makgopa, B., Helas, G., and Andreae, M. O.: Aerosol optical depth over a remote semi-arid region of South Africa from spectral measure-ments of the daytime solar extinction and the night time stellar extinction, Atmos. Res., 62(1–2), 11–32, 2002.
Fraser, R. H., Li, Z., and Cihlar, J.: Hotspot and NDVI Differenc-ing Synergy (HANDS) A New Technique for Burned Area Map-ping over Boreal Forest, Remote Sens. Environ., 74(3), 362–376, 2000.
Friedl, M. A., McIver, D. K., Hodges, J. C. F., Zhang, X. Y., Mu-choney, D., Strahler, A. H., Woodcock, C. E., Gopal, S.,
Schnei-1422 B. W. Mota et al.: Screening the World Fire Atlas
der, A., Cooper, A., Baccini, A., Gao, F., and Schaaf, C.: Global land cover mapping from MODIS: algorithms and early results, Remote Sens. Environ., 83(1–2), 287–302, 2002.
Fritz, S., Bartholom´e, E., Belward, A., Hartley, A., Stibig, H.-J., Eva, H., Mayaux, P., Bartalev, S., Latifovic, R., Kolmert, S., Roy, P. S., Agrawal, S., Bingfang, W., Wenting, X., Ledwith, M., Pekel, J.-F., Giri, C., M¨ucher, S., de Badts, E., Tateishi, R., Champeaux, J.-L., and Defourny, P.: Harmonisation, mo-saicing and production of the Global Land Cover 2000 database (Beta Version), European Commission, DG-JRC, EUR 20849 EN, 2003.
Generoso, S., Breon, F.-M., Balkanski, Y., Boucher, O., and Schultz, M.: Improving the seasonal cycle and interannual vari-ations of biomass burning aerosol sources, Atmos. Chem. Phys., 3, 1211–1222, 2003.
Giglio, L., Kendall, J. D., and Mack, R.: A multi-year fire data set for the tropics derived from the TRMM VIRS, Int. J. Remote Sens., 24(22), 4505–4525, 2002.
Giglio, L., van der Werf, G. R., Randerson, J. T., Collatz, G. J., and Kasibhatla, P.: Global estimation of burned area using MODIS active fire observations, Atmos. Chem. Phys., 6, 957–974, 2006. Giri, C., Zhu, Z., and Reed, B.: A comparative analysis of the Global Land Cover 2000 and MODIS land cover data sets, Re-mote Sens. Environ., 94(1), 123–132, 2005.
Goloub, P. and Arino, O.: Verification of the consistency of Polder Aerosol Index over land with ATSR-2/ERS-2 fire product, Geo-phys. Res. Lett., 27(6), 899–902, 2000.
Gr´egoire, J.-M., Tansey, K., and Silva, J. M. N.:, The GBA2000 initiative: developing a global burnt area database from SPOT-VEGETATION imagery, Int. J. Remote Sens., 24(6), 1369–1376, 2003.
Gumbricht, T., McCarthy, T. S., McCarthy, J., Roy, D., Frost, P. E., and Wessels, K.: Remote sensing to detect sub-surface peat fires and peat fire scars in the Okavango Delta, Botswana, South African J. Sci., 98(7–8), 351–358, 2002.
Gutman, G., Csiszar, I., and Romanov, P.: Using NOAA/AVHRR products to monitor El Nino impacts: Focus on Indonesia in 1997–98, Bull. Am. Meteorol. Soc., 81(6), 1189–1205, 2000. Hashimoto, H., Nemani, R. R., White, M. A., Jolly, W. M.,
Piper, S. C., Keeling, C. D., Myneni, R. B., and Running, S. W.: El Ni˜no–Southern Oscillation–induced variability in terrestrial carbon cycling, J. Geophys. Res., 109, D23110, doi:10.1029/2004JD004959, 2004.
Haugaasen, T., Barlow, J., and Peres, C. A.: Surface wildfires in central Amazonia: short-term impact on forest structure and car-bon loss, Forest Ecology and Management, 179(1–3), 321–331, 2003.
Hoelzemann, J. J., Schultz, M. G., Brasseur, G. P., and Granier, C.: Global Wildland Fire Emission Model (GWEM): Evaluating the use of global area burnt satellite data, J. Geophys. Res., 109, D14S04, doi:10.1029/2003JD003666, 2004.
Holmgren, M., Scheffer, M., Ezcurra, E., Guti´errez, J. R., and Mohren, G. M. J.: El Ni˜no effects on the dynamics of terres-trial ecosystems, Trends in Ecology & Evolution, 16(2), 89–94, 2001.
Houghton, R. A.: Revised estimates of the annual net flux of carbon to the atmosphere from changes in land use and land manage-ment 1850–2000, Tellus, 55B, 378–390, 2003.
Ito, A. and Penner, J. E.: Global estimates of biomass burning
emis-sions based on satellite imagery for the year 2000, J. Geophys. Res.-Atmos., 109, D14S05, doi:10.1029/2003JD004423, 2004. Jenkins, G. S. and Ryu, J.-H.: Linking horizontal and vertical
trans-ports of biomass fire emissions to the Tropical Atlantic Ozone Paradox during the Northern Hemisphere winter season: clima-tology, Atmos. Chem. Phys., 4, 449–469, 2004.
Jenkins, G. S., Mohr, K., Morris, V. R., and Arino, O.: The role of convective process over the Zaire-Congo Basin to the south-ern hemispheric ozone maximum, J. Geophys. Res.-Atmos., 102(D15), 18 963–18 980, 1997.
Jenkins, G. S. and Ryu, J.-H.: Space-borne observations link the tropical atlantic ozone maximum and paradox to lightning, At-mos. Chem. Phys., 4, 361–375, 2004.
Kasischke, E. S., Hewson, J. H., Stocks, B., van der Werf, G., and Randerson, J.: The use of ATSR active fire counts for es-timating relative patterns of biomass burning – a study from the boreal forest region, Geophys. Res. Lett., 30(18), 1969, doi:10.1029/2003GL017859, 2003.
Kelha, V., Rauste, Y., Hame, T., Sephton, T., Buongiorno, A., Frauenberger, O., Soini, K., Venalainen, A., San Miguel-Ayanz, J., and Vainio, T.: Combining AVHRR and ATSR satellite sensor data for operational boreal forest fire detection, Int. J. Remote Sens., 24(8), 1691–1708, 2003.
Kim, J. H., Newchurch, M. J., and Han, K.: distribution of trop-ical tropospheric ozone determined by the scan-angle method applied to TOMS measurements, J. Atmos. Sci., 58(18), 2699– 2708, 2001.
Kinne, S., Lohmann, U., Feichter, J., Schulz, M., Timmreck, C., Ghan, S., Easter, R., Chin, M., Ginoux, P., Takemura, T., Tegen, I., Koch, D., Herzog, M., Penner, J., Pitari, G., Hol-ben, B., Eck, T., Smirnov, A., Dubovik, O., Slutsker, I., Tanr´e, D., Torres, O., Mishchenko, M., Geogdzhayev, I., Chu, D. A., and Kaufman, Y.: Monthly averages of aerosol proper-ties: A global comparison among models, satellite data, and AERONET ground data, J. Geophys. Res.-Atmos., 108(D20), 4634, doi:10.1029/2001JD001253, 2003.
Kulldorff, M., Athas, W., Feuer, E., Miller, B., and Key, C.: Evalu-ating cluster alarms: A space-time scan statistic and brain cancer in Los Alamos, American Journal of Public Health, 88, 1377– 1380, 1998.
Kulldorff, M.: Prospective time-periodic geographical disease surveillance using a scan statistic, J. Roy. Stat. Soc., Series A, 164, 61–72, 2001.
Ladst¨atter-Weißenmayer, A., Meyer-Arnek, J., Schlemm, A., and Burrows, J. P.: Influence of stratospheric airmasses on tropo-spheric vertical O3 columns based on GOME (Global Ozone Monitoring Experiment) measurements and backtrajectory cal-culation over the Pacific, Atmos. Chem. Phys., 4, 903–909, 2004. Langenfelds,, R. L., Francey, R. J., Pak, B. C., Steele, L. P., Lloyd, J., Trudinger, C. M., and Allison, C. E.: Interannual growth rate variations of atmospheric CO2 and its D13C, H2, CH4, and CO between 1992 and 1999 linked to biomass burning, Global Bio-geochemical Cycles, 16(3), 1048, doi:10.1029/2001GB001466, 2002.
Langmann, B. and Heil, A.: Release and dispersion of vegeta-tion and peat fire emissions in the atmosphere over Indonesia 1997/1998, Atmos. Chem. Phys., 4, 2145–2160, 2004.
Legg, C. A. and Laumonier, Y.: Fires in Indonesia, 1997: A remote sensing perspective, Ambio, 28, 479–485, 1999.
Li, Z., Kaufman, Y. J., Ichoku, C., Fraser, R., Trishchenko, A., Giglio, L., Jin, J.-Z., and Yu, X.: A review of AVHRR-based active fire detection algorithms: principles, limitations, and rec-ommendations, in: Global and Regional Vegetation Fire Moni-toring from Space: Planning a Coordinated International Effort, edited by: Ahern, F. J., Goldammer, J. G., and Justice, C. O., The Hague, The Netherlands: SPB Academic Publishing, 199–225, 2001.
Lobert, J. M., Keene, W. C., Logan, J. A., and Yevich, R.: Global chlorine emissions from biomass burning: Reactive Chlorine Emissions Inventory, J. Geophys. Res.-Atmos., 104(D7), 8373– 8389, 1999.
Malingreau, J.-P., Stephens, G., and Fellows, L.: Remote-sensing of forest-fires – Kalimantan and North-Borneo in 1982–83, Ambio, 14(6), 314–321, 1985.
Mart´ın, M. P., Cecatto, P., Flasse, S., and Downey, I.: Fire de-tection and fire growth monitoring using satellite data, in: Re-mote Sensing of Large Wildfires in the European Mediterranean Basin, edited by: Chuvieco, E., Berlin: Springer-Verlag, 101– 122, 1999.
Martin, R. V., Chance, K., Jacob, D. J., Kurosu, T. P., Spurr, R. J. D., Bucsela, E., Gleason, J. F., Palmer, P. I., Bey, I., Fiore, A. M., Li, Q., Yantosca, R. M., and Koelemeijer, R. B. A.: An improved retrieval of tropospheric nitrogen diox-ide from GOME, J. Geophys. Res.-Atmos., 107(D20), 4437, doi:10.1029/2001JD001027, 2002.
Martin, R. V., Jacob, D. J., Logan, J. A., Bey, I., Yantosca, R. M., Staudt, A. C., Li, Q., Fiore, A. M., Duncan, B. N., Liu, H., and Ginoux, P.: Interpretation of TOMS observa-tions of tropical tropospheric ozone with a global model and in-situ observations, J. Geophys. Res.-Atmos., 107(D18), 4351, doi:10.1029/2001JD001480, 2002.
Menon, S., Hansen, J., Nazarenko, L., and Luo, Y.: Climate effects of black carbon aerosols in China and India, Science, 297, 2250– 2253, 2002.
Nepstad, D. C., Ver´ıssimo, A., Alencar, A., Nobre, C., Lima, E., Lefebvre, P., Schlesinger, P., Potter, C., Moutinho, P., Mendoza, E., Cochrane, M., and Brooks, V.: Large-scale impoverishment of Amazonian forests by logging and fire, Nature, 398, 505–508, 1999.
Newchurch, M. J., Liu, X., and Kim, J. H.: Lower tropospheric ozone (LTO) derived from TOMS near mountainous regions, J. Geophys. Res.-Atmos., 106(D17), 20 403–20 412, 2001. Oglesby, R. J., Marshall , S., and Taylor, J. A.: The climatic effects
of biomass burning: investigations with a global climate model, Environmental Modelling & Software, 14, 253–259, 1999. Olson, J. R., Baum, B. A., Cahoon, D. R., and Crawford, J.:
Frequency and distribution of forest, savanna, and crop fires over tropical regions during PEM-Tropics A, J. Geophys. Res.-Atmos., 104(D5), 5865–5876, 1999.
Page, S. E., Siegert, F., Rieley, J. O., Boehm, H.-D. V., Jaya, A., and Limin, S.: The amount of carbon released from peat and forest fires in Indonesia during 1997, Nature, 420(6911), 61–65, 2002. Pereira, J. M. C.: Remote sensing of burned areas in tropical
savan-nas, Int. J. Wildland Fire, 12, 259–270, 2003.
Pereira, J. M. C., Mota, B. W., Privette, J. L., Caylor, K. K., Silva, J. M. N., S´a, A. C. L., and Ni-Meister, W.: A simulation analysis of the detectability of understory burns in miombo woodlands, Remote Sens. Environ., 93, 296–310, 2004.
Pereira, J. M. C., Pereira, B. S., Barbosa, P. M., Stroppiana, D., Vas-concelos, M. J. P., and Gr´egoire, J.-M.: Satellite monitoring of the overall fire activity in the EXPRESSO study area during the dry season experiment: active fires, burnt areas, and atmospheric emissions, J. Geophys. Res.-Atmos., 104, 30 701–30 712, 1999a. Pinty, B., Verstraete, M. M., and Gobron, N.: Do man-made fires affect Earth’s surface reflectance at continental scales? EOS,Transactions, American Geophysical Union, 81(34), 381 and 388–389, 2000.
Pochanart, P., Akimoto, H., Kajii, Y., and Sukasem, P.: Car-bon monoxide, regional-scale transport, and biomass burn-ing in tropical continental Southeast Asia: Observations in rural Thailand, J. Geophys. Res.-Atmos., 108(D17), 4552, doi:10.1029/2002JD003360, 2003.
Potter, C., Tan, P.-N., Steinbach, M., Klooster, S., Kumar, V., My-neni, R., and Genovese, V.: Major disturbance events in terres-trial ecosystems detected using global satellite data sets, Global Change Biology, 9(7), 1005–1021, 2003.
Prins, E. M. and Menzel, W. P.: Geostationary satellite detection of biomass burning in South America, Int. J. Remote Sens., 13, 2783–2799, 1992.
Prins, E. M. and Menzel, W. P.: Trends in South American biomass burning detected with the GOES VAS from 1983–1991, J. Geo-phys. Res.-Atmos., 99(D8), 16 719–16 735, 1994.
Richter, A. and Burrows, J. P.: Retrieval of tropospheric NO2 from GOME measurements, Adv. Space Res., 29, 1673–1683, 2002. R¨odenbeck, C., Houwelling, S., Gloor, M., and Heimann, M.: CO2
flux history 1982–2001 inferred from atmospheric data using a global inversion of atmospheric transport, Atmos. Chem. Phys., 3, 1919–1964, 2003.
Rogerson, P.: Surveillance systems for monitoring the development of spatial patterns, Statistics in Medicine, 16, 2081–2093, 1997. Rogerson, P.: Monitoring point patterns for the development of
space-time clusters, Journal of the Royal Statistical Society, Se-ries A, 164, 87–96, 2001.
Roman-Cuesta, R. M., Retana, J., and Gracia, M.: Fire trends in tropical Mexico-A case study of Chiapas, J. Forestry, 102(1), 26– 32, 2004.
Sauvage, B., Thouret, V., Cammas, J.-P., Gheusi, F., Athier, G., and N´ed´elec, P.: Tropospheric ozone over Equatorial Africa: regional aspects from the MOZAIC data, Atmos. Chem. Phys., 5, 311– 335, 2005.
Schultz, M. G.: On the use of ATSR fire count data to estimate the seasonal and interannual variability of vegetation fire emissions, Atmos. Chem. Phys., 2, 387–395, 2002.
Setzer, A. W. and Pereira, M. C.: Amazonia biomass burnings in 1987 and an estimate of their tropospheric emissions, Ambio, 20(1), 19–22, 1991.
Siegert, F. and Hoffmann, A. A.: The 1998 forest fires in East Kali-mantan (Indonesia): a quantitative evaluation using high reso-lution, multitemporal ERS-2 SAR images and NOAA-AVHRR hotspot data, Remote Sens. Environ., 72, 64–77, 2000.
Silva, J. M. N., Pereira, J. M. C., Cabral, A. I., S´a, A. C. L., Vas-concelos, M. J. P., Mota, B., and Gr´egoire, J.-M.: An estimate of the area burned in southern Africa during the 2000 dry sea-son using SPOT-VEGETATION satellite data, J. Geophys. Res.-Atmos., 108(D13), 8498, doi:10.1029/2002JD002320, 2003. Soja, A. J., Sukhinin, I., Cahoon Jr., D. R., Shugart, H. H., and
distribu-1424 B. W. Mota et al.: Screening the World Fire Atlas
tion and area burned in Siberia, Int. J. Remote Sens., 25(10), 1939–1960, 2004.
Spichtinger, N., Damoah, R., Eckhardt, S., Forster, C., James, P., Beirle, S., Marbach, T., Wagner, T., Novelli, P. C., and Stohl, A.: Boreal forest fires in 1997 and 1998: a seasonal comparison us-ing transport model simulations and measurement data, Atmos. Chem. Phys., 4, 1857–1868, 2004 .
Staudt, A. C., Jacob, D. J., Ravetta, F., Logan, J. A., Bachiochi, D., Krishnamurti, T. N., Sandholm, S., Ridley, B., Singh, H. B., and Talbot, B.: Sources and chemistry of nitrogen oxides over the tropical Pacific, J. Geophys. Res.-Atmos., 108(D2), 8239, doi:10.1029/2002JD002139, 2003.
Staudt, A. C., Jacob, D. J, Logan, J. A., Bachiochi, D., Kr-ishnamurti, T. N., and Sachse, G. W.: Continental sources, transoceanic transport, and interhemispheric exchange of carbon monoxide over the Pacific, J. Geophys. Res.-Atmos., 106(D23), 32 571–32 590, 2001.
Strahler, A., Muchoney, D., Borak, J., Friedl, M., Gopal, S., Lam-bin, E., and Moody, A.: MODIS land cover product algorithm theoretical basis document (ATBD) version 5.0–MODIS land cover and land cover change. (http://modis.gsfc.nasa.gov/data/ atbd/atbd mod12.pdf), 1999.
Stroppiana, D., Pinnock, S., and Gr´egoire, J.-M.: The Global Fire Product: daily fire occurrence from April 1992 to December 1993 derived from NOAA AVHRR data, Int. J. Remote Sens., 21(6–7), 1279–1288, 2000.
Sudo, K., Takahashi, M., and Akimoto, H.: CHASER: A global chemical model of the troposphere 2, Model results and evalua-tion, J. Geophys. Res.-Atmos., 107, doi:10.1029/2001JD001114, 2002.
Tansey, K., Gr´egoire, J.-M., Stroppiana, D., Sousa, A., Silva, J., Pereira, J. M. C., Boschetti, L., Maggi, M., Brivio, P. A., Fraser, R., Flasse, S., Ershov, D., Binaghi, E., Graetz, D., and Peduzzi, P.: Vegetation burning in the year 2000: Global burned area estimates from SPOT VEGETATION data, J. Geophys. Res.-Atmos., 109(D14), D14S03, doi:10.1029/2003JD003598, 2004.
van der Werf, G., Randerson, J. T., Collatz, G. J., and Giglio, L.: Carbon emissions from fires in tropical and subtropical ecosys-tems, Global Change Biology, 9, 1–16, 2003.
van der Werf, G. R., Randerson, J. T., Collatz, G. J., Giglio, L., Kasibhatla, P. S., Arellano Jr., A. F., Olsen, S. C., and Kasischke, E. S.: Continental-scale partitioning of fire emissions during the 1997 to 2001 El Nino/La Nina period, Science, 303(5654), 73– 76, 2004.
Wooster, M. J. and Strub, N.: Study of the 1997 Borneo fires: Quan-titative analysis using global area coverage (GAC) satellite data, Global Biochemical Cycles, 16(1), doi:10.1029/2000GB001357, 2002.
Wooster, M. J. and Rothery, D. A.: A review of volcano surveil-lance applications using the ATSR instrument series, Adv. Envi-ron. Monitoring and Modelling, 1(1), 97–123, 2002.
Yurganov, L. N., Blumenstock, T., Grechko, E. I., Hase, F., Hyer, E. J., Kasischke, E. S., Koike, M., Kondo, Y., Kramer, I., Le-ung, F.-Y., Mahieu, E., Mellqvist, J., Notholt, J., Novelli, P. C., Rinsland, C. P., Scheel, H. E., Schulz, A., Strandberg, A., Suss-mann, R., Tanimoto, H.,Velazco, V., Zander, R., and Zhao, Y.: A quantitative assessment of the 1998 carbon monoxide emission anomaly in the northern hemisphere based on total column and surface concentration measurements, J. Geophys. Res.-Atmos., 109(D15), D15305, doi:10.1029/2004JD004559, 2004. Zhao, Y., Kondo, Y., Liu, X., Koike, M., Irie, H., Suzuki, K., Sera,
M., and Ikegami, Y.: Seasonal variations of HCN over north-ern Japan measured by ground-based infrared solar spectroscopy, Geophys. Res. Lett., 27(14), 2085–2088, 2000.
Zhao, Y., Strong, K., Kondo, Y., Koike, M., Matsumi, Y., Irie, H., Rinsland, C. P., Jones, N. B., Suzuki, K., Nakajima, H., Nakane, H., and Murata, I.: Spectroscopic measurements of tropospheric CO, C2H6, C2H2, and HCN in northern Japan, J. Geophys.