HAL Id: hal-00295602
https://hal.archives-ouvertes.fr/hal-00295602
Submitted on 8 Feb 2005
HAL is a multi-disciplinary open access
archive for the deposit and dissemination of
sci-entific research documents, whether they are
pub-lished or not. The documents may come from
teaching and research institutions in France or
abroad, or from public or private research centers.
L’archive ouverte pluridisciplinaire HAL, est
destinée au dépôt et à la diffusion de documents
scientifiques de niveau recherche, publiés ou non,
émanant des établissements d’enseignement et de
recherche français ou étrangers, des laboratoires
publics ou privés.
events in the boreal forest atmosphere during QUEST
K. Sellegri, M. Hanke, B. Umann, F. Arnold, M. Kulmala
To cite this version:
K. Sellegri, M. Hanke, B. Umann, F. Arnold, M. Kulmala. Measurements of organic gases during
aerosol formation events in the boreal forest atmosphere during QUEST. Atmospheric Chemistry and
Physics, European Geosciences Union, 2005, 5 (2), pp.373-384. �hal-00295602�
SRef-ID: 1680-7324/acp/2005-5-373 European Geosciences Union
Chemistry
and Physics
Measurements of organic gases during aerosol formation events in
the boreal forest atmosphere during QUEST
K. Sellegri1, M. Hanke1, B. Umann1, F. Arnold1, and M. Kulmala2
1Atmospheric Physic Division, Max Planck Institute for Nuclear Physics, Heidelberg, Germany 2Department of Physical Sciences, University of Helsinki, Finland
Received: 26 March 2004 – Published in Atmos. Chem. Phys. Discuss.: 20 August 2004 Revised: 11 January 2005 – Accepted: 25 January 2005 – Published: 8 February 2005
Abstract. Biogenic VOCs are important in the growth and
possibly also in the early stages of formation of atmospheric aerosol particles. In this work, we present 10 min-time reso-lution measurements of organic trace gases at Hyyti¨al¨a, Fin-land during March 2002. The measurements were part of the project QUEST (Quantification of Aerosol Nucleation in the European Boundary Layer) and took place during a two-week period when nucleation events occurred with various intensities nearly every day. Using a ground-based Chem-ical Ionization Mass Spectrometer (CIMS) instrument, the following trace gases were detected: acetone, TMA, DMA, mass 68 amu (candidate=isoprene), monoterpenes, methyl vinyl ketone (MVK) and methacrolein (MaCR) and monoter-pene oxidation products (MTOP). For all of them except for the amines, we present daily variations during different classes of nucleation events, and non-event days. BVOC ox-idation products (MVK, MaCR and MTOP) show a higher ratio to the CS on event days compared to non-event days, in-dicating that their abundance relative to the surface of aerosol available is higher on nucleation days. Moreover, BVOC ox-idation products are found to show significant correlations with the condensational sink (CS) on nucleation event days, which indicates that they are representative of less volatile organic compounds that contribute to the growth of the nu-cleated particles and generally secondary organic aerosol for-mation. Behaviors of BVOC on event and non event days are compared to the behavior of CO.
1 Introduction
Organic molecules have been found to be important con-stituents of atmospheric aerosols in many air masses (No-vakov et al., 1997; Sellegri et al., 2003), and are often present Correspondence to: K. Sellegri
together with sulfate and other inorganic species in a sin-gle aerosol particle (Murphy et al., 1998). However, the chemical composition of particles at an early stage of their formation (nano-particles) is still an open question, as the aerosol mass available for analysis is not sufficient. We know now that “atmospheric oxidation of biogenic hydrocarbons, such as monoterpenes, is estimated to be a significant source of global aerosol” (Yu et al., 1999), as established by sev-eral laboratory studies (Hoffmann et al., 1997; Griffin et al., 1999; Koch et al., 2000; Gao et al., 2001) and field studies (Leaitch et al., 1999; Kavouras et al., 1999). The important question related to the ability of organic gases to form sec-ondary aerosol particles, i.e. when and how they are incorpo-rated into the particulate phase, can be alternatively studied from the gaseous point of view.
Smog chamber experiments showed that very low organic-ozone reactant levels as precursor for the formation of new sub-µm aerosols were needed (Gao et al., 2001). In the bo-real forest, frequent formation of new particles has been ob-served (Kulmala et al., 2001a), and VOCs (Volatile Organic Compounds) have been studied in relation to this new par-ticle formation in different manners. Seasonal and diurnal variation of terpenes have been measured, using Tenax tubes (Hakola et al., 2000), emission fluxes of monoterpenes have been studied using Tenax tubes as well with a two hours reso-lution (Janson et al., 2001), and vertical profiles of monoter-penes have been measured using tethered balloons and ad-sorbent cartridges (Spirig et al., 2004). However, high time resolution measurements of terpenes and particularly of their oxidation products, which are candidates for condensation, are missing to address the possibility of organic-induced nu-cleation.
VOCs are released from a wide variety of sources, and their mixing ratios measured at one point can be either dom-inated by a remote source or, in our case, by the local bio-genic source or even a local pollution source. Most VOCs react with hydroxyl radicals (OH); some can be photolyzed,
react with ozone, or at night with nitrate radicals (NO3). In this work, we present measurements of organic gases with a high time resolution on the Hyyti¨al¨a SMEAR II station site, using a ground-based CIMS instrument developed by MPI-K Heidelberg. Both the fast time response and the extended periods of measurements allow the study of the variability of mixing ratios, hence giving indications on the proximity of their sources/sinks. This paper aims to present the at-mospheric time evolution of volatile organic gases in rela-tion to nuclearela-tion events. Dimethylamine (DMA), trimethy-lamine (TMA), the sum of Methyl Vinyl Ketone (MVK) and methacrolein (MaCR) and MTOP are studied as organic can-didates, or representative of organic candidates for nucle-ation and/or growth of the newly formed particles. Mass 68 amu (candidate=isoprene) and the sum of monoterpenes are also reported as precursors of condensing species, and CO and acetone are reported as indicators of organic degra-dation products as a whole.
2 Site and sampling characteristics
2.1 Site characteristics
The SMEAR II experimental station (Station for Mea-suring Forest Ecosystem-Atmosphere Relations) located in Hyyti¨al¨a, southern Finland (61◦51◦N, 24◦17 E, 181 m above sea level) is representative of the boreal coniferous forest. Meteorological parameters including wind speed and direc-tion, temperature, pressure, relative humidity, and global ra-diation are measured at different levels above the ground, us-ing a 72-m-high mast on a permanent basis (Kulmala et al., 2001a). Gas measurements using the CIMS instrument pre-sented in this work have been performed from a container lo-cated in the vicinity of the SMEAR II station, i.e. 50 m south-west, at 2.5 m above the ground. The comparison of wa-ter vapor measurements obtained with the CIMS set up with the water vapor measured at the station (4.2 m) show excel-lent agreement (less than 5% disagreement). Thus our trace gas measurements can be considered to have taken place in the same air masses as the SMEAR II station measurements. Meteorological conditions together with aerosol size distri-butions over the measurement period are summarized Fig. 1. Data presented in this paper are based on samplings achieved during 12 days: from 17 to 29 March 2001. 2.2 Instrumental
The Chemical Ionization Mass Spectrometer (CIMS) method is based on ion-molecule reactions involving gaseous ions and atmospheric trace gas molecules. An atmospheric gas X which has a proton affinity larger than that of H2O
(166.5 kcal mol−1)reacts in the flow tube reactor with the
re-actant ions H3O+(H2O)n(produced by an external high fre-quency glow-discharge ion source) via:
H3O+(H2O)n+X → HX+(H2O)n+H2O (1)
The residence time in the flow tube reactor is 3.2 s, allow-ing some fraction of X to react durallow-ing travelallow-ing in the flow tube reactor. The X-concentration is determined. by mea-suring the abundance ratio of product and reactant ions. The scanning time for the mass range 1 to 200 amu is 40 ms.
Because the detection of organic gases with the CIMS technique used here allows only to determine the mass number of X, the exact chemical identification of X re-mains somewhat ambiguous (i.e. several different com-pounds might have the same mass), mixing ratios pre-sented in this work, namely acetone, DMA, TMA, iso-prene, MVK+MaCR, monoterpenes and MTOP are only the most likely candidates. In fact, at mass 68 amu+its hydrates, isoprene is detected together with another com-pound, which, from its daily variation, is probably from biogenic origin. Holzinger et al. (2005) have recently ob-served with the PTRMS technique some unidentified bio-genic compound above a pine forest at masses 105 amu, which could contribute to our isoprene mixing ratios when hydrated. Hence, Mass 68 amu and hydrates will be re-ferred to as isoprene+compound X. Detailed analytical pro-cedures, assumptions, calibrations and measurement prob-lems are discussed in Sellegri et al. (2005)
The routine measurements performed with commercial in-struments at the SMEAR II station such as the meteoro-logical data and CO concentrations are reported, as well as the measurements relevant to aerosol nucleation events performed as part of the QUEST campaign, such as total number concentrations, and Condensational Sink (CS, calcu-lated from the surface of particles available for condensation) (Kulmala et al., 2001b).
3 Results
3.1 Detected species relevant to particle nucleation in the boreal forest atmosphere
Isoprene and the sum of monoterpenes could be detected by CIMS, as well as, for the first time with this technique, some of their oxidation products with a 10 min resolution. We have to be cautious with isoprene+compound X concentrations, as the level of the mixing ratios and diurnal variations are not similar to what is usually found at the SMEAR II station for isoprene. MVK and MaCR, both oxidation products from isoprene, and pinonaldehyde (major oxidation product of α-pinene), and other monoterpene oxidation products (here-after referred as MTOP), were identified and measured with a 10 min resolution as well. Although monoteprenes, MTOP and MVK+MaCR calibrations could not be performed dur-ing the QUEST campaign, the CIMS instrument provides
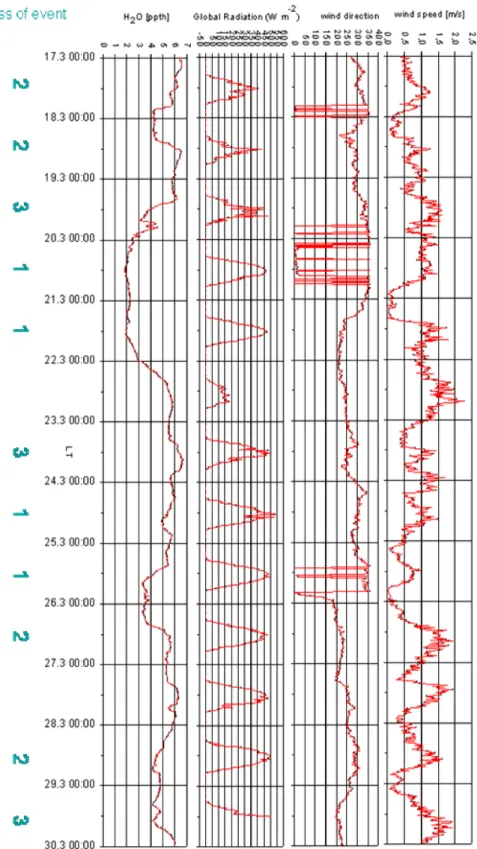
Fig. 1. Meteorological conditions (temperature, H2O, wind speed and direction, radiation) during the two weeks measurement period.
During this period, particle formation event occurred every day but on the 22 and 27 March. Particle formation events are classified into three classes according to their strength, with decreasing strength from 1 to 3.
CO smear 17.3.03 18.3.03 19.3.03 20.3.03 21.3.03 22.3.03 23.3.03 24.3.03 25.3.03 26.3.03 27.3.03 28.3.03 29.3.03 M ixi ng r ati o ( p p b ) 120 130 140 150 160 170 180 190 200 Acetone 0.00 0.00 0.00 0.00 0.00 0.00 0.00 0.00 0.00 0.00 0.00 0.00 0.00 M ix ing r ati o ( p p t) 500 1000 1500 2000 2500 3000 3500 4000 4500 MTOP
Local Time (winter)
17/3/03 18/3/03 19/3/03 20/3/03 21/3/03 22/3/03 23/3/03 24/3/03 25/3/03 26/3/03 27/3/03 28/3/03 29/3/03 M ix ing r at io ( p p t) 0 500 1000 1500 2000 2500 CS 17.3.03 18.3.03 19.3.03 20.3.03 21.3.03 22.3.03 23.3.03 24.3.03 25.3.03 26.3.03 27.3.03 28.3.03 29.3.03 CS (s -1) 0,000 0,002 0,004 0,006 0,008 0,010
High SO2 and NOx Clean nucleation event Clean nucleation event
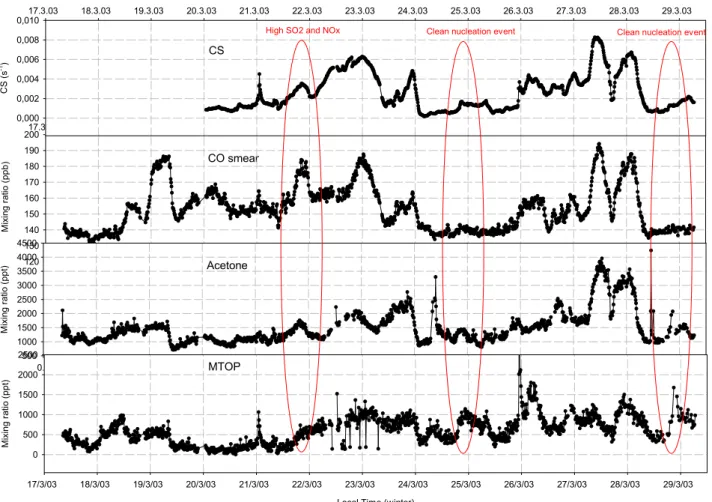
Fig. 2. Condensational sink (calculated from the surface of particles available for condensation), CO, acetone and MTOP versus local time. A co-variation is observed between most organic species (not all shown) and the condensational sink, in more or less agreement depending on the air mass type.
lower limits of mixing ratios (because all artifacts are lead-ing to an underestimation of the concentrations: wall losses, water content dependant back reactions, use of the collision rate reaction constant) (Sellegri et al., 2005).
Pinenes are among the most abundant monoterpenes, and isoprene, α-pinene and 13-carene were found to be the most abundant compounds among light hydrocarbon and monoter-pene in the boreal forest (Hakola et al., 2000; Spanke et al., 2001). Our concentrations during the QUEST campaign ranged between 90 and 185 pptv (25 and 75iles) for iso-prene+compound X, and 190 and 400 pptv for the sum of monoterpenes. Those concentrations are higher than pre-vious measurements on the same site for isoprene alone (Hakola et al., 2000; Spirig et al., 2004). The sum of monoterpenes has been detected above the boreal forest canopy with concentrations of 360 ppt (Spanke et al., 2001), which lies within the range of our measurements.
Ozonolysis of α- and β-pinene can give aerosol carbon yields of 14–18% and oxidation of α- and β-pinene by OH can give carbon yields of 40–60% (Hatakeyama et al., 1989
and 1991). According to the work of Yu et al. (1999), the ma-jor oxidation products of the reaction between O3and pinene
or carene are usually aldehydes (pinonaldehyde for α-pinene and caronaldehyde for carene), showing that they are good tracers for the oxidation product of terpenes. It is those alde-hydes which are detected by CIMS on mass 168 amu. Pinon-aldehyde has been detected in the gas and aerosol phase after introduction of pinene and O3in a smog chamber, showing
that it is a condensable gas (Yu et al. 1999, Kavouras et al., 1999). Although the partionning of pinonaldehyde is only 1% in the aerosol phase, this compound is also representative for the other terpene oxidation products which have lower va-por pressures and can not be detected by the CIMS method (mostly dicarboxylic acids, Gao et al., 2001). Moreover, MTOP mixing ratios measured by CIMS in Hyyti¨al¨a were in the range 320–840 pptv, hence it is the second most abun-dant compound family measured with CIMS after acetone (Sellegri et al., 2005). Pinonaldehyde has been measured on the Hyyti¨al¨a site with maximum concentrations of 140 ppt. Other monoterpene oxidation products may comprise a large
Acetone time 00 03 06 09 12 15 18 21 00 m ix ing ra tios ( ppt ) 800 1000 1200 1400 1600 1800 2000 2200 2400 2600 2800 TMA 00 03 06 09 12 15 18 21 00 0 20 40 60 80 100 120 140 Class 2 event Class 1 event Class 3 event non event H2O local time 00 03 06 09 12 15 18 21 00 m ix ing ra tios ( ppm ) 2000 3000 4000 5000 6000 7000 O3 time 00 03 06 09 12 15 18 21 00 32 34 36 38 40 42 44 46 48 CO time 00 03 06 09 12 15 18 21 00 m ix ing r at ios ( pp b) 130 140 150 160 170 180 190 Temperature local time 00 03 06 09 12 15 18 21 00 °C -8 -6 -4 -2 0 2 4 6 8 10 CS 00 03 06 09 12 15 18 21 00 co nden sa tio nal s ink ( s -1) 0,000 0,001 0,002 0,003 0,004 0,005 0,006 0,007 00 03 06 09 12 15 18 21 00 0 2000 4000 6000 8000 10000 12000 Particle number
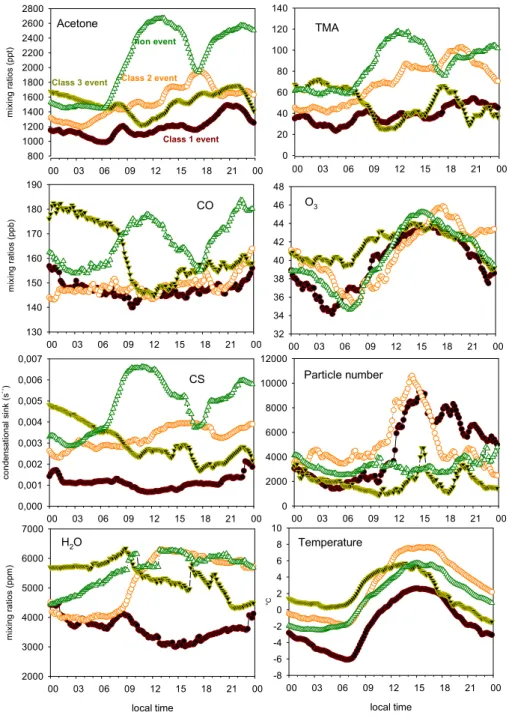
Fig. 3. Daily median concentrations of organic gases, ozone, H2O, particle number, and CS class1 event days (brown), class 2 (orange), class 3 ( yellow) and non-event days (green). The On non-event days, the condensational sink and most organic gases concentrations are higher than on event days.
part of the MTOP that we measured with our technique but also, it is a considerable advantage to measure them on-line, compared to the classic cartridge measurement type which might imply several pre-analysis artifacts. The sum of MVK+MaCR was measured with ratios varying between 100 and 240 pptv (25 and 75iles), in agreement with previous measurement performed on the Hyyti¨al¨a site (Hakola et al., 2003).
Dimethyl amine (DMA) and trimethyl amine (TMA) have also been found in atmospheric aerosols, and especially in aerosols with small sizes (Kulmala et al., 2001a; Sellegri, unpublished results). Thus they are integrated in the con-densed phase either by dry condensation, either by dissolu-tion in partially liquefied aerosols at higher relative humidity. DMA and TMA could be measured with CIMS for the first time. Vapor pressures for these two species are relatively
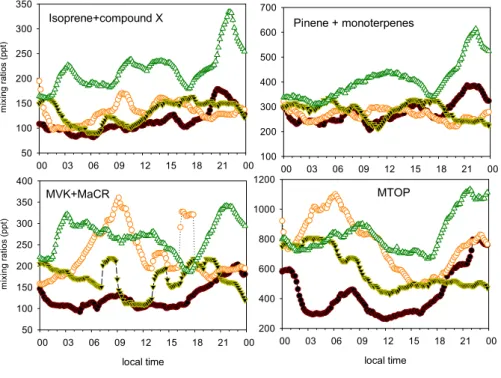
MTOP local time 00 03 06 09 12 15 18 21 00 200 400 600 800 1000 1200 MVK+MaCR local time 00 03 06 09 12 15 18 21 00 m ix ing r at ios ( ppt ) 50 100 150 200 250 300 350 400 Pinene + monoterpenes 00 03 06 09 12 15 18 21 00 100 200 300 400 500 600 700 Isoprene+compound X 00 03 06 09 12 15 18 21 00 m ix ing r at ios ( ppt ) 50 100 150 200 250 300 350 Fig. 3. Continued. MTOP/Monoterpenes local time 00: 00 03: 00 06: 00 09: 00 12: 00 15: 00 18: 00 21: 00 00: 00 ra tio s 0,0 0,5 1,0 1,5 2,0 2,5 3,0 3,5 4,0
Fig. 4. Daily median ratios and MTOP/monoterpenes during class 1 event days (black) and during all other cases (grey). Error bars are calculated from percentiles 25% and 75%. The ratios are in favor of the Monoterpenes Oxidation Products during class1 nucleation days compared to other cases.
high (respectively 203 and 215 kPa mol−1), hence their con-tribution to nucleation is unlikely. However, DMA and TMA are highly soluble; a wet deposition on aerosol surfaces is expected. DMA mixing ratios are below the detection limit of 32 pptv, and TMA mixing ratios vary between 34 and 80 pptv. Both compounds are either poorly produced or ef-ficiently removed from the boreal forest atmosphere. DMA and TMA are derivative of ammonia in which two or three of the hydrogen have been replaced by methyl groups. In the presence of TMA, measuring DMA mixing ratio lower than the detection limit would indicate that it has been pro-duced and destructed by an efficient sink. Although DMA
and TMA can not be excluded from condensing on newly formed particles during nucleation events, the low mixing ratios they showed during the campaign do not allow us to study further their times series.
4 Time series and median daily variations for event and non-event days
For a large time scale overview of the evolution of mixing ra-tios during the measurement campaign, we applied a 9 data point box smoothing procedure to the 10 min resolution mix-ing ratios, and plotted one representative of the biogenic ox-idation products (MTOP), together with acetone as a refer-ence of the CIMS technique, CO as an referrefer-ence of an inde-pendent gas measurement and the condensation sink (Fig. 2). The beginning of the measurement period is characterized by northern clean air masses, until 21 March (Fig. 1, and also air mass back trajectories, low CO, NO and NOx
lev-els, Keronen, P., personal communication). Particle forma-tion occurred every day under these clean-northern condi-tions (Period 1). West-Southern winds follow this period, with higher levels of pollution until the 23. Nucleation is not observed on the 22 and very weak on the 23 (Period 2). From the 23 to the 26, Northern winds favoring nucleation are observed again, similar to the Period 1, even though the air mass origin is West. On the 27, air masses are similar to the Period 2.
From 17 to 29 March, 10 nucleation events occurred (ev-ery day but for the 22 and 27 March). Nucleation events
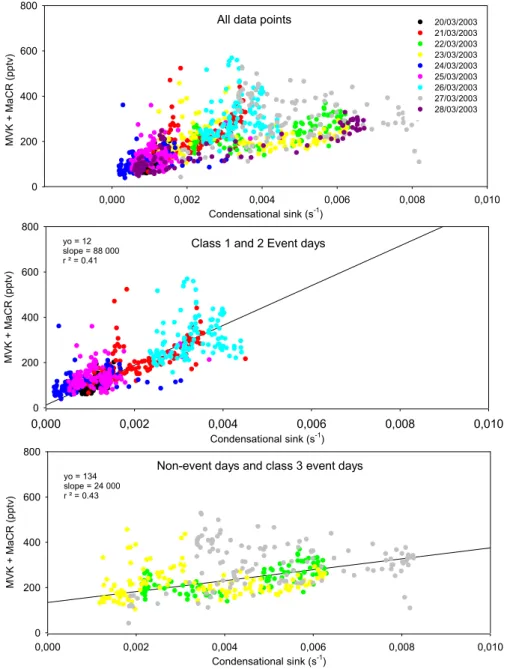
All data points Condensational sink (s-1) 0,000 0,002 0,004 0,006 0,008 0,010 MVK + Ma CR (p pt v) 0 200 400 600 800 20/03/2003 21/03/2003 22/03/2003 23/03/2003 24/03/2003 25/03/2003 26/03/2003 27/03/2003 28/03/2003
Class 1 and 2 Event days
Condensational sink (s-1) 0,000 0,002 0,004 0,006 0,008 0,010 MVK + Ma CR (p pt v) 0 200 400 600 800 yo = 12 slope = 88 000 r ² = 0.41
Non-event days and class 3 event days
Condensational sink (s-1) 0,000 0,002 0,004 0,006 0,008 0,010 MVK + Ma CR ( p pt v) 0 200 400 600 800 yo = 134 slope = 24 000 r ² = 0.43
Fig. 5. (a) Correlations between MVK+MaCR and the condensational sink for all data points (upper panel), for class 1 and class2 event days (middle panel), and for class 3 and non event days (lower panel). (b) Correlations between monoterpenes oxidation products (MTOP) and the condensational sink. For both oxidized organic compounds, correlations are significant on Class1+2 event days but not on class3 and non-event days (c) Correlations between CO and the condensational sink. Significant correlations are observed during non-event days.
were of various intensities and have been classified into three classes, from class 1 events (high intensity) to class 3 events (poor intensity) (Fig. 1, M. Dal Maso, personal communica-tion). A median daily variation is calculated for each of the event class and for non-event class (Fig. 3). 28 March was excluded, as part of the day was still non-event. On class 1 and class2 event days, we observe a steep increase of particle number (from 2000 to 10 000 # cm−3)due to nucleation from 10:00 to 14:00 (LT), followed by an increase of the CS gen-erally showing a maximum during the night. On non-event
days and class 3 event days, the total particle number stays rather stable (between 1000 and 4500 # cm−3). Going from class 1 to class 3, the mid-day peak of particle number is de-creasing, while for all cases (all class event and non-event), a secondary late evening-early night peak is observed with the similar intensities. On both event and non-event days, ozone has a very similar daily pattern. Class 1 event days are char-acterized by a lower amount of water vapor and a lower tem-perature than other classes of event days and than non-event days. Concentrations of all organic gases, as well as the CS,
All data points Condensational sink (s-1) 0,000 0,002 0,004 0,006 0,008 0,010 M o no te rp. Ox id . P ro d . (M TO P ) (ppt v) 500 1000 1500 2000 2500 3000
Class 1 and 2 event days
Condensational sink (s-1) 0,000 0,002 0,004 0,006 0,008 0,010 M ono terp . O xi d . P rod . (M TO P ) (p ptv ) 500 1000 1500 2000 2500 3000
Class 3 and non-event days
Condensational sink (s-1) 0,000 0,002 0,004 0,006 0,008 0,010 M ono te rp. Ox id . P ro d . (M TO P ) (ppt v) 500 1000 1500 2000 2500 3000 yo = 457 slope = 70 000 r ² = 0.25 yo=-74.2 a=185 000 r ²=0.62 yo=-21.3 a= 620 000 r ²=0.76 yo=-308 a=396 000 r ²=0.435 20/03/2003 21/03/2003 22/03/2003 23/03/2003 24/03/2003 25/03/2003 26/03/2003 27/03/2003 28/03/2003 Fig. 5b. Continued.
are higher on event days. In all cases (event and non-event days), acetone, isoprene, monoterpenes, MTOP and MVK+MaCR show the same pattern as the CS: a main night peak showing a maximum between 21:00 and midnight, and a mid-day peak, more or less pronounced and more or less early, depending on the species. For class 1, class 2 and class 3 event days, the dawn peak is emphasized for the terpene oxidation products (MVK+MaCR and MTOP).
Variations of MTOPs relative to their precursors can be studied (Fig. 4). On class 1 nucleation days, MTOPs are either less produced, or more condensing/destroyed on nu-cleation days as shown by the MTOP/Monoterpene ratios. Ratios between monoterpenes and their oxidation products
are in favor of the oxidation product on non-event days com-pared to the event days. This “depletion” of MTOP during class 1 nucleation days can be related to a higher light re-lated reactivity (class 1 event days are overall sunny, class 2, 3 and non event days are overall more cloudy, and for exam-ple pinonaldehyde has a higher OH reactivity compared to monoterpenes such as pinene, Glasius et al., 1997). But also, the “depletion” of MTOP could indicate that, in comparison to the non-condensing terpenes, their sink by condensation is higher on class 1 nucleation days.
All data points Condensational sink (s-1) 0,000 0,002 0,004 0,006 0,008 0,010 CO (p pbv) 130 140 150 160 170 180 190 200 200303 210303 220303 230303 240303 250303 260303 270303 280303
Class 1 and 2 event days
Condensational sink (s-1) 0,000 0,002 0,004 0,006 0,008 0,010 CO ( ppb v) 140 160 180 200
Class 3 and non-event days
Condensational sink (s-1) 0,000 0,002 0,004 0,006 0,008 0,010 CO ( ppb v) 130 140 150 160 170 180 190 200 yo = 135 slope = 6 700 r ² = 0.85 yo = 130 slope = 4 200 r ² = 0.28 Fig. 5c. Continued.
4.1 Correlations during event and non-event days
We mentioned in the previous section that both VOCs and the CS had a similar daily pattern. Covariance of VOC mixing ratios and CS could indicate a possible cause-to-consequence link between VOCs and CS variations, i.e. VOCs are likely to condense on nucleated particle and participate to their growth to sizes relevant for CCN and radiative properties. If this is the case, obviously, the organics measured by CIMS are not consumed efficiently by the condensation process, although it is difficult to conclude on the sink without estimating what the source term of these compounds are. In order to over-come this problem, we will hereafter study the event to non-event correlations between VOC and the condensational sink.
Day by day correlation plots (Figs. 5a to c) show that the organic-to-CS ratio for class 1 and 2 event days is very dif-ferent from the non-event and poor event days (class 3) ratio. While the MTOP mixing ratios show little variations with CS changes during non-event days, the increase MTOP/CS is 3 to 4 times higher for the event days. During clean event days, concentrations of oxidized organics significantly increase in parallel to the growth of particles freshly nucleated. Marti et al. (1997) have previously found that calculated oxidized organics were correlated to the CS in a remote continental site. MVK+MaCR, is also increasing with the condensa-tional sink. It is interesting to note that for the 28 March, for which part of the day has the same characteristics as the
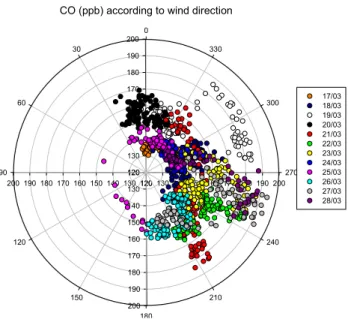
CO (ppb) according to wind direction 120 130 140 150 160 170 180 190 200 120 130 140 150 160 170 180 190 200 120 130 140 150 160 170 180 190 200 120 130 140 150 160 170 180 190 200 0 30 60 90 120 150 180 210 240 270 300 330 17/03 18/03 19/03 20/03 21/03 22/03 23/03 24/03 25/03 26/03 27/03 28/03
Fig. 6. CO mixing ratios as a function of wind direction.
non-event 27 March and the other part of the day has the same characteristics as the 29 (event), MTOP/CS shows a mixture of event and non-event behavior (Fig. 5b). Although the representatives of oxidized organics are measured with atmospheric mixing ratios lower during event days than non-event days, their ratio to the condensational sink are higher on event days. Hence oxidized organics are, relatively to the condensing surface available, 1) more abundant on nu-cleation days and 2) increasing as the condensational sink is increasing (i.e. as the particles grow).
CO mixing ratios are also correlated to the condensational sink (Fig. 5c). However, we observe that CO is poorly linked to the CS increase on clean nucleation day (except on the the 21 March, which was more polluted), while it is significantly correlated to the CS non event days. Higher mixing ratios of CO are advected at the same time than the large accumulation mode representative of more polluted air masses.
On polluted nucleation events, both CO and oxidized bio-genic organics seemed to be responsible for the increase of the condensational sink (on the 21, 26). Oxidation products of terpenes have been previously found to be correlated to CO above a pine plantation (Spaulding et al., 2003) and 40% of the estimated total emission of CO from the oxidation of natural hydrocarbons is accounted by oxidation of terpenes (Hatakeyama et al., 1991). However, the oxidation of bio-genic organics would be very large in order to explain sev-eral tens of ppb of CO. Hence the influence of the dynamics of the atmosphere is more likely. This is confirmed by the fact that high CO levels observed on the 21 and 26 are found for south-eastern wind, probably representative of local pol-lution (Fig. 6).
On Fig. 7, oxidized oragnics/CS ratio daily variation are shown for class 1 and 2 events on one hand, and class 3
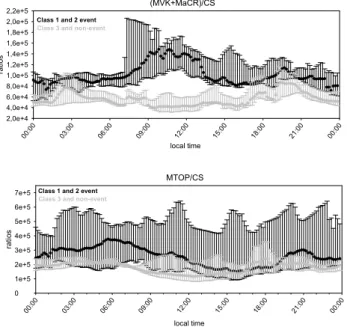
and non-event days on another hand. The MTOP/CS ra-tio is rather stable through the diurnal variara-tion and night-time maxima are not observed; there is a tendency of an early morning to mid-day increase of MVK+MaCR/CS dur-ing event days.
5 Discussion
Results from the BIOFOR campaign (BIOgeic aerosol FOR-mation in the boreal forest), which took place on the Hyyti¨al¨a sampling site during spring in the years 1998 and 1999 gave little support for the hypothesis that terpene oxidation prod-ucts were the precursors to the observed new particle for-mation. They were however not excluded from taking an active part in the growth of the new particles (Janson et al. 2001). The reasons for these conclusions were that (1) SOC (Secondary Organic compounds) were higher at night when no nucleation occurred, and (2) SOC were not significantly higher during event days compared to non-event days.
There are similarities and discrepancies between our data set and the data set from the BIOFOR campaign:
– Mixing ratios were of similar order of magnitude during
both field measurement campaigns
– In both field measurement campaigns terpenes and their
oxidation products have been found to be higher at night with a maximum between 21:00 and midnight.
– While a poorly significant enhancement of
monoter-penes and of the calculated source terms for secondary organic compounds were found during event days com-pared to non-event days during BIOFOR, our QUEST data revealed an enhancement of organic compounds including terpenes during non-event days compared to event days.
Together with the fact that a strong correlation is found be-tween the CS and biogenic organic compounds, our observa-tions would lead to the same conclusion as during BIOFOR: a condensing rather than nucleating role of organics.
However, the parameter SOC/CS might be of higher sig-nificance to the nucleation processes than the SOC mixing ratio alone. Then, based on the fact that the SOC/CS ra-tios are higher on event days than on non-event days, and that monoterpene oxidation products measured by CIMS are representative of SOC of lower vapor pressure (hence not detected by CIMS, i.e. diacids), we can not exclude organ-ics from being candidates for the new particle formation. Actually, among the MTOPs measured with CIMS, some have a relatively low vapor pressure. For example, pinon-aldehyde has a vapor pressure of 4.4×10⁻²kPa at 25◦C, to be compared with the 2.7×10⁻⁶ at 25◦C of sulfuric acid. Since MTOP were found with mixing ratios up to 104higher than sulfuric acid mixing ratios (between 40 and
MTOP/CS local time 00: 00 03:0 0 06: 00 09:0 0 12: 00 15:0 0 18: 00 21:0 0 00: 00 ra tio s 0 1e+5 2e+5 3e+5 4e+5 5e+5 6e+5 7e+5 (MVK+MaCR)/CS local time 00: 00 03: 00 06: 00 09:0 0 12: 00 15:0 0 18: 00 21:0 0 00: 00 ra tio s 2,0e+4 4,0e+4 6,0e+4 8,0e+4 1,0e+5 1,2e+5 1,4e+5 1,6e+5 1,8e+5 2,0e+5 2,2e+5
Class 1 and 2 event
Class 3 and non-event
Class 1 and 2 event
Class 3 and non-event
Fig. 7. Daily median ratios (MVK+MaCR)/CS (upper panel) and MTOP/CS (lower panel) during class 1 and 2 event days (black) and class 3 and non-event days (grey). Error bars are calculated from percentiles 25% and 75%. The ratio of MVK+MaCR to the condensational sink is higher on class 1 and 2 event days, and max-imum during the day.
600 ppq (10−15mol mol−1), F. Arnold, personal communica-tion), and pinonaldehyde is the most abundant representative of MTOP, it is probable that it condenses at a some stage of particle formation. In fact, the comparison of TOP/CS be-havior between MVK+MaCR and MTOP shows a difference that could be due to an additional sink by condensation for the MTOP, compared to MVK+MaCR. Indeed, correlation plot for event days of MTOP vs. CS show negative MTOP mixing ratios when extrapoling to low CS, which could be an indication of the condensing process at the very early stage of particle formation.
6 Summary and conclusions
Measurements of volatile organic gases were performed with a 10 min resolution in the boreal forest atmosphere, using a ground-based CIMS instrument, as part of the QUEST project. Acetone, TMA, DMA, isoprene, monoterpenes, MVK+MaCR and pinonaldehyde were selected to study the relationship between biogenic gaseous emissions and nucle-ation and growth of new particles.
Isoprene+compound X, monoterpenes, MVK+MaCR and MTOP are measured with a higher mixing ratio at night than during the day (maximum between 21:00 and midnight). The onset of a nocturnal stable surface layer is presumably trap-ping the night-produced VOCs (but also acetone and CO). These five biogenic organic species show more or less
signif-icant correlation with the condensational sink (CS) depend-ing on the type of nucleation event, indicatdepend-ing that particle growth is probably not always due to the same species de-pending on the air mass type.
Best correlations are observed for the oxidized bio-genic compounds (MTOP and MVK+MaCR). MTOP and MVK+MaCR are significantly correlated to the CS on event days while not during non event days. Mixing ratios of MTOP increase with CS by a factor 3 to 4 compared to non-event days. Moreover, the ratio of oxidized biogenic organics to the CS is higher on event days than on non-event days. If the amount of condensing gas, corrected from the condens-ing surface available is indicative of the probability of nucle-ation, then this probability is higher on nucleation days.
Correlations are also observed between CO and the CS, but on non-event days, indicating an advection of both high CO mixing ratios and a large accumulation mode (with high CS) representative of polluted air masses.
As a whole, the sum of the MTOP analyzed with the CIMS method is not consumed efficiently by the condensation pro-cess, i.e. their source is higher than their sink. However, the MTOP mixing ratios measured by CIMS in Hyyti¨al¨a were in the range 320–840 pptv, which makes MTOP the second most abundant compounds measured with CIMS after ace-tone, and, considering the low vapor pressure of some of them (such as pinonaldehyde), possible candidates for con-densation at an early stage of the new particles formation.
Amines were measured with the lowest mixing ratios, pre-sumably because of their high solubility and high reactivity. The low concentrations of DMA and TMA prevented us from a reliable daily variability study and work must be continued to lower the detection limit of such species with the CIMS method.
Acknowledgements. This work was financed by the QUEST
project, funded by the European Community. The authors wish to thank R. Janson for fruitful discussions.
Edited by: K. H¨ameri
References
Gao, S., Hegg, D. A., Frick, G., Caffrey, P. F., Pasternack, L., Cantrell, C., Sullivan, W., Ambrusko, J., Albrechcinski, T., and Kirchstetter, T. W.: Experimental and modeling studies of sec-ondary organic aerosol formation and some applications to the marine boundary layer, J. Geophys. Res., 106, 27 619–27 634, 2001.
Glasius, M., Calogirou, A., Jensen, N. R., Hjorth, J., and Nielsen, C. J.: Kinetic study of gas-phase reactions of pinonaldehyde and structurally related compounds, Int. J. Chem. Kin., 29, 527–533, 1997.
Griffin, R. J., Cocker, D. R., Flagan, R. C., and Seinfeld, J. H.: Organic aerosol formation from the oxidation of biogenic hydro-carbon, J. Geophys. Res., 104, 3555–3568, 1999.
Hakola, H., Laurina, T., Rinne, J., and Puhto, K.: The ambient con-centrations of biogenic hydrocarbons at a northern European, bo-real site, Atmos. Environ., 34, 4971–4982, 2000.
Hakola, H., Tarvainen, V., Laurina, T., Hiltunen, V., Hellen, H., and Keronen, P.: Seasonal variation of VOC concentrations above a boreal coniferous forest, Atmos. Environ., 37, 1623–1634, 2003. Hatakeyama, S., Izumi, K., Fukuyama, T., and Akimoto, H.: Re-actions of ozone with α-pinene and β-pinene in air: Yields of gaseous and particulate products, J. Geophys. Res., 94, 13 013– 13 024, 1989.
Hatakeyama, S., Izumi, K., Fukuyama, T., Akimoto, H., and Washida, N.: Reactions of OH with α-pinene and β-pinene in air: Estimate of global CO production from the atmospheric ox-idatoin of terpenes, J. Geophys. Res., 96, 947–958, 1991. Hoffman, T., Bandur, R., Marggraf, U., and Lindsheid, M.:
Molec-ular composition of organic aerosols formed in the α-pinene/O3
reaction: Implications for new particle formation process, J. Geo-phys. Res., 103, 25 569–26 578, 1998.
Holzinger, R., Lee, A., Paw, K. T., and Goldstein, A. H.: Observa-tion of oxidaObserva-tion products above a forest imply biogenic emis-sions of very reactive compound, Atmos. Chem. Phys., 5, 67–75, 2005,
SRef-ID: 1680-7324/acp/2005-5-67.
Janson, R., Rosman, K., Karlsson, A., and Hansson, H. C.: Bio-genic emissions and gaseous precursors to forest aerosols, Tellus B, 53, 423–440, 2001.
Kavouras, I., Mihalopoulos, N., and Stephanou, E.: Secondary or-ganic aerosol formation vs primary oror-ganic aerosol emission: In situ evidence for the chemical coupling between monoterpene acidic photooxidation products and new particle formation over forests, Envir. Sci. Technol., 33, 1028–1037, 1999.
Koch, S., Winterhalter, R., Uherek, E., Kolloff, A., Neeb, P., and Moortgat, G.: Formation of new particles in the gas-phase ozonolysis of monoterpenes, Atmos. Environ., 34, 4031–4042, 2000.
Korhonen, P., Kulmala, M., Laaksonen, A., Viisanen, Y., McGraw, R., and Seinfeld, J. H.: Ternary nucleation of H2SO4, NH3, and H2O in the atmosphere, J. Geophys. Res., 104, 26 349–26 353, 1999.
Kulmala, M., Hameri, K., Aalto, P. P., Makela, J. M., Pirjola, L., Nilsson, D., Buzorius, G., Rannik, U., Dal Maso, M., Seidl, W., Hoffman, T., Janson, R., Hansson, H.-C., Viisanen, Y., Laakso-nen, A., and O’Dowd, C.: Overview of the international project on biogenic aerosol formation in the boreal forest (BIOFOR), Tellus 53B, 324–343, 2001a.
Kulmala, M., Dal Maso, M., Makela, J. M., Pirjola, L., Vakeva, M., Aalto, P., Miikkulainen, P., Hameri, K., and O’Dowd, C. D.: On the formation, growth and composition of nucleation mode particles, Tellus 53B, 479–490, 2001b.
Leaitch, W. R., Bottenheim, J. W., Biesenthal, T. A., Li, S. M., Liu, P. S. K., Asalian, K., Dryfhout-Clark, H., Hopper, F., and Brech-tel, F.: A case study of gas-to-particle conversion in an eastern Canadian forest, J. Geophys. Res., 104, 8095–8111, 1999. Marti, J. J., Weber, R. J., McMurry, P. H., Eisele, F., Tanner, D., and
Jefferson, A.: New particle formation at a remote continental site: assessing the contributions of SO2and organic precursors,
J. Geophys. Res., 102, 6331–6339, 1997.
Murphy, D. M., Thomson, D. S., and Mahoney, M. J.: In situ mea-surements of organics, meteoritic material, mercury, and other elements in aerosols at 5 to 19 kilometers, Science, 282, 1664– 1669, 1998.
Novakov, T., Hegg, D. A., and Hobbs, P. V.: Airborne measure-ments of carbonaceous aerosols on the East Coast of the United States, J. Geophys. Res., 102 (D25), 30 023–30 030, 1997. Sellegri, K., Laj, P., Peron, F., Dupuy, R., Legrand, M.,
Pre-unkert, S., Putaud, J.-P., Cachier, H., and Ghermandi, G.: Mass balance of winter time free tropospheric aerosol at the Puy de Dˆome (France), J. Geophys. Res., 108, D11, 4333, doi:10.1029/2002JD002747, 2003.
Sellegri, K., Umann, B., Hanke, M., and Arnold, F.: Deployment of a ground-based CIMS apparatus for the detection of organic gases in the boreal forest during the QUEST campaign, Atmos. Chem. Phys., 5, 357–372, 2005,
SRef-ID: 1680-7324/acp/2005-5-357.
Spanke, J., Rannik, U., Forkel, R., Nigge, W., and Hoffman, T.: Emission fluxes and atmospheric degradation of monoterpenes above a boreal forest: field measurements and modeling, Tellus, 53B, 406–422, 2001.
Spaulding, R. S., Schade, G. W., Goldstein, A. H., and Charles, M. J.: Characterization of secondary atmospheric photooxidation products: Evidence for biogenic and anthropogenic sources, J. Geophys. Res., 108, D8, doi:10.1029/2002JD002478, 2003. Spirig, C., Guenther, A., Greenberg, J. P., Calanca, P., and
Tar-vainen, V.: Tethered balloon measurements of volatile organic compounds at a boreal forest site, Atmos. Chem. Phys., 4, 215– 229, 2004,
SRef-ID: 1680-7324/acp/2004-4-215.
Williams, J., Fisher, H., Harris, G. W., Crutzen, P. J., Hoor, P., Hansel, A., Holzinger, R., Warneke, C., Lindinger, W., Scheeren, B., and Lelieveld, J.: Variability-lifetime relationship for organic trace gases: a novel aid to compound identification and estima-tion of OH concentraestima-tions, J. Geophys. Res., 105, 20 473–20 486, 2000.
Yu, J., Cocker III, D. R., Griffin, R. J., Flagan, R. C., and Seinfeld, J. H.: Gas-phase ozone oxidation of monoterpenes: gaseous and particulate products, J. Atmos. Chem., 34, 207–258, 1999.