HAL Id: hal-00136210
https://hal.archives-ouvertes.fr/hal-00136210
Submitted on 15 Mar 2007
HAL is a multi-disciplinary open access
archive for the deposit and dissemination of
sci-entific research documents, whether they are
pub-lished or not. The documents may come from
teaching and research institutions in France or
abroad, or from public or private research centers.
L’archive ouverte pluridisciplinaire HAL, est
destinée au dépôt et à la diffusion de documents
scientifiques de niveau recherche, publiés ou non,
émanant des établissements d’enseignement et de
recherche français ou étrangers, des laboratoires
publics ou privés.
The circumstellar envelope of IRC+10216 from
milli-arcsecond to arcmin scales
I.C. Leao, Patrick de Laverny, D. Mekarnia, J.R. de Medeiros, Benoit
Vandame
To cite this version:
I.C. Leao, Patrick de Laverny, D. Mekarnia, J.R. de Medeiros, Benoit Vandame. The circumstellar
envelope of IRC+10216 from milli-arcsecond to arcmin scales. Astronomy and Astrophysics - A&A,
EDP Sciences, 2006, 455, pp.187. �hal-00136210�
hal-00136210, version 1 - 15 Mar 2007
Astronomy & Astrophysicsmanuscript no. Leao˙irc10216˙referee.hyper28278 c ESO 2007
March 15, 2007
The circumstellar envelope of IRC+10216 from milli-arcsecond to
arcmin scales
⋆
I.C. Le˜ao
1,2, P. de Laverny
1, D. M´ekarnia
1, J.R. De Medeiros
2, and B. Vandame
31 Observatoire de la Cˆote d’Azur, Dpt Cassiop´ee, CNRS - UMR 6202, BP 4229, 06304 Nice Cedex 4, France
e-mail: [leao;laverny;mekarnia]@obs-nice.fr
2 Departamento de F´isica, Universidade Federal do Rio Grande do Norte, 59072-970 Natal, RN, Brazil 3 European Southern Observatory, Karl-Schwarzschild-Str. 2, D–85748 Garching b. M¨unchen, Germany
Received 23 November 2005 / Accepted 15 January 2006
ABSTRACT
Aims.Analysis of the innermost regions of the carbon-rich star IRC+10216 and of the outer layers of its circumstellar envelope have been performed in order to constrain its mass-loss history.
Methods.High dynamic range near infrared adaptive optics and high angular resolution deep V-band images of its circumstellar envelope collected with VLT/NACO and VLT/FORS1 instruments have been analyzed.
Results.Maps of the sub-arcsecond structures, or clumps, in the innermost regions are derived from the near-infrared observations. The morphology of these clumps is found to strongly vary from J- to L-band. Their relative motion appears to be more complex than proposed in earlier works: they can be weakly accelerated, have a constant velocity, or even be motionless with respect to one another. From V-band imaging, a high spatial resolution map of the shell distribution in the outer layers of IRC+10216 is presented. Shells are well resolved up to a distance of about 90′′
to the core of the nebula and most of them appear to be composed of thinner elongated shells. Finally, by combining the NACO and FORS1 images, a global view, showing both the extended layers and the bipolar core of the nebula together with the real size of the inner clumps is presented.
Conclusions. This study confirms the rather complex nature of the IRC+10216 circumstellar environment. In particular, the coexistence at different spatial scales of structures with very different morphologies (clumps, bipolarity and almost spherical external layers) is very puzzling. This confirms that the formation of AGB winds is far more complex than usually assumed in current models.
Key words.stars: AGB and post-AGB – stars: variables: general – stars: individual: IRC+10216 – stars: mass-loss – stars: circumstellar matter – techniques: high angular resolution
1. Introduction
Low- and intermediate-mass stars lose a large amount of their initial mass when they evolve along the Asymptotic Giant Branch (AGB) and beyond. During these mass-loss events, a huge circumstellar envelope (CSE) is formed. IRC+10216 is the best-known example of such evolved stars with an optically thick CSE. Indeed, its envelope almost completely absorbs the central stellar photons in visible light and at shorter wave-lengths. This circumstellar environment has therefore been mostly studied in the infrared and millimeter domains, spec-tral regions where the envelope radiates itself and scatters the stellar light.
At very small scales (arcsec and below), a detailed picture of the IRC+10216 central regions has already been presented ⋆ Based on observations collected with the VLT/Antu and Yepun
telescopes (Paranal Observatory, ESO, Chile) using the FORS1 and NACO instruments (programs ID 63.I-0177A, 0565A, 70.C-0271B, 70.D-0271B).
by several groups (see e.g. Haniff & Buscher 1998; Weigelt et al. 1998, 2002; Tuthill et al. 2000, 2005). The central core ap-pears to be composed of a series of clumps whose positions and luminosities vary on time-scales of a few years. The com-plexity of the structures detected has led to several hypotheses regarding the precise location of the central star.
At much larger scales (up to arcmin), Mauron & Huggins (1999, 2000, MH99-00 hereafter) have shown that the IRC+10216 CSE can also be studied in visible wavelength if enough deep images are collected. The nebula brightness then results from galactic ambient light scattered by its dust parti-cles. It is detected up to very large distances to the central star (up to about 6 000 stellar radii) and thus carries information about the mass-loss history during the last few thousand years. MH99-00 have also shown that this fairly round circumstel-lar envelope is consistent with an isotropic galactic radiation field and a spherically symmetric dust shell (see also Mauron et al. 2003). However, on a better spatial resolution (∼ 1 arcsec), the envelope consists of a series of discrete and nested
multi-ple shells (or arclets) whose origin is still debated. Although IRC+10216 is the only known AGB with such shells, similar morphology has already been detected around a dozen of plane-tary nebulae (PN) and about six proto-planeplane-tary nebulae (PPN). However, all these PN and PPN are bipolar, contrary to what we observe for their progenitor (assuming that IRC+10216 CSE properties are common for AGB stars). The cause and occur-rence of the transition from a spherical multiple-shell CSE to a bipolar one is crucial for the understanding of the mass-loss phenomenon on the AGB and the evolution of the material ejected into the interstellar environment.
To date, no global view of the morphology of the IRC+10216 CSE at different scales exists. The aim of this work is to provide such a global description by combining new high dynamic and high spatial resolution images of its innermost re-gions collected with adaptive optics techniques together with new deep images of its most external layers. These observa-tions are presented in Sect. 2. We analyze in Sect. 3 the mor-phology of the innermost regions and their temporal variations. Sect. 4 is devoted to the analysis of the numerous shells found in this envelope and to some of their properties. We then dis-cuss, in Sect. 5, the coexistence of the different morphologies found in the CSE of IRC+10216. Finally, a conclusion is pre-sented in Sect. 6.
2. Observations and reductions
2.1. NACO observations
Infrared images of IRC+10216 were recovered from ESO Science Archive Facility. They were obtained in November 2002 and March 2003, using the adaptive optics system NACO at the ESO/VLT Yepun telescope. NACO is an association of the adaptive optics system NAOS (Rousset 2000) and the spectro-imager CONICA (Lenzen 2003).
We have recovered observations of IRC+10216 obtained
with the narrow-band filters NB 1.24 (centered at λc =
1.237 µm, ∆λ = 0.015 µm), NB 1.26 (λc = 1.257 µm, ∆λ =
0.014 µm), NB 1.64 (λc= 1.644 µm, ∆λ = 0.018 µm), NB 1.75
(λc= 1.748 µm, ∆λ = 0.026 µm), NB 2.17 (λc= 2.166 µm,
∆λ = 0.023 µm) and the broad-band filter L′(λ
c= 3.80 µm,
∆λ = 0.62 µm). The pixel scale on CONICA was respectively
13.27 mas in the narrow-band filters and 27.15 mas in the L′
fil-ter. Observation conditions, as well as total on-source integra-tion time for each filter, are summarized in Tab. 1. Calibraintegra-tion files (flat fields and dark exposures) and observations of the PSF reference star HR 3550 were also recovered. The Jitter
technique was used in all observations. The box size of the L′
broad-band image was about 7′′×7′′, and the box sizes in the
narrow-band images varied between about 4′′×4′′and 7′′×7′′.
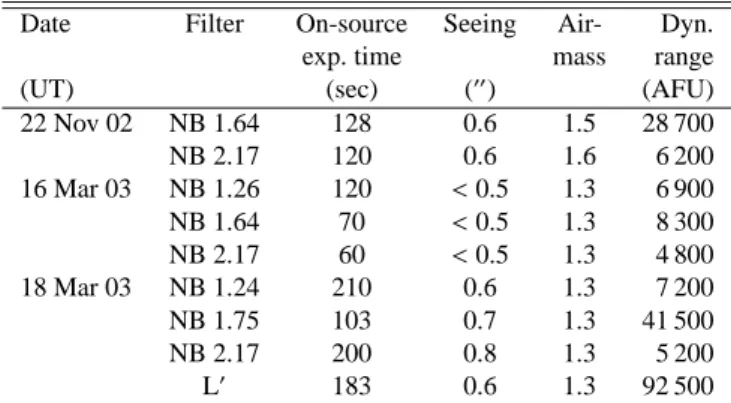
As shown in Tab. 1, the seeing conditions were variable,
rang-ing between about 0.5′′and 0.8′′. The best dynamic ranges of
the IRC+10216 final images (not deconvolved) were around 7 000, 40 000, 6 000 and 90 000 AFU (Arbitrary Flux Units) for the J, H, K and L bands, respectively. The noise level was found to be smaller than 30 AFU in all images. In the PSF
observations, the seeing varied between 0.5′′and 0.6′′and the
air-masses between about 1.3 and 1.4. The estimated FWHM
Table 1. NACO observations log of IRC+10216.
Date Filter On-source Seeing Air- Dyn. exp. time mass range (UT) (sec) (′′) (AFU)
22 Nov 02 NB 1.64 128 0.6 1.5 28 700 NB 2.17 120 0.6 1.6 6 200 16 Mar 03 NB 1.26 120 <0.5 1.3 6 900 NB 1.64 70 <0.5 1.3 8 300 NB 2.17 60 <0.5 1.3 4 800 18 Mar 03 NB 1.24 210 0.6 1.3 7 200 NB 1.75 103 0.7 1.3 41 500 NB 2.17 200 0.8 1.3 5 200 L′ 183 0.6 1.3 92 500
of the PSF star was around 70 mas in the J and H bands, 80 mas in the K-band and 120 mas in the L-band.
Standard reduction procedures were applied using self-developed routines. The raw images were sky subtracted, then divided by the flat-field and corrected from hot pixels. In each filter, the images were cross-correlated and aligned by sub-pixel shifting, and then combined to produce the final images, eliminating cosmic rays hits. Finally, they were deconvolved with the PSF reference star. We used the Richardson-Lucy al-gorithm (Richardson 1972; Lucy 1974). Since no PSF data for IRC+10216 were found in the November 22, 2002 observa-tions, we have developed for that night pseudo-PSF images, by analyzing and comparing the other IRC+10216 observa-tions with their corresponding PSF data. Constancy of promi-nent features present in deconvolved images showed that the PSF selection and the number of iterations (25 typically) for the deconvolution process was performed carefully and con-servatively. We have then summed the deconvolved images in each band (see Fig. 1). The highest dynamic range J-band im-age was obtained from the 1.24µm and 1.26µm imim-ages, which leads to about 14 000 AFU. For the H-band, we have summed both 1.64µm and 1.75µm narrow-band images, obtaining a dy-namic range of about 78 000 AFU. The three 2.17µm narrow-band images were combined to build a K-narrow-band image (∼ 16 000 AFU). Finally, the L-band image has about 92 000 AFU. These images have thus the best dynamical range ever published (see e.g. Tuthill et al. 2005). We note that, over the interval of about 4 months between the first and last observations studied here, no clear variations of the positions of the structures were found.
2.2. FORS1 observations
The observations were collected with the VLT-Antu telescope, equipped with the FORS1 focal reducer. The detector is a 2048×2048 thinned 24 µm pixel Tektronix chip. The field of
view of individual images is 6.8′×6.8′ with a pixel size of
0.2 arcsec (see Appenzeller et al. 1998). All the exposures were acquired in standard FORS1 service mode using a classical Bessel V-band filter. The available data consists of eight 10-min exposure and two 20-10-min exposure frames collected from 10 to 11 January, 2000, leading to a total observing time of 2 hours. The selected exposures were taken in dark time under
I.C. Le˜ao et al.: The CSE of IRC+10216 from milli-arcsecond to arcmin scales 3
very good seeing conditions and photometric sky. A few other 10-min frames were indeed rejected due to their moderate see-ing conditions. The mean airmass was 1.3. The telescope was shifted by a few arcseconds between each individual image.
It was found that individual images reduced by the stan-dard ESO reduction pipeline (which includes stanstan-dard correc-tions such as bias subtraction, flat fielding, etc., see Hanuschik & Amico 2000) were of rather poor quality. We suspect this was due to the use of a corrupted flat field. Therefore, a new re-duction procedure was performed for all individual exposures (removal of cosmic and aberrant pixels, flat-fielding with a spe-cific mean sky flat for each night, etc.). All exposures taken on the same night were then shifted and stacked. The final re-duced image was built by adding the summed exposures col-lected during the same night, taking into account of their re-spective total exposure time. It consists of 1900 × 1900 pixels
corresponding to a total field of view of 6.3′×6.3′. The
re-sulting mean seeing, measured from the brightness profile of
individual stars, is found to be around 0.65′′. The central core
of IRC+10216 is measured with a S/N ratio larger than 100
per pixel and the S/N of the envelope at 20′′from the center is
around 5-6 per pixel. For a more detailed description of this re-duction procedure see Vandame (2002), and a preliminary pre-sentation of this image can be found in de Laverny (2003). Due to the wide field of this image, we have estimated a PSF refer-ence by using the median average of a set of suitable point-like stars, that have been, firstly, background-subtracted, centered with sub-pixel accuracy and normalized. The final FORS1 im-age (see Sect. 4) has been deconvolved using a Richardson-Lucy algorithm (Richardson 1972; Richardson-Lucy 1974). This procedure has slightly improved the spatial resolution (to less than about
0.6′′) and the S/N ratio (to about 7-8 per pixel at 20′′from the
center).
3. The CSE innermost regions
The JHKL diffraction-limited images of IRC+10216 are dis-played in Fig. 1 with a log-scale for the brightness, so that details of the morphology at all flux levels can be seen. The labels A to D shown in the H-band image indicate the features identified and labeled by Haniff & Buscher (1998). The im-ages have been centered at the central star location estimated by Murakawa et al. (2005). These authors have performed a polarimetric study of IRC+10216 in H-band which has inde-pendently provided a possible central star position, after series of contradictory hypothesis (see Weigelt et al. 2002 and Tuthill et al. 2005). Following Murakawa et al. (2005), we have used clump A as reference to identify the central star position. We note that their observations were made at the same epoch as the images presented here.
3.1. Morphology at different wavelengths
The images exhibit a bright and inhomogeneous structure which roughly looks like a ring (with a diameter of
approxi-mately 0.5′′) composed of clumps (including clumps A to D)
around an approximately circular depression. The depression
is located at about (0.15, 0.15)′′from the image center and has
about 6% of the intensity peak. Clumps A and C are the bright-est features. Clump B appears as an elongated feature, at about the NE direction from clump C, and clump D seems to be a more spread out feature. In addition, there is a faint and almost
spherical extended envelope (from ∼ 0.5′′to more than 1′′from
the image center), which also appears to have its center in the ring depression. This depression could thus correspond to an apparent center of the images. Regarding the central star, it is located in the fainter SE region of the mentioned ring. Its po-sition also coincides with a particular elongation in the ring brightness distribution, well seen in the H-band image. Finally, we have verified that the faintest structures seen in the J-band are ghosts, probably due to the light reflected in the NACO op-tics.
On another hand, a clear difference between the JHKL im-ages concerns the brightness variations of clumps A to D with respect to the images peaks. Clump A remains close to the in-tensity peak in all bands whereas clumps B and D are brighter at larger wavelengths (from about 10% and 20%, respectively, of the intensity peak in J to about 100% in L). The bright-ness of clump C increases more slightly and is always brighter than 80%. We also note that the brightness difference between the four clumps strongly decreases with increasing wavelength. The SE region of the ring, close to the assumed location of the central star, remains faint, varying from about 8% to 20% of the intensity peak from J to L. Finally, the extent of the ex-ternal envelope seems to decrease with increasing wavelength. Considering its limits at 0.2% of the image peak brightness, we
have calculated its mean extent as being about 4.8′′, 3.5′′, 2.7′′
and 2.0′′in the J-, H-, K- and L-band, respectively.
The clump brightness variations as well as the extent of the envelope at different wavelengths may reveal that we mostly detect, in K & L, the emission of the heated dust, whereas at shorter wavelengths the scattered stellar emission becomes more important. This is in agreement with models of the spectral energy distribution computed for IRC+10216 (see e.g. Mauron et al. 2003). In the K & L bands, the dust emission is indeed ∼ 100 times larger than the scattered stellar light which becomes dominant below ∼ 1µm. Therefore, we can deduce that most of the clumps seen close to the star in the L-band have approximately the same temperature. On the contrary, in the J-band optical depth effects could explain the different brightness of the clumps.
3.2. Temporal variations
Temporal changes of the IRC+10216 innermost regions have already been reported by Tuthill et al. (2000), Weigelt et al. (2002) and references therein. Weigelt et al. (2002) have estimated approximately linear displacements between clumps
A-C and A-D, and a possible acceleration of 5 mas yr−2for the
separation A-B. Tuthill et al. (2000, 2005) have identified two sub-components in clump B: NE1 and NE2 close and far from
clump C, hereafter referred as B1 and B2, respectively. They
have proposed that clumps B1, B2 and D move away from A,
J-band
1.5 1.0 0.5 0.0 -0.5 -1.0 -1.5
Relative R.A. (arcsec) -1.5 -1.0 -0.5 0.0 0.5 1.0 1.5
Relative Dec. (arcsec)
0.2%
L-band
1.5 1.0 0.5 0.0 -0.5 -1.0 -1.5
Relative R.A. (arcsec) -1.5 -1.0 -0.5 0.0 0.5 1.0 1.5
Relative Dec. (arcsec) 0.2%
H-band
1.5 1.0 0.5 0.0 -0.5 -1.0 -1.5
Relative R.A. (arcsec) -1.5 -1.0 -0.5 0.0 0.5 1.0 1.5
Relative Dec. (arcsec)
0.2% ... A B ... ... C D ... K-band 1.5 1.0 0.5 0.0 -0.5 -1.0 -1.5
Relative R.A. (arcsec) -1.5 -1.0 -0.5 0.0 0.5 1.0 1.5
Relative Dec. (arcsec)
0.2% PSF
PSF PSF
PSF
Fig. 1. NACO JHKL images of IRC+10216. Contour levels are 80, 60, 40, 20, 10, 8, 6, 4, 2, 1, 0.5, and 0.2% of the peak surface
brightness. North is up and East is left. The white cross at each image center represents the assumed central star position and its size is proportional to the error of 0.03” as given by Murakawa et al. 2005. Clumps A to D of the H-band follow the Haniff & Buscher (1998) clump nomenclatures. The resolution is about 70 mas in the J and H bands, 80 mas in K and 120 mas in L (represented by the circles at each image corner).
We have also applied on the H-band1image a Fourier
filter-ing procedure in order to remove the structures of lower spatial frequencies (see Fig. 2). We have then identified new features,
1 We have selected the H-band image (instead of the K-band most
commonly analyzed) because of its better spatial resolution and con-siderably better dynamic range. We have verified that the detected clumps and their estimated positions are similar to those found in the K-band.
in particular, the sub-features B′
0, B
′
1and B
′
2, in clump B. We
found a feature, not identified in previous works, close to the assumed star position (labeled H). We note that the star posi-tion assumed in this work could still be discussed and its con-nection with clump H is very unclear. This clump could be, for instance, a dust cloud just passing between the star and the ob-server. Future observations are needed to study the evolution of this clump with respect to the central star position.
I.C. Le˜ao et al.: The CSE of IRC+10216 from milli-arcsecond to arcmin scales 5
0.2 0.0 -0.2 -0.4 -0.6
Relative R.A. (arcsec) -0.2
0.0 0.2 0.4 0.6
Relative Dec. (arcsec)
D B2 B1 B D C A B2’ B1’ B0’ H
Fig. 2. H-band map of IRC+10216, where only the highest
spa-tial frequencies of the brightness in the Fourier space have been kept. The contour levels are 80, 50, 20, 10, 8, 5, 2, 1 and 0.5% (this minimum level being the estimated noise). The dotted cir-cle is the assumed star position, as in Fig. 1. Main clumps are indicated by the labels A to D, and some sub-features by the smaller labels. The positions of these clumps are shown by the white crosses. Estimated trajectories (from the results of Tuthill et al. 2000) for some clumps with respect to clump A are also shown (see text for details).
Fig. 2 shows estimated apparent trajectories for the
previ-ously detected clumps B1, B2and D, with respect to A. These
estimations were made by assuming that the clumps move away from A, as proposed by Tuthill et al. (2000), and by tak-ing into account of their spatial separations. The solid arrows represent the displacement of these clumps during the inter-val time of their observations, i.e. from 1997 January to 1999 April. The dashed arrows show a prediction for the clumps dis-placements up to 2003 March, by assuming the averaged veloc-ity of Tuthill et al. (2000). The dotted arrows represent an al-ternative prediction by assuming the acceleration law proposed by Tuthill et al. (2000). The error margins are about 10 mas for the dashed arrows and 30 mas for the dotted ones. We can
see that the previous clumps B1and B2 are most probably the
current sub-features B′
1and B
′
2, respectively. They are currently
separated by 258 ±20, 394 ±20 and 261 ±20 mas from A. B1
and B2 thus appear to be less accelerated than expected. At
the same time, clump D appears to have moved with a con-stant velocity. ¿From the clumps separations given by Weigelt et al. (2002), we have also verified that clump C (currently lo-cated at 131 ±20 mas from A) appears to be approximately motionless. Note that choosing clump A as reference could give the illusion that the clumps escape from it. The clumps motions are therefore not compatible with the uniform acceleration law
100 50 0 -50 -100
Relative R.A. (arcsec) -100
-50 0 50 100
Relative Dec. (arcsec)
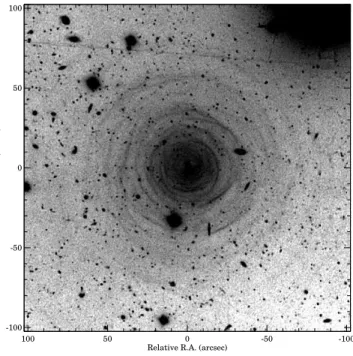
Fig. 3. FORS1 deconvolved V-band image of IRC+10216.
North is up and East is left.
proposed by previous studies, although some accelerations may
exist for clumps B1and B2. New high angular resolution
obser-vations are needed to disentangle the three-dimensional mor-phology of the innermost environment of IRC+10216 and to study the temporal variations of these clumps.
4. External layers of IRC+10216
Fig. 3 shows the deconvolved wide-field V-band image of IRC+10216. As already shown by MH99-00, we see an ex-tended halo composed of thin and irregular multiple-shells. They appear to be non-concentric and azimuthally incomplete. The CSE is seen due to external illumination by the ambient Galactic light, scattered by the dust. Since these photons can easily penetrate into the CSE (their optical depth from the out-side towards the center being very low), the incomplete shells do reveal lower densities in some parts of the CSE. The shell discontinuities can obviously not be caused by some shadow-ing effects due to more external material.
4.1. Structure of the external layers
To emphasize the shell morphology, we have removed the cen-tral extended halo by applying the same Fourier filtering pro-cedure as for the NACO images. We have also removed sev-eral sources (stars or galaxies) by selecting those with observed intensities larger than a prefixed threshold. The source pixels were replaced by averaged values taking into account the local background and the noise level. The resulting image is shown
in Fig. 4. We have then applied an azimuthal smoothing of 20o
around the center. Although this decreases the spatial resolu-tion in the azimuthal direcresolu-tion, the resulting map (Fig. 5) shows
100 50 0 -50 -100 Relative R.A. (arcsec)
-100 -50 0 50 100
Relative Dec. (arcsec)
Fig. 4. Deconvolved V-band image after subtraction of the halo
of the CSE and removing of most stars and galaxies.
100 50 0 -50 -100
Relative R.A. (arcsec) -100
-50 0 50 100
Relative Dec. (arcsec)
Fig. 5. Schematic map of the shells surrounding IRC+10216
(see text for details).
a clear visualization of the shells, and gives a more realistic and complete pattern than that presented in previous works.
The shell distribution seen in Figs. 4 & 5 are similar to those reported before. For instance, the three faint and
appar-ently thick shells at North, located at about 30–40′′, 50–60′′
and 70–80′′from the center, can also be seen in the CFHT
im-age (MH99-00). However, these shells, being better resolved in the FORS1 images, appear to be composed of a complex
sub-distribution of thinner ones. Similar thin shells located very close each other are well seen everywhere in the CSE. For in-stance, the shells labeled e and f by MH00 (located at
dis-tances to the center of about 55′′ and 58′′, between 347–20o
and 23–53o, respectively) are clearly mergers of complex thin
shell distributions. Another prominent shell located to the S, at
about 15′′ from the center, joins series of slightly less
promi-nent thinner ones distributed toward SE, between 10–30′′from
center. Moreover, even in the more internal regions, several thin
shells seem to merge in thicker ones between about 4′′and 20′′.
The whole CSE thus appears to be composed of a complex of several thin irregular shells that could be identified as thicker ones in less resolved images. Finally, we note that the separa-tion between apparently thick shells varies a lot with respect to the radial direction.
On another hand, a smooth azimuthally radial profile de-rived by computing the mean of all the pixels found in annuli
0.9′′ thick (see MH99-00 for more details) confirms that the
dust is detected up to about 200′′ (about 5 800 stellar radii).
That corresponds to material ejected about 8 000 years ago
(assuming an escape velocity of 14 km s−1 and a distance of
120 pc), i.e. an important fraction of an interpulse on the AGB. Actually, we do not see any edge for the dusty envelope and we are limited by the detector size.
4.2. Thickness of the shells
MH00 have proposed that the shells thickness increases with increasing the distance to the center, in agreement with the nat-ural expansion of the envelope. To analyze the shell profiles and to verify their finding, we propose here a new and more accu-rate method, by taking into account the non-concentric nature of the shells and the possibility that an apparently thick shell may be resolved into several thinner ones.
Fig. 6 shows the CSE morphology in a map of narrow2
radial strips. From this diagram, we clearly see the non-concentric nature of the shells as well as the complexity of their spatial distribution. For instance, the long and thin shell located
at distances to the center of about 15–20′′, between 220oand
340ofrom North, has an inclination of about 4oin this diagram
with respect to the vertical axis. The shell located at distances
to the center of about 30–35′′, between 300o and 360o from
North, has an inclination of about 17o. At the same time, there
are shells with opposite orientations, as those found at distances
to the center of about 25–30′′and 45′′, from 210oto 260o, and
from 200o to 230o, respectively, which make angles of about
−16oand −2owith respect to the vertical axis.
Regarding the profile of the thickest shells, we have care-fully analyzed the shell labeled d in MH00. Fig. 7(a) shows its profile by applying the same method as those authors. Fig. 7(b) shows the profile of the same shell estimated from the more
re-stricted region located at a distance to the center of about 39′′,
between 70–90o, where it appears more regular. We have then
integrated profiles perpendicular to its direction and subtracted
2 Radial sections with thickness of 1 pixel and a rotation step of
0.2o. Interpolations between the original image pixels were applied
I.C. Le˜ao et al.: The CSE of IRC+10216 from milli-arcsecond to arcmin scales 7 0 45 90 135 180 225 270 315 360 N E S W N 0 20 40 60 80
Radial strip angle from North (deg)
0 20 40 60 80 0 20 40 60 80
Distance to the center (arcsec)
Fig. 6. Map of the shells transformed from polar coordinates to a Cartesian representation. Each horizontal section of these maps
represents a narrow radial strip of the FORS1 images, the angles of the strips being with respect to North. Maps to the left, center and right were derived from Figs. 3, 4 & 5, respectively.
the extended halo contribution. The estimated FWHM of the
profile (a) is about 3.0′′(as in MH00), whereas it is about 2.6′′
for the profile (b). The error margins are around 0.4′′. Although
both estimates are in agreement within the error bars, a deeper analysis of this shell reveals that even our profile (b) could be widened due to a merging of two thinner ones. Indeed, the pro-files shown in Fig. 7 have two close peaks at offsets of about
±0.5′′, which leads us to suspect that there are two thin shells
close together in this region and, hence, not well spatially re-solved. We note that this shell was carefully analyzed, this pair of peaks being identified in every derived profiles. If we decom-pose the profile (b) in two close shells, their estimated FWHM
are about 1.8′′±0.4′′. In consequence, we have derived several
shell profiles by identifying, as above, well resolved thin shells at different distances to the center, (see Fig. 8). The profiles (a) to (d) have good S/N ratios. The profile (e) having a worse S/N ratio is actually a thin feature composing an apparently thicker shell which was also detected by MH00. The FWHM of the two features in the profile (a) and the other four features in
the profiles (b) to (e) are, respectively, about: 1.2′′, 1.6′′, 1.5′′,
1.7′′, 1.6′′and 1.4′′. The error margins are around 0.4′′. In a
more general way, we have estimated the FWHM of 23 shells
at radial distances from 4′′ to 80′′ (see Fig. 9). We found a
mean FWHM value of 1.6′′, with a standard deviation of 0.3′′.
The minimum FWHM value of 1.2′′is found for the innermost
analyzed shell, located at about 4′′ from center between 40–
100o, and also for two shells located at about 9′′and 11′′from
the center, between 150–180oand 205–255o, respectively. The
ang = 70−90o
ang = 55−101o
(a)
(b)
Relative offset (arcsec)
Relative intensity (%)
d = 39´´
d = 39´´
Fig. 7. Comparison of the profile of the shell d estimated as in
MH00 (top panel) with its profile derived by our more complex method (bottom panel, see text for details). The distances to the center, d, of the shells and the ranges of their azimuthal angles from north, ang, are given. The relative intensity is with respect to the central peak brightness of the original image.
maximum FWHM value of 2.0′′is found for the shells located
at about 24′′and 25′′, between 105–135oand 60–85o,
respec-tively. The furthest analyzed shell, located at about 80′′ from
center, between 30–45o, has a FWHM ≃ 1.9′′. The error bars
vary between 0.3′′and 0.6′′. Thin shells are thus detected in the
whole envelope and even far from center. We therefore cannot derive a clear increasing relation between the shell thickness
ang = 150−180o ang = 220−330o ang = 300−350o ang = 200−230o ang = 20−30o (a) (b) (c) (d) (e)
Relative offset (arcsec)
Relative intensity (%) d = 11´´, 15´´ d = 18−20´´ d = 31−35´´ d = 42−43´´ d = 55−57´´
Fig. 8. Profiles of some shells considering their non-concentric
nature (see text for details). There are two shells in the panel (a) and one in the others. The given parameters follow the same definitions as in Fig. 7. The ranges in the shell distances to the center, d, are due to their non-concentric nature.
Fig. 9. Relation between the thickness of the shells and their
distance to the center.
and the distance to the center such as that proposed by MH00. However, the shells found rather close from center could be resolved into even thinner ones. We therefore could have over-estimated their thickness. In consequence, either the slope of the thickness variation with distance proposed by MH00 could still be valid but with very thin shells close to the star, or the shell thickness increases much less than that estimated by these authors.
5. Global view of IRC+10216
In order to better understand the possible links existing between the almost spherical shells and the inner clumps, we describe here the morphology of the inner CSE from the FORS1 image together with the NACO data.
Fig. 10 (left panel) shows a closer view of Fig. 4. MH99-00 have detected three structures suspected to be shells in regions
within about 3.1′′from the center, whereas no such shells are
found in our data, possibly because the HST data have a bet-ter spatial resolution, despite their lower S/N ratio. The
clos-est identifiable structures are located between ∼3′′ and 16′′
from center. Regarding the core of the nebula, it appears clearly asymmetric. Two dominant lobes much brighter than the rest of the envelope lie around the center, making together a direction
of about 22o±2owith respect to North. The southern lobe being
40% brighter than the northern one. These features likely result from scattered stellar photons in contrast to the reflected galac-tic light seen elsewhere in the envelope. Such bipolar morphol-ogy could be an indication that scattering is more efficient in the polar direction. It could be roughly reproduced by a simple model of scattering dust grains in a non-spherical dusty enve-lope, with evacuated polar regions, around the star, the system being tilted away from the observer (see e.g. Men’shchikov et al. 2001). We however note that the main shape of the bipolar nebula slightly differs from the one reported by MH00 from their HST image, possibly due to the different spatial resolu-tion.
Fig. 10 (right panel) gives a representation of the IRC+10216 core, by superposing the NACO and FORS im-ages. The two images were arbitrarily positioned by coincid-ing their intensity peaks. We are conscious that this assumption may be crude since the V and IR images result from very differ-ent physical processes. However, this composite image repre-sents for the first time both the extended layers and the bipolar core together with the real size of the inner clumps, and puts forward the difficulty of finding a link between such small and large scale morphologies. Firstly, evidence of clumps far from the center was not found by Huggins & Mauron (2002) in a pre-vious analysis of the same FORS1 image. Secondly, shells can-not be identified in the NACO images. We can-note that, although the region composed of clumps A to D roughly looks like a ring, its center (the depression feature) is not compatible with the star position estimated by Murakawa et al. (2005). Finally, the bipolar structure detected in V-band is also not clearly iden-tified in the near-IR.
6. Conclusion
We have described in this work very high quality images of the CSE of IRC+10216, from its most inner regions to the most external ones. In the central arcsec scale of the JHKL images, sub-arcsec structures (or clumps) identified by other authors have been recovered about 4 years later. We have also derived a map of the brightest clumps found close to the core of IRC+10216. The morphology of these clumps varies strongly with increasing wavelengths and we propose that the closest structures have about the same temperature. Furthermore, by
I.C. Le˜ao et al.: The CSE of IRC+10216 from milli-arcsecond to arcmin scales 9
20 10 0 -10 -20
Relative R.A. (arcsec) -20
-10 0 10 20
Relative Dec. (arcsec)
2 1 0 -1 -2
Relative R.A. (arcsec) -2
-1 0 1 2
Relative Dec. (arcsec)
Fig. 10. View of the IRC+10216 CSE inner morphology. Left panel shows the closest structures around the center detected in
V-band. Right panel shows the V-band image core, on which has been superposed the NACO H-band image. The overlapping has been done by assuming that the NACO and FORS peak brightness are found at the same location.
analyzing their apparent relative motion, we cannot confirm the uniform outflow acceleration previously proposed since only two bright clumps appear to be accelerated (but at a smaller rate than that already estimated), whereas others clumps could have a constant velocity or even no relative motion. At much larger spatial scales (up to a few arcmin), we present a new map of the non-spherical incomplete shells characterizing the CSE of IRC+10216. Owing to the high spatial resolution of our im-age, most of the thicker shells actually appear to be composed of thinner elongated ones. Their thicknesses appear rather
uni-formly distributed between about 1′′and 2′′, regardless of the
distance to the center. Finally, we have combined the NACO and FORS images in order to provide a more global view of this CSE and to compare the typical size of the clumps found very close to the center with the bipolar nebula and with the much more external shells.
This study has confirmed the very complex nature of the IRC+10216 envelope with asymmetries already present on the AGB. Neither the morphology at different spatial scales nor the motions detected very close to the center can be satisfactory explained by current models on the mass-loss mechanisms in AGB stars and their typical time-scales. For instance, Sandin & H¨ofner (2004 and references therein) have predicted shell den-sity distributions not compatible with those observed around IRC+10216 (see also on the same topic Meijerink et al., 2003). Another scenario for the formation of the shells in a spheri-cally symmetric stellar wind has been explored by Soker (2000, 2002). He proposed that these shells could be connected to cool magnetic spots on the stellar surface. If these spots are more concentrated near the equator, the mass-loss geometry could
deviate from sphericity and thus favor the formation of shell-like features and/or clumps.
Moreover, it is interesting to note that the very complex structures found around IRC+10216 may affect the chemical composition of its envelope. For instance, the clumps detected very close to the central core may favor, by their thermody-namical properties, the formation of the graphite observed in presolar dust grains (Bernatowicz et al. 2005). Furthermore, the presence of high density shells in the photochemically active regions could change the molecular distribution in the envelope by blocking external UV photons (see e.g. MH00; Brown & Millar 2003). Then, high contrast shells of complex molecules may be formed more easily, as confirmed by some
millime-ter observations (see for instance, HCO+, C2H, C4H and HC5N
maps by Gu´elin et al., 2000, and CO maps by Fong et al., 2003). Finally, future high spatial resolution images of this CSE are still mandatory in order to better understand the motions of its clumps (and in particular the clump H superposed on the assumed central star), their formation/fading, the central star position and the possible evolution of the external shells as their three-dimensional morphology.
Acknowledgements. We thank N. Mauron for fruitful and
stimu-lating discussions over all these years and his comments on the manuscript, and D. O’Brien for proofreading it. The Brazilian agen-cies CAPES and CNPq are thanked for financial support. P. de Laverny acknowledges support from the CNRS/INSU (Actions Th´ematiques
Innovantes) and MESR (Jeunes Chercheurs).
References
Bernatowicz, T.J., Akande, O.W., Croat, T.K., et al. 2005, ApJ, 631, 988
Brown, J.M., & Millar, T.J. 2003, MNRAS, 339, 1041 Fong, D., Meixner, M., & Shah, R.Y. 2003, ApJ, 582, L39
Gu´elin M., Lucas R., Neri R., et al. 2000, in IAU Symp 197, p.365, Minh & van Dishoek eds
Haniff, C.A. & Buscher, D.F. 1998, A&A, 334, L5 Hanuschik R., Amico P. 2000, The Messenger, 99, 6 Huggins, P. J., & Mauron, N. 2002, A&A, 393, 273
de Laverny P. 2003, in Mass-losing pulsating stars and their cir-cumstellar matter, p. 197, Nakada Y., Honma M., Seki M. eds., Astrophysics & Space Sience Library vol. 283, Kluwer Academic Press.
Lenzen, R., Hartung, M., Brandner, W., et al. 2003, SPIE, 4841, 944 Lucy, L.B. 1974, AJ, 79, 745
Mauron, N., & Huggins, P.J. 1999, A&A, 349, 203 Mauron, N., & Huggins, P.J. 2000, A&A, 359, 707
Mauron, N., de Laverny, P., & Lopez, B. 2003, A&A, 401, 985 Meijerink, R., Mellema, G., & Simis, Y. 2003, A&A, 405, 1075 Men’shchikov, A.B., Balega, Y., Bl¨ocker, et al. 2001, A&A, 368, 497 Murakawa, K., Suto, H., Oya, S., et al. 2005, A&A, 436, 601 Richardson, W.H. 1972, JOSA, 62, 55
Rousset, G., Lacombe, F., Puget, P., et al. 2000, SPIE, 4007, 72 Sandin, C, & H¨ofner, S. 2004, A&A, 413, 789
Soker, N. 2000, ApJ, 540, 436 Soker, N. 2002, ApJ, 570, 369
Tuthill, P.G., Monnier, J.D., Danchi, W.C., et al. 2000, ApJ, 543, 284 Tuthill, P.G., Monnier, J.D., & Danchi, W.C. 2005, ApJ, 624, 352 Vandame, B. 2002, SPIE, 4847, 123
Weigelt, G., Balega, Y., Bl¨ocker, T., et al. 1998, A&A, 333, L51 Weigelt, G., Balega, Y.Y., Bl¨ocker, T., et al. 2002, A&A, 392, 131
List of Objects