HAL Id: hal-00329190
https://hal.archives-ouvertes.fr/hal-00329190
Submitted on 1 Jan 2003
HAL is a multi-disciplinary open access
archive for the deposit and dissemination of
sci-entific research documents, whether they are
pub-lished or not. The documents may come from
teaching and research institutions in France or
abroad, or from public or private research centers.
L’archive ouverte pluridisciplinaire HAL, est
destinée au dépôt et à la diffusion de documents
scientifiques de niveau recherche, publiés ou non,
émanant des établissements d’enseignement et de
recherche français ou étrangers, des laboratoires
publics ou privés.
Variability of mesoscale features in the Mediterranean
Sea from XBT data analysis
G. Fusco, G. M. R. Manzella, A. Cruzado, M. Gacic, G. P. Gasparini, V.
Kovacevic, C. Millot, C. Tziavos, Z. R. Velasquez, A. Walne, et al.
To cite this version:
G. Fusco, G. M. R. Manzella, A. Cruzado, M. Gacic, G. P. Gasparini, et al.. Variability of mesoscale
features in the Mediterranean Sea from XBT data analysis. Annales Geophysicae, European
Geo-sciences Union, 2003, 21 (1), pp.21-32. �hal-00329190�
Geophysicae
Variability of mesoscale features in the Mediterranean Sea from
XBT data analysis
G. Fusco1, G. M. R. Manzella1, A. Cruzado2, M. Gaˇci´c3, G. P. Gasparini4, V. Kovaˇcevi´c3, C. Millot5, C. Tziavos6, Z. R. Velasquez2, A. Walne7, V. Zervakis6, and G. Zodiatis8
1ENEA, Progetto Speciale Clima Globale, La Spezia, Italy 2CSIC, Centre d’Estudis Avanc¸ats de Blanes, Blanes, Spain
3OGS, Istituto Nazionale di Oceanografia e di Geofisica Sperimentale, Trieste, Italy 4CNR, Istituto di Oceanografia Fisica, La Spezia, Italy
5CNRS, Laboratoire de Biochimique, Toulon, France 6National Centre for Marine Research, Athens, Greece
7Sir Alistair Hardy Foundation on Oceanographic Studies, Plymouth, UK
8Laboratory of Physical Oceanography, Department of Fisheries and Marine Research, Nicosia, Cyprus
Received: 6 September 2001 – Revised: 4 November 2002 – Accepted: 6 November 2002
Abstract. During the period 1998–2000, the Mediterranean
Forecasting System Pilot Project, aiming to build a forecast-ing system for the physical state of the sea, has been carried out. A ship-of-opportunity programme sampled the Mediter-ranean upper ocean thermal structure by means of eXpend-able Bathy-Thermographs (XBTs), along seven tracks, from September 1999 to May 2000. The tracks were designed to detect some of the main circulation features, such as the stream of surface Atlantic water flowing from the Alboran Sea to the Eastern Levantine Basin. The cyclonic gyres in the Liguro-Provenal Basin, the southern Adriatic and Ionian Seas and the anticyclonic gyres in the Levantine Basin were also features to be detected.
The monitoring system confirmed a long-term persistence of structures (at least during the entire observing period), which were previously thought to be transient features. In particular, in the Levantine Basin anticyclonic Shikmona and Ierapetra Gyres have been observed during the monitoring period.
In order to identify the major changes in the thermal struc-tures and the dynamical implications, the XBT data are com-pared with historical measurements collected in the 1980s and 1990s. The results indicate that some thermal features are being restored to the situation that existed in the 1980s, after the changes induced by the so-called “Eastern Mediter-ranean Transient”.
Key words. Oceanography: physical (eddies and mesoscale
processes; general circulation; instruments and techniques)
Correspondence to: G. Fusco ([email protected])
1 Introduction
The first circulation schemes of the Mediterranean Sea were provided by Nielsen (1912), W¨ust (1961), Ovchinnikov (1966), Lacombe (1973) and other authors. The pictures of the upper circulation (Fig. 1) provided by these authors were showing an Atlantic Water (AW) stream entering the Strait of Gibraltar and describing a quasi-permanent anticyclonic gyre in the Western Alboran Sea. The AW was then flow-ing along the Algerian coast toward the Strait of Sicily. Two secondary streams were separating from the main path. The first was flowing cyclonically in the Algero-Provenc¸al Basin, entering the Ligurian Sea, the Gulf of Lions and the Cata-lan Sea. The second stream was detaching before the Strait of Sicily, flowing cyclonically in the Tyrrhenian Sea and fi-nally entering the Ligurian Sea. The AW flowing into the Eastern Mediterranean was supposed to describe large cy-clonic loops in the Ionian Sea and Levantine Basin, and an anticyclonic loop in the Gulf of Syrte. This “horizontal” ther-mohaline circulation cell was part of two other internal cells of deep circulation, normally known as “Mediterranean Con-veyor Belts”, driven by the deep waters formed in the Eastern and Western Mediterranean.
This circulation scheme was essentially drawn from basin-wide, low-resolution measurements and was substantially modified during the last two decades, as a consequence of higher resolution measurements and process oriented stud-ies. The Mediterranean Sea is now known to have a very high spatial and temporal variability at all scales, from small turbulence to basin scale processes.
The Western Mediterranean has been studied extensively since the 1950s. More intensive investigations were done in the framework of various international projects (La Violette,
22 G. Fusco et al.: Variability of mesoscale features
Fig. 1. Upper layer circulation and main features in the Mediterranean Sea (adapted from Millot, 1999; Malanotte-Rizzoli et al., 1997;
Robinson and Golnaraghi, 1994): 1-Western Alboran Gyre, 2-Algerian Current, 3-Liguro-Provenc¸o-Catalan Current, 4-Bonifacio Gyre, 5-Tyrrhenian Current, 6-Atlantic-Ionian Stream, 7-Modified Atlantic Water, 8-Ionian Anticyclones, 9-Mid Ionian Jet, 10-Adriatic Surface Wa-ter, 11-Ionian Surface WaWa-ter, 12-Pelops Anticyclone, 13-Cretan Cyclone, 14-Mid-Mediterranean Jet, 15-Ierapetra Anticyclone, 16-Rhodes Gyre, 17-Mersa-Matruh Gyre, 18-Shikmona Gyre.
1990; Millot, 1995). On the contrary, the Eastern Mediter-ranean Sea has only been investigated intensively during the last two decades. The most comprehensive information on the circulation of the Eastern Mediterranean Sea came from the project Physical Oceanography of the Eastern Mediter-ranean (POEM), an international effort to record and anal-yse the general and mesoscale circulation of the region, re-solving seasonal as well as interannual variability (see e.g. Malanotte-Rizzoli and Robinson, 1988).
Many aspects of the circulation remain insufficiently in-vestigated and several questions are still open. For example, the seasonal variability (strength and dimension) of many eddies (having diameters of tens of kilometres) and gyres (diameters of hundred kilometres) has yet to be determined. This is an important issue since, inter alia, eddies and gyres influence the transport of properties through the basin (e.g. Malanotte Rizzoli et al., 1999). The interannual and long-term variability of the basin is still largely unknown, and this hampers the possibility to develop climate studies. To fill these gaps, there is a need for a long-term monitoring of the basin.
The Mediterranean Forecasting System Pilot Project (MF-SPP – Pinardi and Flemming, 1998), promoted by the Euro-GOOS Association (Woods et al., 1996) through the Mediter-ranean Test Case Task Team, had the aim to set up the fore-casting system for the physical state of the sea. MFSPP launched a ship-of-opportunity programme, providing XBT profiles of the Mediterranean thermocline from September 1999 to May 2000.
This paper presents the analysis of the full resolution XBT
data. The details on data collection and data quality check methodology are presented in Sect. 2. In the Sect. 3 the sea-sonal and regional variability of the data are outlined while in Sect. 4 some remarks on interannual variability are pre-sented.
2 Methods and data
MFSPP implemented, for the first time, a basin wide oper-ational monitoring system of the Mediterranean Sea based on XBT data collection by means of ships of opportunity. The main characteristics of the system were the real-time data delivery, the open and user friendly access to near-real-time data through the project web page, and the high time and space resolution. According to the recently revised sampling strategies of the ship-of-opportunity program in the world ocean (JCOMM, 1999, 2000; Smith et al., 1999), three major sampling modes are defined: Low Resolution Sam-pling with monthly track repetition and four XBT drops per day; Frequently Repeated Sampling with lines repeated 18 times per year with an XBT drop every 100 to 150 km; High Density Sampling with closely spaced XBTs (typically 10– 50 km) and a repetition frequency of about four times per year.
The MFSPP identified the need to resolve, in an opera-tional way, the meso-scale and infra-annual changes in the Mediterranean Sea at temporal and spatial scales of 15 days and 15–20 km, respectively (Manzella et al., 2001).
The MFSPP tracks (Fig. 2) were designed to detect some of the most important circulation features of the
Mediter-Table 1. Ship-of-opportunity tracks, departing/arriving port, institutions involved and XBT model in the MFSPP
Track Departing/arriving port Institution XBT model (Sippican) 1a Gibraltar-Palermo SAHFOS (UK) T7
1b Messina-Haifa SAHFOS (UK) T7 1 Gibraltar-Haifa SAHFOS (UK) T7 2a Barcelona-Skikda CSIC CEAB (ES) T7/T6 2b Barcelona-Arzew CSIC CEAB (ES) T7/T6 3 Sete-Tunis CNRS LOB (FR) T7/T6 4 Genova-Palermo CNR-ENEA (IT) T4
5 Ploce-Malta OGS (IT) T7/T6
6 Piraeus-Alexandria NCMR (GR) T6 7 Limassol-PortSaid DFMR LPO (CY) T4
Table 2. Period and number of XBT launches done during MFSPP. Star indicates that the track was not carried out. The sampling frequency
was approximately 15 days for tracks 2,3,4,5,6,7 and one month for track 1. The number 1 near the names of the month indicates that the data were collected in the first half of the month, while number 2 indicates that the data were collected in the second half
Track Sept Oct Nov Dec1 Dec2 Jan1 Jan2 Feb1 Feb2 Mar1 Mar2 Apr1 Apr2 May1 May2 1999 1999 1999 1999 1999 2000 2000 2000 2000 2000 2000 2000 2000 2000 2000 1a 73 68 44 1b 84 83 100 1 ∗ 153 161 171 151 ∗ 2a ∗ 30 2b ∗ 33 37 31 33 31 33 ∗ 32 ∗ 32 35 37 ∗ 3 50 39 29 14 ∗ 42 34 40 40 44 44 40 39 41 43 4 39 38 38 41 38 38 38 39 37 39 39 40 39 38 38 5 49 47 54 53 50 45 43 38 38 41 44 41 42 41 42 6 ∗ 45 39 38 34 ∗ 22 ∗ 36 ∗ 35 35 39 ∗ 36 7 23 21 24 25 24 23 18 20 19 20 19 20 20 19 19
ranean Sea. A “training phase” from September to November 1999 preceded the monitoring program and an “operational period” was carried out from December 1999 to May 2000. In order to ensure data comparability and compatibility, com-mon protocols for data collection, transmission and control were adopted by all participants.
The list of institutions involved in data collection is pro-vided in Table 1, as well as information on departing and ar-riving ports and XBT probes used. Table 2 lists details on pe-riod and number of XBT launches during MFSPP. The long track from Gibraltar to Haifa was carried out only one time per month by SAHFOS, due to the duration of the entire trip (28 days from UK to Haifa and back). Some changes had to be introduced to the planned schedule during the monitoring period. They were due to difficulties that affected the regular sampling, such as strikes in ports and accidental wreckage or unavailability of ships. Other difficulties came from the me-teorological conditions that were especially severe in winter in particular areas, such as the Gulf of Lions.
The XBT probe types used were Sippican T4, T6 and T7. The T4 and T6 XBTs provided temperature profiles down to 460 m with a rated ship speed of 30 kts and 15 kts, re-spectively. The T7 probe maximum depth is 760 m and the
rated ship speed is 15 kts. All the probes had a tempera-ture accuracy of ±0.1◦C and a resolution of 0.01◦C. A
to-tal of 3916 XBT drops were made between September 1999 and May 2000 by all participants. The quality check of the data was carried out by applying some methodologies devel-oped by others European projects, such as MedAtlas (Me-dAtlas Group, 1994) and Mediterranean Oceanic Data Base (MODB) (Brasseur et al., 1996). The procedures consisted of different steps:
1. “check for spikes” – a visual check was performed in order to eliminate not acceptable values;
2. “check for impossible regional values” – the profile val-ues were checked to be between a minimum and a max-imum temperature values for the different geographical areas specified in MedAtlas. These minimum and max-imum values were extracted from seasonal climatology Med5 (Brasseur et al., 1996);
3. “narrow range check” – each profile was compared with monthly data from Med6 climatology obtained in the framework of MFSPP (Brankart and Pinardi, 2001). It is important to underline that some areas of the
Mediter-24 G. Fusco et al.: Variability of mesoscale features
Fig. 2. The Mediterranean Sea and the ship-of-opportunity tracks (straight lines) carried out in the framework of MFS. Each track is identified
with a number (see also Table 1).
ranean Sea were poorly sampled and then the clima-tological means could be scarcely representative of a long-term average of temperature and salinity. In partic-ular, the existing climatology is not able to capture the interannual variability in the Eastern Levantine Basin. A careful study on the space and time distribution of XBT historical profiles from MedAtlas has been performed by Manzella et al. (2002) in this issue. Their results confirmed that 61% of the collected profiles fall within the range ±2 standard deviation (σ ), the remaining is over this range. In particular, 10% of all profiles is above ±4σ , the greatest part of which were collected in the Eastern Mediterranean. The reason for this is based on the fact that the climatological data set of the Eastern Levantine Basin is based on the tempera-ture profiles collected during the 1990s, with more than 60% of them collected in 1993.
A further comparison was performed by using CTD data collected in the Levantine Basin as part of Cyprus Basin Oceanography (CYBO) program (Zodiatis et al., 1998). This comparison demonstrated the high quality and consistency of the XBT data collected in the area south of Cyprus.
A supplementary check was done comparing profiles of track 1 with the correspondent profiles of tracks 2, 3, 5, 6 and 7, in cross-over points. The final result of the data qual-ity check procedures was that 82% of the examined profiles were acceptable, 16% were corrected and 2% were com-pletely eliminated.
The graphical presentation of temperature vertical sec-tions was done by means of the Ocean Data View software (Schlitzer, 2000). Graphs shown in this paper are from 0 to 760 m (maximum depth reached by the T7 XBTs) for tracks 1, 2, 3 and 5 and from 0 to 460 m (maximum depth reached by the T4 and T6 XBTs) for tracks 4, 6 and 7. The grey
colour is indicating both a lack of data, deriving from qual-ity processing, and seabed. Figures 4 and 7 show a zoom on the 0–150 m layer, with a different colour scale in order to capture some circulation features. This temperature scale is also used to show the Adriatic and Ionian transect vertical sections.
3 Regional and seasonal variability
The temporal and spatial variability of temperature pro-files was significantly different in the Western and Eastern Mediterranean. In the Western Mediterranean and in the Adriatic Sea, the winter cooling led to a loss of thermal stratification. In the Eastern Mediterranean the stratification was always detected, although varying with the seasons and strongly influenced by long-lasting gyres. These conditions are shown in selected figures, namely Figs. 3, 4 and 5.
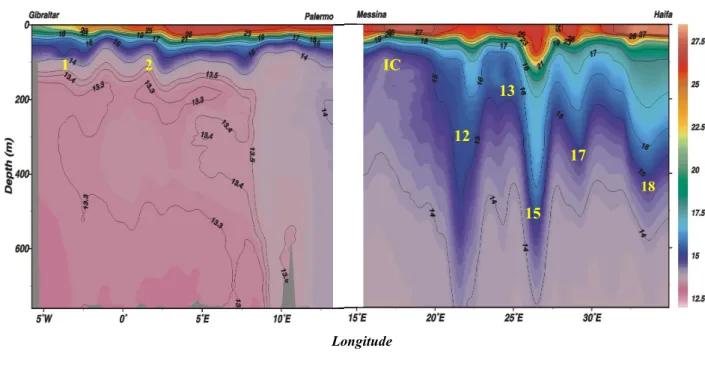
The sections along the main west-east track from Gibral-tar to Haifa (Figs. 3a and b) show a seasonal intensification of the thermal stratification in the southwest Mediterranean. The undulating behaviour of the isotherms, in the Alboran Sea and Algerian Basin, can be related to the baroclinic in-stabilities of the currents. Although only two vertical temper-ature sections are shown for September 1999 (Fig. 3a) and February 2000 (Fig. 3b), this behaviour was observed during the entire monitoring period.
In September 1999 (Fig. 4a) the upper thermocline along the sections from Genova to Palermo was well-stratified as a consequence of the summer warming. It was affected by the cyclonic circulation existing in the Ligurian Sea and close to the Bonifacio Strait, indicated by the slight curvature of the isotherms. The general uplift of the isotherms in front of
(a)
1 2
IC
12
13
15
17
18 Longitude Figure 3a (b)1
IC
12
15
17
18
Longitude2
13
Figure 3bFig. 3. Temperature vertical sections (a) from Gibraltar to Palermo (track 1a) and from Messina to Haifa (track 1b) in September 1999; (b)
from Gibraltar to Haifa (track 1) in February 2000. Numbers and letters indicate the observed features (see also Fig. 1): 1-Western Alboran Gyre, 2-Algerian Current, IC-Ionian Cyclone, 12-Pelops Anticyclone, 13-Cretan Cyclone, 15-Ierapetra Anticyclone, 17-Mersa-Matruh Gyre, 18-Shikmona Gyre.
the Bonifacio Strait were due to Ekman pumping (Astraldi and Gasparini, 1994). February 2000 (Fig. 4b) presented a different situation where a homogeneous layer of cold water was found from surface down to 450 m.
The thermal structure in the Eastern Mediterranean
(Figs. 3a and 3b) presented a series of permanent features such as: the doming of the isotherms in the Ionian Sea, in-dicating the presence of a cyclonic circulation; the Cretan cyclone south of Crete; the anticyclonic gyres of Pelops, Ier-apetra, Mersa-Matruh and Shikmona, that are quite evident
26 G. Fusco et al.: Variability of mesoscale features
a) b)
Figure 4
Fig. 4. Temperature vertical sections from Genova to Palermo (track 4) (a) in September 1999 and (b) in February 2000. Numbers indicate
the observed features (see also Fig. 1): 3-Liguro-Provenc¸o-Catalan Current, 4-Bonifacio Gyre.
b)
15
17
18
a)15
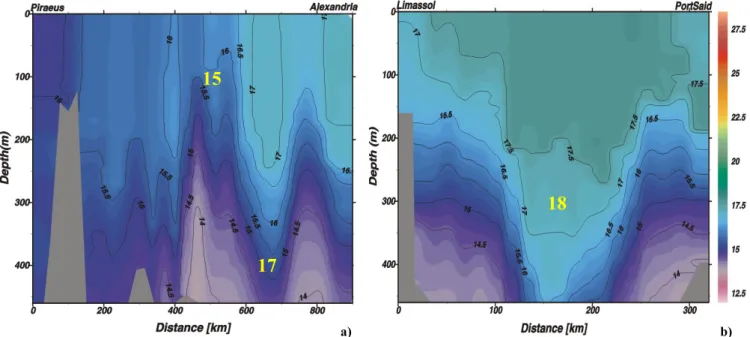
Figure 5Fig. 5. Temperature vertical sections in February 2000 (a) from Piraeus to Alexandria (track 6), (b) from Limassol to PortSaid (track 7).
Numbers and letters indicate the observed features (see also Fig. 1): 15-Ierapetra Anticyclone, 17-Mersa-Matruh Gyre, 18-Shikmona Gyre.
from the deepening of isotherms. The Mersa-Matruh Gyre was intense in September 1999 (Fig. 3a), but the signal was weak in February 2000 (Fig. 3b), probably due to changes in the horizontal structure of the gyre. During winter, there was a reduced stability of the mesoscale features due to the in-creased homogenisation and the consequent decrease in the internal radius of deformation (Zervakis et al., 1998). A new
addition to the oceanographic knowledge of the region, not revealed by the POEM Group, is the existence of a coastal current flowing eastward along the Egyptian coast. This cur-rent is omnipresent in the records of the track 6 (Fig. 5a) a few tens of km and also identifiable, with a weaker signature in track 7 (Fig. 5b).
ther-14 16 18 20 22 24 26 28 Temperature (°C) 500 400 300 200 100 0 Dep t h (m ) Summer Autumn Winter Spring 14 16 18 20 22 24 26 28 Temperature (°C) 500 400 300 200 100 0 Dep t h (m ) a) b) Summer Autumn Winter Spring Figure 6
Fig. 6. Seasonal variability of thermocline from XBT data (a) in the Bonifacio Gyre, (b) in the Shikmona Gyre.
a) b)
Figure 7
Fig. 7. Temperature vertical sections in February 2000 (a) from Barcelona to Skikda (track 2), (b) from Sete to Tunis (track 3).
mocline are shown in Figs. 6a and b. The thermocline in the Bonifacio Gyre (Fig. 6a) was between 40–50 m with a sur-face temperature less than 24◦C and little variability below 150 m. In winter there were nearly constant temperature pro-files from surface to maximum depth. As a consequence, the cyclonic circulation is not evident from the temperature sec-tion in February 2000 (Fig. 4b). The thermocline in the Shik-mona Gyre (Fig. 6b) was between 40–100 m with a higher surface temperature up to about 28◦C in summer. Profiles were nearly homogenous in winter down to a depth of 350 m. Temperature profiles indicate that the Shikmona Gyre was able to induce significant variability during different seasons
at greater depths as well.
4 Interannual variability
The unstable circulation pattern along the Algerian coast is evidenced by the thermal structures observed along tracks 1, 2 and 3 (Figs. 3a and b, 7a and b), in agreement with other data analysed by Millot (1999) and by Fuda et al. (2000). Ac-cordingly, it can be inferred that the structure of the AW layer along the North African coasts was strongly characterised by the occurrence of the mesoscale eddies and that the flow of AW was not continuous. Data from tracks 1 and 3 show
28 G. Fusco et al.: Variability of mesoscale features
Figure 8
a) b)
Fig. 8. Temperature vertical sections from Sete to Tunis (track 3) in May 2000 (a) and in January 2000 (b).
that the presence of large eddies limits the passage of sur-face water through the Sardinian Channel. This pattern is in agreement with previous knowledge of AW circulation in the Western Mediterranean (Millot, 1999; Fuda et al., 2000). In the Gulf of Lions and Catalan Sea, the thermal structure was affected by the cyclonic circulation of the Liguro-Provenc¸o-Catalan system (Millot, 1987). This area, normally the site of Western Mediterranean Deep Water (WMDW) formation, shows a complete lack of stratification during winter months (Figs. 7a, b and 8b). In the Gulf of Lions, the main feature observed was the along-slope coastal flow of AW, charac-terised by a relatively cold water (T< 13◦C, Fig. 7b). In the central part of the Gulf of Lions, air-sea interactions during January-February led first to a cooling of the surface waters, with a formation of Winter Intermediate Water, and then to a thorough homogenisation of the water column. Homoge-neous (1T < 0.5◦C) profiles were encountered from late February (Fig. 7b) to early April, with mean values in the range of 12.5–13.5◦C. The temperature values in the central
area of the Gulf of Lions were about 13◦C, similar to those
measured during winter convection events (MEDOC, 1970). The cyclonic circulation in the Ligurian Sea was reflected in the isotherm pattern (Figs. 4). During winter, the vertical homogenisation did not seem as strong as in previous obser-vations (Sparnocchia et al., 1995). In the central part of the basin the temperature was generally higher than the clima-tological values (> 0.5◦C during winter). MEDOC Group (1970) and Sparnocchia et al. (1995) in the same area showed greater winter vertical homogeneity than was observed by MFSPP in 2000.
The Algerian current displayed a strong variability and interacted with eddies in the Algerian Basin being diverted from its mean eastward path. The structure of the AW flow in the Sardinian Channel depends strongly on that of the
Al-gerian Current and on the occurrence of the upstream eddies. For instance, isotherms across the entire Sardinian Channel were flat in late October, indicative of the absence of any major structured flow. On the contrary, in January–February (Fig. 7b), relatively low temperatures were found only along the Tunisian coast, indicating that the AW was clearly flow-ing along-slope.
Year-to-year variability of the temperature patterns in the southwestern Mediterranean can also be assessed by compar-ing selected historical data sets (collected in early summer 1986 and winter 1997 by Perkins and Pistek, 1990; Astraldi et al., 1999; and Fuda et al., 2000). The surface temperature observed in late May 2000 (Fig. 8a) was up to 1◦C higher
than in early June 1986 (Perkins and Pistek, 1990), while below 200 metres the temperature difference was relatively smaller (0.2–0.3◦C higher in the MFSPP data). A maximum temperature of 13.9◦C was measured between 200–400 m depth in May 2000, while in 1986 the maximum temperature value was about 13.65◦C. Also in January 2000 (Fig. 8b), the temperatures were always higher than in January 1997 (Astraldi et al., 1999).
The Adriatic/Ionian XBT transect (Fig. 9) crossed two areas of crucial importance for understanding the Eastern Mediterranean general circulation and its variability. The first area was the South Adriatic Pit, the source area of the main component of the Eastern Mediterranean Deep Water (see, for instance, Pollak, 1951; Schlitzer et al., 1991). In agreement with the most recent observations (Gaˇci´c et al., 1997; Kovaˇcevi´c et al., 1999; Poulain, 1999), the flow pat-tern in the Pit was characterised by a topographically con-trolled cyclonic gyre, affected by convective processes as-sociated with winter cold air outbreaks and strong surface heat loss events, mainly caused by northerly winds. About a decade ago, the convective process was able to produce
wa-a) b)
Figure 9
Fig. 9. Temperature vertical sections in March 2000 from Ploce to Malta (track 5) (a) Adriatic transect, (b) Ionian transect.
ter dense enough to sink directly to the bottom of the Ionian Sea. Due to mild winters over the Adriatic area and to a new circulation pattern set in the Eastern Mediterranean bot-tom layer in recent years, this water became lighter than the pre-existing Eastern Mediterranean Deep Water and spread in intermediate layers of the northwestern Ionian (Lascaratos et al., 1999). The MFSPP data show that the winter convec-tion in the south Adriatic was not attaining the 600 m depth (Fig. 9a), demonstrating that also in March 2000 deep con-vection did not occur.
The second area of the Adriatic/Ionian transect was the northwestern portion of the Ionian Sea, which is charac-terised by a presence of almost all water masses circulating in the Eastern Mediterranean, such as AW, Levantine Inter-mediate water, Adriatic Deep Water, Eastern Mediterranean Deep Water, Ionian Surface Water, as well as Aegean wa-ters (Malanotte-Rizzoli et al., 1997). Observations of the last decade have shown that the circulation pattern in the eastern portion of the basin has changed during the period 1992–1996. The circulation in the Ionian Basin became anti-cyclonic, diverting, in this way, the flow of the Atlantic water from its original path toward the Levantine Basin (Malanotte-Rizzoli et al., 1999). One of the consequences of this diver-sion was an enhanced production of Eastern Mediterranean Deep Water in the Aegean Sea and a decrease in the Adri-atic Sea, the site of major production before such a tran-sient event. This situation appeared to be reversed during 1999–2000. Uplift of the isotherms close to Sicily was ob-served in track 1 and in track 5 (indicated by the letters IC in Fig. 3). Recent observations made by direct Eulerian current measurements at a mooring positioned in the Northern Io-nian (38.5◦N, 18.0◦E) within the MAST/MTP II/ MATER project (Manca, 2000) have revealed a cyclonic circulation installed there since March 1998.
The Pelops Gyre (Fig. 3) was the main persistent feature before the entrance of the Levantine Basin. It was generally deeper than 760 m and quite large from September (Fig. 3a) to January, and much narrower from February (Fig. 3b) to April 2000. This anticyclone was observed during the POEM cruises and was intense and strongly barotropic below the upper 100 m layer, penetrating down to 800 m.
Another feature frequently cited in the recent literature is the Cretan Gyre, which should be found approximately south of Crete at about 26◦E (Fig. 1). A small anticyclonic gyre was detected in September (Fig. 3a) and October 1999, while in November it was absent (not shown here). During the win-ter months (see, e.g. Fig. 3b), the uplift of isotherms indi-cated again the appearance of the Cretan Gyre. The POEM data define the Cretan Gyre as confined in the upper thermo-cline and disappearing below 400 m. There is a strong con-trast between the two sets of observations. The MFSPP data indicate south of Crete the presence of a cyclonic structure during winter, conversely POEM data show such structure in summer-autumn. This differences could be attributed to the circulation changes which occurred in the Eastern Mediter-ranean or year-to-year variability.
Track 6 crossed the South Aegean Sea and the Levan-tine Basin. Based on existing knowledge, it was expected to cross the Mersa-Matruh anticyclone in the Southern Lev-antine, and possibly the cyclonic Rhodes Gyre in the North-ern Levantine Sea (Robinson and Golnaraghi, 1994). The isotherm depressions along track 6 (Fig. 5a) confirm the pres-ence of anticyclonic Mersa-Matruh Gyre which was very strong and remained a dominant feature from October 1999 through March 2000.
The design of the ship-tracks 6 did not allow for monitor-ing of the cyclonic Rhodes Gyre, but the temperature showed the circular signature of the “boundary” of the anticyclonic
30 G. Fusco et al.: Variability of mesoscale features
Fig. 10. Upper layer circulation from XBT data. Numbers and letters indicate the observed features: 1-Western Alboran Gyre, 2-Algerian
Current, 3-Liguro-Provenc¸o-Catalan Current, 4-Bonifacio Gyre, 5-Tyrrhenian Current, L-Gulf of Lions Gyre, IN-Ionian Cyclone, A-South Adriatic Gyre, 12-Pelops Anticyclone, 14-Mid-Mediterranean Jet, 15-Ierapetra Anticyclone, 17-Mersa-Matruh Gyre, 18-Shikmona Gyre.
Ierapetra Gyre (Fig. 5a). Figures 3a and b show a strong signature of such a gyre penetrating down to 760 m. The Ierapetra Gyre was always detected from September 1999 to May 2000. Similar to the Pelops Gyre, Ierapetra was quite deep and narrow during the winter months. During the POEM cruises, Ierapetra was detected in October 1991 and in August–September 1987 (as strong and deep as dur-ing MFSPP), but was not evidenced in other cruises of 1985 and 1986 ( ¨Ozsoy et al., 1993). An extensive analysis of his-torical data was done by Hecht and Gertman (2001), who presented the Ierapetra Gyre as a recurrent feature whose size and intensity is varying interannually, probably linked to Cretan Water outflow (Lascaratos et al., 1999).
The signature of the Mersa-Matruh Gyre also exceeded the maximum sampling depth reached by the T6 XBTs for tracks 6 (Fig. 5a). In this feature the isotherm downwelling is not as deep as Ierapetra: the 16◦C isotherm deepens about 150 m in the core of the eddy. Track 6 further revealed that win-ter convection processes exceeded 350 m in the area north of Crete Island. The temperature difference between the Cre-tan and Levantine Seas generates a permanent front through the Cretan Straits which maintains a southwestward jet. This front is intensified during and after the winter homogeneity of the Cretan Sea, thus carrying Cretan water towards the southwest in the Levantine Sea (Lascaratos et al., 1999). The mesoscale circulation inferred from observations along the Piraeus-Alexandria track through the first six months of mon-itoring was compatible with the circulation pattern provided by Robinson et al. (1991) based on POEM observations. The slope of the isotherms suggested a geostrophic flow distribu-tion consistent with the crossing the northeast boundary of the Ierapetra Gyre in the northern part of the Levantine Sea
and dissecting the Mersa-Matruh Gyre in the southern part of the transect.
The analysis of the XBT transects, south of Cyprus (Fig. 5b) showed a very well-stratified water column with an increase in the upper homogenised layer from 40 m down to 150–200 m, from September 1999 to February 2000. The temperature of the surface water layer decreased from 27– 28◦C in September 1999 to 17–18◦C in February and March 2000. From April 2000 until May 2000 the heating of the sea surface waters gradually re-established the stratification of the surface water, with a temperature of about 21◦C. Moreover, a permanent temperature depression existed in the centre of this transect throughout the entire observation period (Fig. 5b). This depression was associated with the westward extension of the permanent anticyclonic Shikmona eddy found during the CYBO project between 1996–2000 (Zodiatis et al., 1998), as well as in the late 1980s (Brenner, 1989). The upper surface water layer down to 200 m depth at the centre of this depression was homogeneous in February 2000. This circulation feature has been defined as a quasi-stationary gyre by many authors (Malanotte-Rizzoli et al., 1997; Hecht and Gertman, 2001). However, the recent ob-servations (Zodiatis et al., 1998) suggest that the Shikmona Gyre could eventually be composed by several eddies, some-times cyclonic, somesome-times anticyclonic.
Between Ierapetra and Shikmona, large time variably fea-tures were detected. These could be interpreted as meanders or eddies merging or changing rotation sign. Such structures were also observed during the 1986 and 1987 POEM cruises and were interpreted as multiple anticyclonic centres capable of constraining the path of the water of Atlantic origin in the Eastern Mediterranean.
5 Conclusions
The main goal of the MFSPP ship-of-opportunity program was to provide data in real time for the circulation fore-cast. However, the monitoring system has produced an un-precedented data set. For the first time the evolution of the upper layer thermal structure has been monitored quasi-simultaneously on the whole Mediterranean Sea, allowing to better define the time evolution of many dynamic structures of the Mediterranean Sea and then ascertain to what extent previous conclusions (e.g. those of POEM) are valid. The overall Mediterranean circulation pattern inferred from the MFSPP observations, presented in Fig. 10 may be compared with that in Fig. 1.
One of the major results of the observation program is based on the changes observed in the Ionian Sea. This is a critical area, whose circulation pattern affects the entire Eastern Mediterranean ecosystem (Malanotte-Rizzoli et al., 1999). From thermal structures it can be inferred that the circulation in the western sector of the Ionian Sea is now cy-clonic, as was before the 1990s.
The monitoring system also showed that it is able to pro-vide a grat deal of information on the status (and evolution) of the Mediterranean oceanographic regime. Efforts have been completed and are also continuing to maintain it, at least along some critical transects, some of which have been con-tinued up to December 2000.
Acknowledgements. This work was funded by the project MAS3-CT98-0171 of the European Commission. G. Fusco and G. M. R. Manzella have also been supported by MURST 5% project “Ambi-ente Mediterraneo”. We thank the group of technicians that were in-volved with the data collection during the monitoring: A. Baldi, D. Ballas, E. Bassano, Y. Chrysanthou, R. Comas, C. Galli, G. Gelsi, M. Ioannou, E. Lazzoni, P. Loukas, M. Morgigni, L. Paraskeva, P. Renieris, G. Spaggiari, I. Trakas, C. Tsivgiouras. All the par-ticipants will remember the collaboration with L. Simic. We also extend our thanks to the Captains and crews, the Board of Direc-tors and the agents of the following ships for their valuable help and support throughout the project: City of Dublin-UK, LIPA-Losinjska Plovidba, Rijeka, Croatia, TGT Annabella and TGT Isabella-Chemikalien Seetransport GMBH Hamburg/Europea de Consignaciones Barcelona, TGT Methane Polar-Osprey Maritime International Ltd. London/Alpha Ship Barcelona, Cap Canaille-DELOM France, Excelsior-Grimaldi Italy, MSC Sariska and MSC Anastasia-Mediterranean Shipping Company Greece, Princesa Vic-toria and Princesa Marisa-Louis Cruises Lines Cyprus. The authors wish to thank E. Zambianchi for useful comments.
Topical Editor N. Pinardi thanks R. Onken and another referee for their help in evaluating this paper.
References
Astraldi, M. and Gasparini, G. P.: The seasonal characteristics of the circulation in the Tyrrhenian Sea, in: Seasonal and Interannual Variability of the Western Mediterranean Sea, (Ed) La Violette, P. E., Coastal and Estuarine Studies, 46, 115–134, 1994. Astraldi, M., Balopoulos, S., Candela, J., Font, J., Gaˇci´c, M.,
Gas-parini, G. P., Manca, B., Theocaris, A. ,and Tintor´e, J.: The role
of straits and channels in understanding the characteristics of the Mediterranean circulation, Progress in Oceanography, 44, 65– 108, 1999.
Brankart, J. M. and Pinardi, N.: Abrupt cooling of the Mediter-ranean Levantine Intermediate water at the beginning of the 1980s: observational evidence and model simulation, J. Phys. Ocean., 31, 2307–2320, 2001.
Brasseur, P., Beckers, J. M., Brankart, J. M., and Schoenauen, R.: Seasonal temperature and salinity fields in the Mediterranean Sea: climatological analyses of an historical data set, Deep Sea Res., 43, 2, 159–192, 1996.
Brenner, S.: Structure and evolution of warm core eddies in the Eastern Mediterranean Lavantine Basin, J. Geophys. Res., 94, 12 593–12 602, 1989.
Fuda, J. L., Millot, C., Taupier-Letage, I., Send, U., and Bocognano, J. M.: XBT monitoring of a meridian section across the Western Mediterranean Sea, Deep Sea Res., Part I, 47, 2191–2218, 2000. Gaˇci´c, M., Marullo, S., Santoleri, R., and Bergamasco, A.: Analy-sis of the seasonal and interannual variability of the sea surface temperature field in the Adriatic Sea from AVHRR data (1984– 1992), J. Geophys. Res., 102, C10, 22 937–22 946, 1997. Hecht, H. and Gertman, I.: Physical features of the Eastern
Mediter-ranean resulting from the integration of POEM data with Russian Mediterranean cruises. Deep Sea Res., 48, 1847–1876, 2001. JCOMM: First transition planning meeting, St Petersburg, Russian
Federation, 19–23 July, Joint WMO/IOC Technical Commission for Oceanography and Marine Meteorology, JCOMM Technical Report No. 1, 1999.
JCOMM: JCOMM Ship-of-opportunity Programme Implementa-tion Panel (SOOPIP), La Jolla, California, USA, 28–31 March, Joint WMO/IOC Technical Commission for Oceanography and Marine Meteorology, JCOMM Meeting Report No. 3, 2000. Kovaˇcevi´c, V., Gaˇci´c, M., and Poulain, P. M.: Eulerian current
mea-surements in the Strait of Otranto and in the Southern Adriatic, J. Marine Systems, 20, 255–278, 1999.
Lacombe H.: Apercus sur l’apport a l’oceanographie physique des recherches r´ecent en Mediterran´ee, in: Etude en commun de la Mediterran´ee, IOC-Unesco, 7, 161–183, 1973.
Lascaratos A., Roether, W., Nittis, K., and Klein, B.: Recent changes in deep water formation and spreading in the Eastern Mediterranean Sea: a review, Progress in Oceanography, 44, 5– 36, 1999.
La Violette, P. E.: The Western Mediterranean Circulation Experi-ment (WMCE): Introduction. J. Geophys. Res., 92, 1513–1514, 1990.
Malanotte-Rizzoli, P. and Robinson, A. R.: POEM: “Physical oceanography of the Eastern Mediterranean”, Eos Trans. AGU, The Oceanography Report, 69, 14, 196–203, 1988.
Malanotte-Rizzoli, P., Manca, B. B., Ribera d’Alcala, M., Theocharis. A., Bergamasco, A., Bregant, D., Budillon, G., Civitarese, G., Georgopoulos, D., Michelato, A., Sansone, E., Scarazzato, P., and Souvermezoglou, E.: A synthesis of the Io-nian Sea hydrography, circulation and water mass pathways dur-ing POEM-Phase I, Progress in Oceanography, 39, 153–204, 1997.
Malanotte-Rizzoli, P., Manca, B. B., Ribera d’Alcala, M., Theocharis, A., Brenner, S., Budillon, G., and ¨Ozsoy, E.: The Eastern Mediterranean in the 1980s and in the 1990s: the big transition in the intermediate and deep circulations, Dynamics of Atmosphere and Oceans, 29, 365–395, 1999.
Manca, B. B.: Recent changes in dynamics of the Eastern Mediter-ranean affecting the water characteristics of the adjacent basins,
32 G. Fusco et al.: Variability of mesoscale features
CIESM Workshop Series, 10, 2000.
Manzella, G. M. R., Bruschi, A., Cruzado, A., Fusco, G., Gaˇci´c, M., Gasparini, G. P., Gervais, T., Kovaˇcevi´c, V., Millot, C., To-nani, M., Tziavos, C., Velasquez, Z., Walne, A., Zervakis, V., and Zodiatis, G.: A Marine Information System for Ocean Pre-dictions, Ocean Forecasting: Conceptual Basis and Applications, (Eds) Pinardi, N. and Woods, J. D., 37–54, 2001.
Manzella, G. M. R., Scoccimarro, E., Pinardi, N., and Tonani, M.: Improved near real time data management procedures for the Mediterranean Ocean Forecasting System – Voluntary Observ-ing Ship program, Ann. Geophysicae, this issue, 2003.
MedAtlas Group: Specifications for Mediterranean data banking and regional quality controls, IFREMER, Direction Scientifique, Sismer-Brest, SISMER/IS/94-014, pp. 29, 1994.
MEDOC Group, Observation of formation of deep water in the Mediterranean, Nature, 227, 1037–1040, 1970.
Millot, C.: The circulation of the Levantine Intermediate Water in the Algerian Basin, J. Geophys. Res., 92, C8, 8265–8276, 1987. Millot, C.: PRIMO-0 and related experiments, Oceanologica Acta,
18, 137–138, 1995.
Millot, C.: Circulation in the Western Mediterranean Sea, Journal of Marine Systems, 20, 423–442, 1999.
Nielsen, J. N.: Hydrography of the Mediterranean and adjacent wa-ters, Rep. Dan. Oceanogr. Exp. Medit. 1, 77–192, 1912. ¨
Ozsoy, E., Hecht, A., ¨Unl¨uata, U., Brenner, S., Sur, H. I., Bishop, J., Latif, M. A., Rozentraub, Z., and Oguz, T.: A synthesis of the Levantine Basin circulation and hydrography 1985–1990, Deep Sea Research, Part II, 40, 1075–1120, 1993.
Ovchinnikov I. M.: Circulation in the surface and intermediate lay-ers of the Mediterranean. Oceanology, 6, 48–59, 1966.
Perkins, H. and Pistek, P.: Circulation in the Algerian Basin during June 1986, J. Geophys. Res., 95, 1577–1585, 1990.
Pinardi, N. and Flemming, N.: The Mediterranean Forecasting Sys-tem Science Plan, EuroGOOS Publication No. 11, Southampton Oceanography Center, Southampton, 1998.
Pollak, M. I.: The sources of deep water in the Eastern Mediter-ranean, J. Marine Research, 10, 128–152, 1951.
Poulain, P. M.: Drifter observations of the surface circulation in the Adriatic Sea between December 1994 and March 1996, J.
Marine Systems, 20, 231–253, 1999.
Robinson, A. R., Golnaraghi, M., Leslie, W. G., Artegiani, A., Hecht, A., Lazzoni, E., Michelato, A., Sansone, E., Theocharis, A., and ¨Unl¨uata, ¨U.: The Eastern Mediterranean general circula-tion: features, structure and variability, Dynamics of Atmosphere and Oceans, 15, 215–240, 1991.
Robinson, A. R. and Golnaraghi, M.: The physical and dynami-cal oceanography of the Eastern Mediterranean Sea, in: Ocean Processes in Climate Dynamics: Global and Mediterranean Ex-amples, (Eds) Malanotte-Rizzoli, P. and Robinson, A. R., 419, NATO Asi Series C. Kluwer Academic Publisher, 255–306, 1994.
Schlitzer, R.: Ocean Data View, http://www.awi-bremerhaven.de/ GEO/ODV, 2000.
Schlitzer, R., Roether, W., Oster, H., Junghans, H. G., Hausmannn, M., and Michelato, A.: Chlorofluoromethane and oxygen data in the Eastern Mediterranean, Deep Sea Research, 38, 1531–1551, 1991.
Smith, N. R., Harrison, D. E., Bailey, R., Alves, O., Delcroix, T., Hanawa, K., Keeley, B., Meyers, G., Molinari, B., and Roem-mich, D.: The role of XBT sampling in the ocean thermal net-work, OCEANOBS, 1999.
Sparnocchia, S., Picco, P., Manzella, G. M. R., Ribotti, A., Copello, S., and Brasey, P.: Intermediate water formation in the Ligurian Sea, Oceanologica Acta, 18, 2, 151–162, 1995.
Woods, J. D., Dahlin, H., Droppert, L., Glass, M., Vallerga, S., and Flemming, N. C.: The strategy for EuroGOOS, EuroGOOS Pub-lication No. 1, Southampton Oceanography Center, Southamp-ton, 1996.
W¨ust, G.: On the vertical circulation of the Mediterranean Sea, J. Geophys. Res., 66, 10, 3261–3271, 1961.
Zervakis, V., Nittis, K., Theocharis, A., and Georgopoulos, D.: The interactive relation of water column structure and mesoscale cir-culation in the Cretan Sea during the last decade, Ann. Geophys-icae, Part II, 16, C568, 1998.
Zodiatis, G., Theodorou, A. J., and Demetropoulos, A.: Hydrogra-phy and circulation in the area south of Cyprus in late summer 1995 and in spring 1996, Oceanologica Acta, 21, 3, 447–458, 1998.