HAL Id: hal-00299242
https://hal.archives-ouvertes.fr/hal-00299242
Submitted on 2 Jan 2006
HAL is a multi-disciplinary open access
archive for the deposit and dissemination of
sci-entific research documents, whether they are
pub-lished or not. The documents may come from
teaching and research institutions in France or
abroad, or from public or private research centers.
L’archive ouverte pluridisciplinaire HAL, est
destinée au dépôt et à la diffusion de documents
scientifiques de niveau recherche, publiés ou non,
émanant des établissements d’enseignement et de
recherche français ou étrangers, des laboratoires
publics ou privés.
Site investigation and modelling at ”La Maina” landslide
(Carnian Alps, Italy)
G. Marcato, M. Mantovani, A. Pasuto, S. Silvano, F. Tagliavini, L. Zabuski,
A. Zannoni
To cite this version:
G. Marcato, M. Mantovani, A. Pasuto, S. Silvano, F. Tagliavini, et al.. Site investigation and modelling
at ”La Maina” landslide (Carnian Alps, Italy). Natural Hazards and Earth System Science, Copernicus
Publications on behalf of the European Geosciences Union, 2006, 6 (1), pp.33-39. �hal-00299242�
Natural Hazards and Earth System Sciences, 6, 33–39, 2006 SRef-ID: 1684-9981/nhess/2006-6-33
European Geosciences Union
© 2006 Author(s). This work is licensed under a Creative Commons License.
Natural Hazards
and Earth
System Sciences
Site investigation and modelling at “La Maina” landslide (Carnian
Alps, Italy)
G. Marcato1, M. Mantovani1, A. Pasuto2, S. Silvano1, F. Tagliavini2, L. Zabuski3, and A. Zannoni1
1CNR-IRPI – National Research Council of Italy, Research Institute for Hydrological and Geological Hazard Prevention,
C.so Stati Uniti 4, 35127 Padova, Italy
2GRJL – Geo Risk Joint Lab, Palazzo delle Fiere, 32013 Longarone (BL), Italy
3IHEPAS – Institute of Hydro Engineering of the Polish Academy of Science,7, Koscierska Str., 80-953 Gdansk, Poland
Received: 1 August 2005 – Revised: 11 November 2005 – Accepted: 12 December 2005 – Published: 2 January 2006 Part of Special Issue “Documentation and monitoring of landslides and debris flows for mathematical modelling and design of mitigation measures”
Abstract. The Sauris reservoir is a hydroelectric basin closed downstream by a 136 m high, double arc concrete dam. The dam is firmly anchored to a consistent rock (Dolo-mia dello Schlern), but the Lower Triassic clayey formations, cropping out especially in the lower part of the slopes, have made the whole catchment basin increasingly prone to land-slides. In recent years, the “La Maina landslide” has opened up several joints over a surface of about 100 000 m2, displac-ing about 1 500 000 m3 of material. Particular attention is now being given to the evolution of the instability area, as the reservoir is located at the foot of the landslide. Under the commission of the Regional Authority for Civil Protection a numerical modelling simulation in a pseudo-time condi-tion of the slope was developed, in order to understand the risk for transport infrastructures, for some houses and for the reservoir and to take urgent mesaures to stabilize the slope. A monitoring system consisting of four inclinometers, three wire extensometers and ten GPS bench-mark pillars was im-mediately set up to check on surface and deep displacements. The data collected and the geological and geomorphological evidences was used to carry out a numerical simulation. The reliability of the results was checked by comparing the model with the morphological evidence of the movement. The mit-igation measures were designed and realised following the indications provided by the model.
1 Introduction
The Sauris Lake is a hydroelectric basin closed downstream by a 136 m high, double arc concrete dam built between 1941 and 1947. The basin stores about 50 millions m3of water over a surface of 1.5 km2. The dam is steadily anchored to a Correspondence to: G. Marcato
(marcato@irpi.cnr.it)
consistent rock (Dolomia dello Schlern), but the presence of clayey formations of Lower Trias, outcropping especially in the lower part of the slopes, have conditioned the high prone-ness of landslide to the whole catchment, inducing, espe-cially in recent periods, situations of high risk. Among these, an event which has begun since October 2002 due to a high intensity rainfall period (1000 mm in 14 days) and named “La Maina” landslide has caused the opening of several frac-tures over a surface of about 100 000 m2with a mobilisation of about 1 500 000 m3of material. The landslide represents a danger for some houses located in the unstable area on its foot as well as for the underlying provincial road (unique road from Sauris to Ampezzo) and for the reservoir that could be involved if a collapse occurs. As a consequence, under the commission of the Regional Authority for Civil Protection, a numerical modelling simulation in a pseudo-time condition of the slope was developed, in order to evaluate the risk and to take urgent mesaures to stabilize the slope. A monitoring system to control surface and deep displacements, consisting of four inclinometric cases, three wire extensometers and ten GPS pillars was set up. The data collected and the geolog-ical and geomorphologgeolog-ical evidences was used to carry out a numerical simulation using FLAC 4.0 (Itasca, 2000). A slope cross-section was divided into finite difference zones and the stress and deformation were calculated for each of them. Elasto-plastic behaviour of medium was assumed. The reliability of the results was checked by comparing them with the morphological evidence of the movement. One of the comparisons concerned the failure surface location in the in-clinometer holes and the depths calculated. The shape of cal-culated horizontal displacement curves and location of mea-sured slip zones was drawn for boreholes. Qualitative con-sistency could be seen, even if it is not ideal. This proves the assumptions and modelling procedures to be appropriate, at least on an approximate level and thus the results should be reliable.
34 G. Marcato et al.: “La Maina” landslide concerned the failure surface location in the inclinometer holes and the depths calculated. The shape
of calculated horizontal displacement curves and location of measured slip zones is drawn for boreholes. Qualitative consistency could be seen, even if it is not ideal. This proves the assumptions and modelling procedures to be appropriate, at least on an approximate level and thus the results should be reliable.
2 THE STUDY AREA
The study area is localised in the Sauris municipality in the Friuli Venezia-Giulia region in North-eastern Italy (fig. 1). The area is included in the Western Carniche Alps where the climate is moderately cold (class D of Köppen classification, Köppen, 1931). The temperatures have an annual mean of 5°C and summer maximums are between 15° and 20°C. Spring and autumn are moderately cold and winter mean values, at low altitudes, are just below 0°C.
Sáuris
Ampezzo Forni di Sopra
Forni di Sotto
Figure 1. Location of the study area Geological and geomorphological settings
The geological formations that outcrop in the study area are dated in the triassic age and the sequence sohuld be represented as follow
- red siltstone of the Werfen Formation (Scythian);
- white dolomite and the dolomitic breccia of the Lusnizza Formation (Lower Anisean); - stratified lower Serla dolomite (Lower Anisean);
- massive platform body of the upper Serla Dolomite (Medium-Upper Anisean);
- thin and discontinuous layers of limestone and anisean bacinal marls of the M. Bivera Formation (Upper Anisean);
- dolomitic limestone of the M. Tiarfin platform (Upper Anisean?-Upper Ladinian); - red limestone with ammonite (Upper Ladinian) in discontinuous strips of limited thickness; - bacinal fractions of the terrigenous Ladinian-Carnian (Upper Ladinian);
- thick Dolomia dello Schlern (Upper Ladinian); - red marls of the Raibl Formation (Carnian)
The most important tectonic discontinuity in the study area is the “linea di Sauris” that overtrust the werfen formation on the Raibl Formation.
From the morphological point of view the area is different downstream and upstream of the dam. In fact downstream there is the narrow and steep ravine of the Lumiei torrent, which flows into the Tagliamento river below the village of Ampezzo. Upstream the Sauris valley is characterised by the reservoir that masks the ravine and the morphology shows the plastic behaviour of the Werfen Formation and the valley becomes wider with gentle banks.
Fig. 1. Location of the study area.
2 The study area
The study area is localised in the Sauris municipality in the Friuli Venezia-Giulia region in North-eastern Italy (Fig. 1). The area is included in the Western Carniche Alps where the climate is moderately cold (class D of K¨oppen classifica-tion, K¨oppen, 1931). The temperatures have an annual mean of 5◦C and summer maximums are between 15◦and 20◦C.
Spring and autumn are moderately cold and winter mean val-ues, at low altitudes, are just below 0◦C.
2.1 Geological and geomorphological settings
The geological formations that outcrop in the study area are dated in the triassic age and the sequence sohuld be repre-sented as follow:
– red siltstone of the Werfen Formation (Scythian); – white dolomite and the dolomitic breccia of the
Lus-nizza Formation (Lower Anisian);
– stratified Lower Serla Dolomite (Lower Anisian); – massive platform body of the Upper Serla Dolomite
(Medium-Upper Anisian);
– thin and discontinuous layers of limestone and anisean bacinal marls of the M. Bivera Formation (Upper Anisean);
– dolomitic limestone of the M. Tiarfin platform (Upper Anisean?–Upper Ladinian);
– red limestone with ammonite (Upper Ladinian) in dis-continuous strips of limited thickness;
– bacinal fractions of the terrigenous Ladinian-Carnian (Upper Ladinian);
– thick Dolomia dello Schlern (Upper Ladinian); – red marls of the Raibl Formation (Carnian).
The most important tectonic discontinuity in the study area is the “Linea di Sauris” that overtrust the Werfen Formation on the Raibl Formation.
From the morphological point of view the area is different downstream and upstream of the dam. In fact downstream
3 THE “LA MAINA” LANDSLIDE
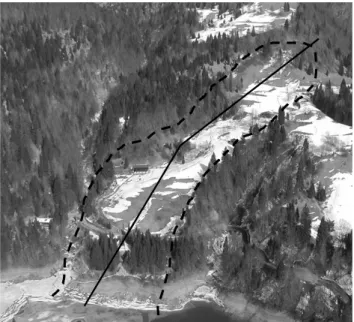
The “La Maina” landslide (fig. 2) is located some kilometers uphill from the dam, bordered by Poch stream on the right hand side, just before the Sauris villages. The phenomenon involves both the Quaternary terrains and Werfen Formation which were mobilised following a period of high intensity rainfall occurred in October 2002. The landslide represents a risk for some houses that are located in the unstable area and on its foot, for the underlying provincial road (only road from Sauris to Ampezzo) and for the lake whose basin could be involved if a collapse occurs.
Figure 2. The “La Maina” landslide. Modelling cross section is highlighted
Specifically in the area of “La Maina” there are two different Members of the Werfen Formation (Scythian), deposited in a marine environment and characterized both by facies of carbonatic platform (member Oolite and Gasteropods) and by bacinal facies (Campill member). Beneath the Werfen formation, outcropping along the bank of the lake, it is possible to recognise the main tectonic discontinuity of the area, that, at regional scale, determines the overtrust between the Scythian (Werfen Formation) and the Carnian (Raibl Formation). The Raibl Formation is almost exclusively constituted by thin layers of marls, sandstones and shales, interlayed with thin overconsolidated clays. The bibliographic reference works for the meso-triassic succession as well as for the quaternary deposits are from Pisa (1972) and Venturini (2002). The succession briefly described was undertaken principally along the Provincial Road between the area of La Maina and the bridge on the Rio Mitreichen-Poch, where it is possible to directly observe the tectonic contact of the aforementioned formations.
The geological and geomorphological survey has allowed to develop a model of the tectonical setting of the area; the presence of an high angle fault system was outlined, predominately with a NNE-SSW direction, that affect the main thrust structure (Sauris line), splitting it in diverse sectors and favouring the instability of the area. It is exactly in one of these sectors that the “La Maina” landslide occurs, In fact these disontinuities not only delineate the body of the landslide, but guide the evolution of the landslide acting as preferential lines, influencing above all the formation of the slide surface. The internal morphology of the landslide is characterised in the zone of the crown by the presence of several trenches that means that the landslide is quite active.
Fig. 2. The “La Maina” landslide. Modelling cross section is
high-lighted.
there is the narrow and steep ravine of the Lumiei torrent, which flows into the Tagliamento river below the village of Ampezzo. Upstream the Sauris valley is characterised by the reservoir that masks the ravine and the morphology shows the plastic behaviour of the Werfen Formation and the valley becomes wider with gentle banks.
3 The “La Maina” landslide
The “La Maina” landslide (Fig. 2) is located some kilometers uphill from the dam, bordered by Poch stream on the right hand side, just before the Sauris villages. The phenomenon involves both the Quaternary terrains and Werfen Formation which were mobilised after a period of high intensity rainfall occurred in October 2002. The landslide represents a risk for some houses located in the unstable area and on its foot as well as for the underlying provincial road (unique road from Sauris to Ampezzo) and for the lake whose basin might be involved if a collapse occurs.
Specifically in the area of “La Maina” there are two differ-ent members of the Werfen Formation (Scythian), deposited in a marine environment and characterized both by facies of carbonatic platform (member Oolite and Gasteropods) and by bacinal facies (Campill member). Beneath the Werfen Formation, outcropping along the bank of the lake, it is pos-sible to recognise the main tectonic discontinuity of the area, that, at regional scale, determines the overtrust between the Scythian (Werfen Formation) and the Carnian (Raibl Forma-tion). The Raibl Formation is almost exclusively constituted by thin layers of marls, sandstones and shales, interlayed with thin overconsolidated clays. The bibliographic refer-ence works for the Middle-Triassic stratigraphic sequrefer-ence as well as for the quaternary deposits are from Pisa (1972) and
G. Marcato et al.: “La Maina” landslide 35 Venturini (2002). The sequence briefly described was
un-dertaken principally along the Provincial Road between the area of La Maina and the bridge on the Rio Mitreichen-Poch, where it is possible to directly observe the tectonic contact of the aforementioned formations.
The geological and geomorphological survey has allowed to develop a model of the tectonical setting of the area; the presence of an high angle fault system was outlined, pre-dominately with a NNE-SSW direction, that affects the main thrust structure (Linea di Sauris), splitting it in different sec-tors and favouring the instability of the area. It is exactly in one of these sectors that the “La Maina” landslide occurs. In fact these disontinuities not only delineate the body of the landslide, but guide the evolution of the landslide acting as preferential lines, influencing above all the formation of the slide surface. The internal morphology of the landslide is characterised in the zone of the crown by the presence of several trenches meaning that the landslide is quite active.
4 Data collection and modelling
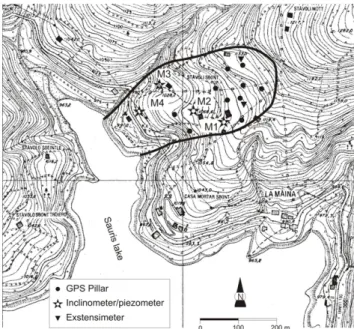
A detailed DEM of the landslide body was realised using GPS RTK technique (Hofmann-Wellenhof, et al., 2001): more than 850 points was measured within a grid at of 5– 10 m and with an accuracy of few centimeters. During the survey the location of the fractures was measured and re-ported on the DEM. At a second stage a monitoring system consisting of four inclinometric cases to control deep dis-placements, three extensometers to measure the opening of the main fractures and a network of ten GPS pillars to mea-sure surface displacements in the most representative zones of the landslide was installed (Fig. 3). During the two surveys scheduled on March 2003 and December 2003 the baselines between every benchmark and the reference station located in the near village of Lateis was measured. The differences between these baselines allowed us to quantify benchmarks’ displacements during a 8 months period. The approximate observation time on each benchmark was fixed at 20 min with a 2 s sampling rate. All the data collected were used during the numerical simulation that was carried out using FLAC 4.0 (Itasca, 2000) computer code. Slope cross-section (Figs. 2 and 4) was divided into finite difference zones, for each of them stress and deformation were calculated. Elasto-plastic behaviour of the medium with Coulomb-Mohr failure criterion was assumed.
Numerous information, both quantitative and qualitative, was available, regarding slope morphology, general soil de-scription, tectonics (thrust position), location of the ground water table. On the base of the inclinometric measurements actual slip zones were located; inclinometric tubes were also used as open standpipe piezometers and equipped with elec-tric transducers to collect continuous measurement. Frac-tures on the surface and rotation of the superficial bench-marks were measured.
According to these results, following assumptions were taken in the elaboration of numerical model:
4 DATA COLLECTING AND MODELLING
A detailed DEM of the landslide body was realised using GPS RTK technique (Hofmann-Wellenhof, et al., 2001): more than 850 points was measured within a grid at of 5-10 m and with an accuracy of few centimeters. During the survey the location of the fractures was measured and reported on the DEM. At a second stage a monitoring system consisting of four inclinometric cases to control deep displacements, three extensometers to measure the opening of the main fractures and a network of ten GPS pillars to measure surface displacements in the most representative zones of the landslide was installed (fig. 3). During the two surveys scheduled on March 2003 and December 2003 the baselines between every benchmark and the reference station located in the near village of Lateis was measured. The differences between these baselines allowed us to quantify benchmarks’ displacements during a 8 months period. The approximate observation time on each benchmark was fixed at 20 minutes with a 2 second sampling rate. All the data collected were used during the numerical simulation that was carried out using FLAC 4.0 (Itasca, 2000) computer code. Slope cross-section (figg. 2, 4) was divided into finite difference zones, for each of them stress and deformation were calculated. Elasto-plastic behaviour of the medium with Coulomb-Mohr failure criterion was assumed.
Figure 3. The “La Maina” landslide and its monitoring system
Numerous information, both quantitative and qualitative, was available, regarding slope morphology, general soil description, tectonics (thrust position), location of the ground water table. On the base of the inclinometric measurements actual slip zones were located; inclinometric tubes were also used as open standpipe piezometers and equipped with electric transducers to collect continuous measurement. Fractures on the surface and rotation of the superficial benchmarks were measured.
According to these results, following assumptions were taken in the elaboration of numerical model:
slope is divided into proper geotechnical zones (fig. 4)
values of geotechnical parameters are defined for each zone (see fig. 4) failure process is intuitively estimated (“predicted”).
Fig. 3. The “La Maina” landslide and its monitoring system.
– slope is divided into proper geotechnical zones (Fig. 4); – values of geotechnical parameters are defined for each
zone (see Fig. 4);
– failure process is intuitively estimated (“predicted”). Description of the medium from the geotechnical point of view was insufficient and it was impossible to build the proper model a priori. Thus, trial and error procedure in calculations was followed and the model was considered as definitively correct, if the results from the calculations were in quantitative or at least qualitative agreement with the infor-mation above described. It should be mentioned, that exact agreement between quantities calculated and measured (e.g. displacements) would not be reached, due to the lack of “ex-plicit time” in the elasto-plastic modelling. Thus, it could be underlined that the results of numerical simulation are only approximate, because of:
– simplifications of the numerical model;
– modelling spatial object in two dimensions (plane strain condition);
– insufficient information regarding rock/soil mass geotechnical properties;
– impossibility to recognize all heterogeneities of the medium.
5 Presentation and discussion of the calculation results In the first stage, slope without water was analysed. In such dry conditions slope is stable and after few centimetres dis-placement equilibrium conditions are reached. In the sec-ond stage actual csec-onditions were assumed, whereas in the
36 G. Marcato et al.: “La Maina” landslide
Basing on these informations, following assumptions were taken in the elaboration of numerical
model:
slope is divided into proper geotechnical zones (fig.4)
values of geotechnical parameters are defined for each zone (see fig.4)
failure process is intuitively estimated („predicted”)
1 2 3 4 5 ZONES 1 2 3 4 5 Strength parameters
Zone Density Cohesion Friction [kg/m3] [kPa] angle [ o]
Sliding zone (lower) 1.85 18 18 Sliding zone (upper) 1.85 25 25 Sliding zone (above thrust) 1.9 80 20
Thrust 1.8 25 2
Bedrock 2 500 40
2
Water table (measured)
Fig.4. Division of the slope into geotechnical zones
Description of the medium from the geotechnical point of view was insufficient and it was
impossible to build the proper model a priori. Thus, trial and error procedure in calculations was
followed and the model was considered as definitively correct, if the results from the calculations
were in quantitative or at least qualitative agreement with the information above described.
It should
be mentioned, that exact agreement between quantities calculated and measured (e.g. displacement)
would not be reached, due to the lack of “explicit time” in the elasto-plastic modelling. Thus, it
could be underlined that the results of numerical simulation are only approximate, because of:
- simplifications of the numerical model
- modelling spatial object in two dimensions (plane strain condition)
- insufficient information regarding rock/soil mass geotechnical properties
- not recognized all heterogeneities of the medium
5
PRESENTATION AND DISCUSSION OF THE CALCULATION RESULTS
Slope without water was analysed in the first stage. In such dry conditions slope is stable and after
few centimetres displacement equilibrium conditions are reached. In the second stage actual
conditions were assumed, whereas in the last (third) stage water table was increased at 6 meters in
comparison to the actual position. The main results are presented in figs.4&5.
Figure 4 shows the distribution of actual and possible (predicted) horizontal displacement. It could
be seen that presently measured water level does not trigger ultimate slope failure. Maximum
displacement is equal to about 16 cm; moreover, calculation system reaches equilibrium. Slip
surfaces obtained numerically are in approximate agreement with those from measurements and
visual observations. On the contrary, increasing of the water table in the third stage triggers great
displacements. Although the system is also equilibrated, displacements are very large and such
slope could be considered as definitively failed.
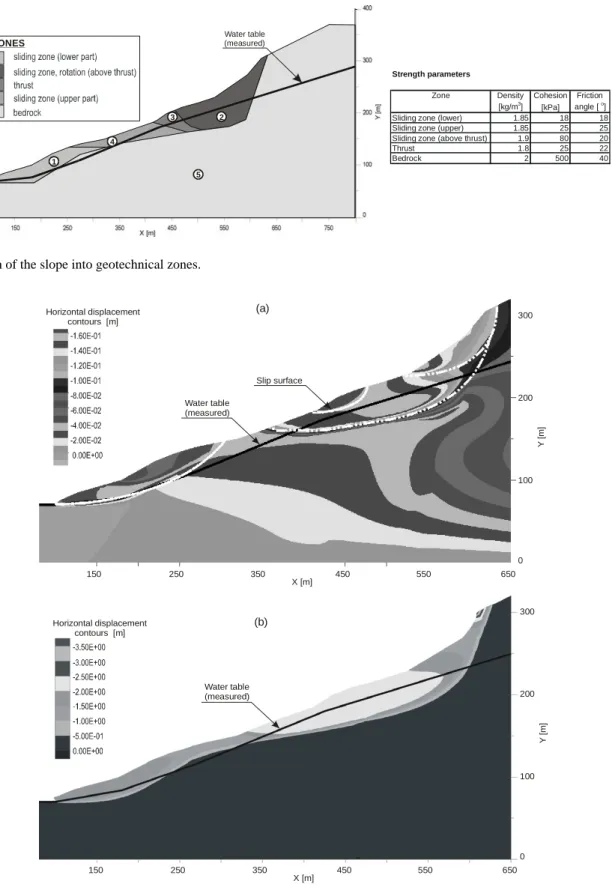
Fig. 4. Division of the slope into geotechnical zones.
Horizontal displacement contours [m] Water table (measured) Water table (measured) Slip surface Horizontal displacement contours [m] (a) (b) 150 250 350 450 550 650 X [m] 150 250 350 450 550 650 X [m] 0 100 200 300 Y [ m ] 0 100 200 300 Y [ m ]
Fig.4. Horizontal displacement of the slope, (a) actual conditions; (b) water table position lifted at 6 m compared with actual level
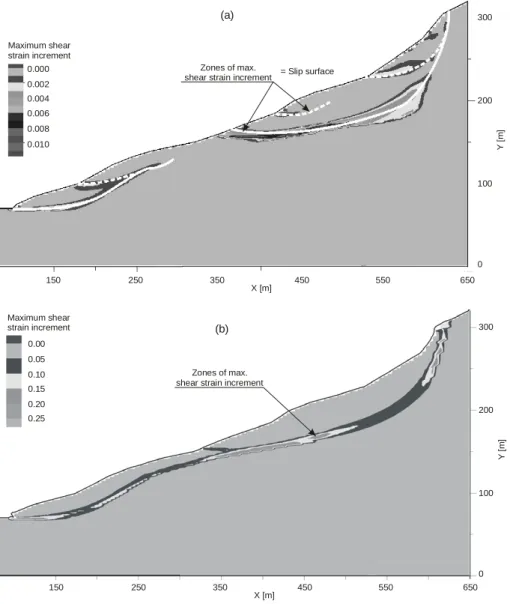
Figure 5 presents the distribution of the important index SSI (maximum shear strength increment), indicating the zones, in which most intensive shear (slip) occurs. Thus, it has great “informative” value. It could be seen that in the (b) case, slip surface is continuous, running from the slope top to the bottom, whereas in actual (a) case the surface is fragmented. It is also worth of mentioning that in the later case the SSI magnitude is 25 times greater than in the former one. It means that large landslide probably does not exist at present, but if the water table would increase, creation of such process would be highly probable.
Fig. 5. Horizontal displacement of the slope, (a) actual conditions, (b) water table position lifted at 6 m compared with actual level.
last (third) stage water table was increased at 6 m in compar-ison to the actual position. The main results are presented in Figs. 5 and 6.
Figure 5 shows the distribution of actual and possible (predicted) horizontal displacement. It could be seen that presently measured water level does not trigger ultimate
G. Marcato et al.: “La Maina” landslide 37 Maximum shear strain increment = Slip surface Maximum shear strain increment Zones of max. shear strain increment
Zones of max. shear strain increment
(a) (b) 0.000 0.002 0.004 0.006 0.008 0.010 0.00 0.05 0.10 0.15 0.20 0.25 150 250 350 450 550 650 X [m] 150 250 350 450 550 650 X [m] 0 100 200 300 Y [ m ] 0 100 200 300 Y [ m ]
Figure 6. Maximum shear strain increment, (a) actual conditions; (b) water table position lifted at 6 m compared with actual level
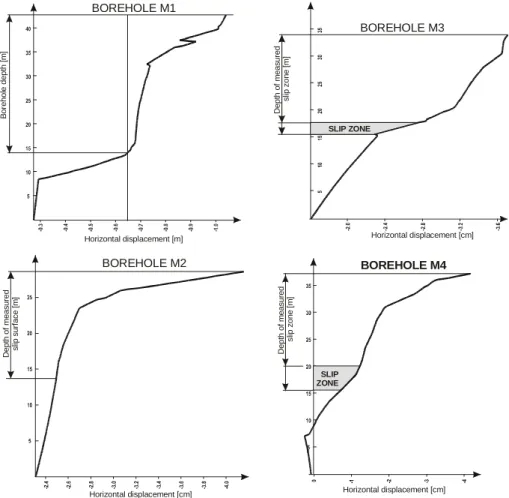
Other information provided by the model are that in the actual conditions to landslide bodies are present and that the upper one moves faster and with and greater magnitude than the lower one. In these conditions the upper body create an overpressure that increase the instability of the lower body. The reliability of the results was checked by their comparison with the “signs” of the process occurring in nature. One of them is the comparison of failure surface location in the inclinometer holes with the depths calculated. The results are shown in fig.6. The shape of calculated horizontal displacement curves and location of measured slip zones is drawn for boreholes. The qualitative
Fig. 6. Maximum shear strain increment, (a) actual conditions, (b) water table position lifted at 6 m compared with actual level.
slope failure. Maximum displacement is equal to about 16 cm; moreover, calculation system reaches equilibrium. Slip surfaces obtained numerically are in approximate agree-ment with those from measureagree-ments and visual observations. On the contrary, increasing of the water table in the third stage triggers great displacements. Although the system is also equilibrated, displacements are very large and such slope could be considered as definitively failed.
Figure 6 presents the distribution of the important in-dex SSI (maximum shear strength increment), indicating the zones, in which most intensive shear (slip) occurs. In other words, this index determines position of the slip surface. Thus, it has great “informative” value. It could be seen that in the (b) case, slip surface is continuous, running from the slope top to the bottom, whereas in actual (a) case the surface is fragmented. It is also worth of mentioning that in the later case the SSI magnitude is 25 times greater than in the former one. This means that large landslide probably does not exist at present, but if the water table would increase, creation of such process would be highly probable.
Other information provided by the model are that in the actual conditions two landslide bodies are present and that the upper one moves faster and with greater magnitude than the lower one. In these conditions the upper body creates an overpressure that increases the instability of the lower body. The reliability of the results was checked by their comparison with the “signs” of the process occurring in nature. One of them is the comparison of failure surface location in the in-clinometer holes with the depths calculated. The results are shown in Fig. 7. The shape of calculated horizontal displace-ment curves and location of measured slip zones is drawn for boreholes. The qualitative agreement could be seen in M3 and M4 boreholes. The depth of calculated slip surface in M1 borehole is greater than the depth of the borehole. Thus, comparison is impossible in this case. The agreement of measured and calculated slip surfaces is not evident in M2 borehole. It proves the appropriateness of the assumptions and modelling procedures, at least on the approximate level and thus the reliability of the results.
38 agreement could be seen. It proves the appropriateness of the assumptions and modelling G. Marcato et al.: “La Maina” landslide
procedures, at least on the approximate level and thus the reliability of the results.
B o re h o le d e p th [ m ] Horizontal displacement [m] Horizontal displacement [cm] D e p th o f m e a s u re d s lip s u rf a c e [ m ] BOREHOLE M1 BOREHOLE M2 SLIP ZONE Horizontal displacement [cm] Horizontal displacement [cm] D e p th o f m e a s u re d s lip z o n e [ m ] D e p th o f m e a s u re d s lip z o n e [ m ] SLIP ZONE BOREHOLE M3 BOREHOLE M4
Figure 7. Comparison of the calculated horizontal displacement curves with the location of the slip zones in inclinometer boreholes
6 CONCLUSIONS
The high risk caused by “La Maina” landslide forced a type of investigation that could provide reliable results in short time. The monitoring system was important both to evaluate the hazard of the landslide and to collect data for the model. The survey and modelling allowed to recognize that at present there are 2 distinct landslide’s bodies. Since an increasing of the water table seems to be unreasonable with the data collected it’s not expected that sudden failure of the slope occurs. The good agreement between the model and the geological and morphological evidences outlined the proper mitigation measures. The urgent consolidation was focused in the lower part of the landslide where the elements at risk are located. Using naturalistic engineering the Corpo Forestale dello Stato has installed a system of superficial drainage and has consolidated the slope in order to avoid the erosion by the Poch stream (fig.8). For the upper body of the landslide a complex drainage system is planned for the future.
Fig. 7. Comparison of the calculated horizontal displacement curves with the location of the slip zones in inclinometer boreholes.
Figure 8. Lower part of the “La Maina” landslide after the consolidation
REFERENCES
Canuti, P., Casagli, N. 1994. Consideration on landslide hazard assessment. Atti Conv. Bologna, 27 maggio 1994, CNR-GNDCI, pubbl. 846. (“in Italian”).
Crescenti, U. 1998. Landslide risk: notes of assessment. Quaderni di Geologia Applicata 5(2): 87-100 (“in Italian”). Fell, R. 1994. Landslide risk assessment and acceptable risk. Canadian Geotechnical Journal 31(2): 261-272. Köppen, W. 1931. Grundriss der Klimakunde. 2a edit., Berlin: W. De Gruyter.
Heinimann, H.R., Holtenstein, K., Kienholz, H., Krummenhacher, B., Mani, P. 1998. Methoden zur analyse und bewertung von naturgefahren. Umwelt-Materialien 85, Naturgefahren. Bern: BUWAL.
Hofmann-Wellenhof, B. ,Lichtenegger, H. ,Collins, J. 2001. GPS Theory and practice. 5a revised edit., Wien: Springer
Verlag.
Itasca (2000), FLAC 4.0 User’s Manual, Itasca Consulting Group Inc., Minneapolis
Pisa, G. 1972. Geological settings of the northern mountains of Forni di Sotto (Western Carnia). Giorn. Geol. Ser 2, 38 (2), 543-691 (“in Italian”).
Pisa, G. 1974. Paleoenvironmental and paleostructural reconstruction of medium Trias carbonatic platform deposits of southwestern Carniche Alps. Mem. Soc. Geol. It. 13: 35-83 (“in Italian”).
Venturini C. 2002. Geological map of the Carnic Alps. Museo Friulano di Storia Naturale.
Fig. 8. Lower part of the “La Maina” landslide after the
consolida-tion.
6 Conclusions
The high risk caused by “La Maina” landslide forced a type of investigation that could provide reliable results in short time. The monitoring system was important both to evaluate the hazard of the landslide and to collect data for the model. The survey and modelling allowed to recognize that at present there are two distinct landslide’s bodies. Since an increasing of the water table seems to be unreasonable with the data collected, a sudden failure of the slope is not expected. The good agreement between the model and the geological and morphological evidences outlined the proper mitigation measures. The urgent consolidation was focused on the lower part of the landslide where the elements at risk are located. Using naturalistic engineering the Corpo Forestale dello Stato has installed a system of superficial drainage and has consolidated the slope in order to avoid the erosion by the Poch stream (Fig. 8). For the upper body of the landslide a complex drainage system is planned for the future.
Edited by: G. Lollino
G. Marcato et al.: “La Maina” landslide 39 References
K¨oppen, W.: Grundriss der Klimakunde, 2a edit., Berlin, W. De Gruyter, 1931.
Hofmann-Wellenhof, B., Lichtenegger, H., and Collins, J.: GPS Theory and practice, 5a revised edit., Wien, Springer Verlag, 2001.
Itasca: FLAC 4.0 User’s Manual, Itasca Consulting Group Inc., Minneapolis, 2000.
Pisa, G.: Geological settings of the northern mountains of Forni di Sotto (Western Carnia), Giorn. Geol. Ser., 2, 543–691 (in Italian), 1972.
Venturini, C.: Geological map of the Carnic Alps, Museo Friulano di Storia Naturale, 2002.