HAL Id: hal-00299096
https://hal.archives-ouvertes.fr/hal-00299096
Submitted on 1 Jan 2003
HAL is a multi-disciplinary open access
archive for the deposit and dissemination of
sci-entific research documents, whether they are
pub-lished or not. The documents may come from
teaching and research institutions in France or
abroad, or from public or private research centers.
L’archive ouverte pluridisciplinaire HAL, est
destinée au dépôt et à la diffusion de documents
scientifiques de niveau recherche, publiés ou non,
émanant des établissements d’enseignement et de
recherche français ou étrangers, des laboratoires
publics ou privés.
for coastal hazard analysis and disaster management
planning, Gulf of Corinth, Greece
M. Papathoma, D. Dominey-Howes
To cite this version:
M. Papathoma, D. Dominey-Howes. Tsunami vulnerability assessment and its implications for coastal
hazard analysis and disaster management planning, Gulf of Corinth, Greece. Natural Hazards and
Earth System Science, Copernicus Publications on behalf of the European Geosciences Union, 2003,
3 (6), pp.733-747. �hal-00299096�
© European Geosciences Union 2003
and Earth
System Sciences
Tsunami vulnerability assessment and its implications for coastal
hazard analysis and disaster management planning, Gulf of
Corinth, Greece
M. Papathoma1and D. Dominey-Howes2
1Coventry Centre for Disaster Management, School of Science and the Environment, Coventry University, CV1 5FB,
Coventry, UK
2Risk Frontiers, Department of Physical Geography, Macquarie University, Sydney, NSW 2109, Australia
Received: 19 June 2003 – Revised: 19 August 2003 – Accepted: 31 August 2003
Abstract. We apply a new tsunami vulnerability assessment
method to two coastal villages in the Gulf of Corinth, Greece using the 7th February 1963 tsunami as a worse case sce-nario. In Akoli, 46.5% of all buildings are classified highly vulnerable (BV). Approximately, 26.3% of all households are located within buildings with a High BV classification whereas 85% of all businesses are located within buildings with a High BV classification and 13.7% of the population is located within buildings with a High BV classification. In Selianitika, 28.8% of all buildings are classified with a High BV and 11% of all households are located within buildings with a High BV classification. Also 29.3% of all businesses and 33.4% of all services are located within buildings with a High BV classification and 6.7% of the population is lo-cated within buildings with a High BV classification. We estimate the minimum costs of a hypothetical tsunami with a wave run-up (H (m)max) of +5 m. The results are
con-sidered significant because they have important implications for coastal risk assessment, resource allocation and disaster management planning.
1 Introduction and background
Greece has long been affected by tsunami and more than 160 events have been catalogued for the last 3500 years (Pa-padopoulos, 2001). Due to changes in the style and den-sity of occupation and utilisation of the coastal zone within Greece, it has recently been suggested that the potential im-pacts of future tsunami are likely to be much greater than in the past (Dominey-Howes, 2002). It is therefore impera-tive to determine to what level selected coastal segments of Greece are at risk from, and vulnerable to, tsunami inunda-tion and impacts. Scientists will be interested in the spatial and temporal distribution of tsunami events, their generative mechanisms and frequency-recurrence periods. Disaster and
Correspondence to: D. Dominey-Howes
(ddominey@els.mq.edu.au)
emergency planners will be interested in determining maxi-mum on-shore wave heights (vertical wave run-up) and the effects of wave flooding in terms of numbers and types of injuries and deaths, the disruption to normal activities, and the need for response, recovery and rehabilitation activities. Urban planners are likely to be concerned with understand-ing patterns of coastal floodunderstand-ing so as they may: (1) iden-tify and develop appropriate land-use zones and (2) formu-late and apply effective construction codes. Lastly, insur-ance and reinsurinsur-ance companies are likely to be interested in frequency-magnitude relationships as they relate to deter-mining risk and exposure and the establishment of suitable insurance premium levels.
Examination of published tsunami risk maps indicates that tsunami flood risk (and therefore damage to people and struc-tures) is traditionally assumed to be uniform within the ex-pected flood zone (e.g. Papadopoulos and Dermentzopou-los, 1998; Ganas et al., 2001). However, recently it has been shown that population and infrastructure within a given flood zone are not uniformly at risk (Papathoma, 2003; Papath-oma et al., 2003). This is because risk, that is the probabil-ity of damage, is intimately related to vulnerabilprobabil-ity, which measures the potential for damage. Vulnerability in turn, is related to a series of parameters that include amongst oth-ers: the presence of on and off-shore protective barriers and flood defences, distance from the shore, depth of flood wa-ter, building construction standards, preparedness activities, socio-economic status and means, level of understanding and hazard perception and amount of warning and ability to move away from the flood zone.
Here, we report the results of an assessment of tsunami vulnerability for a coastal segment from the south shore of the Gulf of Corinth, Greece. This study has been under-taken for three reasons: (1) the Gulf of Corinth is one of the most tsunamigenic areas of Greece and has been iden-tified as an area at risk from future tsunami occurrence; (2) we wished to apply a new tsunami vulnerability assessment method (hereafter referred to as the “Papathoma Method”) to a new coastal area of Greece. This would then allow some
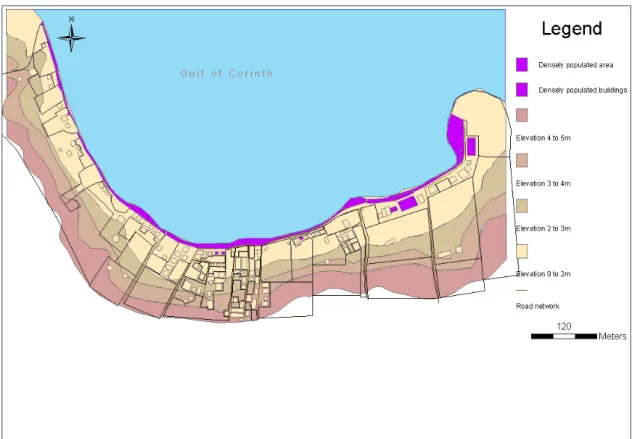
as-Fig. 1. Map of the field sites.
sessment of its ease of application in different coastal areas and whether vulnerability truly is spatially and temporally variable as previously reported and (3) the regional disaster plan under the code name “Xenokratis” does not contain any reference to tsunami events. Furthermore, to our knowledge, land-use planning and integrated coastal zone management strategies fail to consider the potential role of extreme haz-ards in coastal planning and management.
2 The Gulf of Corinth and estimates of tsunami hazard probability
The Gulf of Corinth is one of the most seismically active places in the world (Ambraseys and Jackson, 1997). The seismogenic belt that lies from Patras to Corinthos is 130 km long and 30 km wide (Koukouvelas, 1998). The Gulf of Corinth is a 100 km × 25 km active asymetrical graben and is about 850 m deep (Papatheodorou and Ferentinos, 1997; Soter, 1998). The central part of this graben separates the alpine basement of central Greece from that of the Pelopon-nesos (Lekkas et al., 1998). The area is undergoing N–S ex-tension and its geomorphology is the result of footwall up-lift and hanging wall subsidence of a number of normal ac-tive faults (Papatheodorou and Ferentinos, 1997; Lekkas et
al., 1996). Tsunamis that have been recorded in the Gulf of Corinth are usually associated with submarine sediment slides triggered either by heavy rainfall or seismic activity (Postma, 1995). This paper focuses on the coastline stretch-ing from Aeghio (often referred to as Aeghion or Egio) west-ward as far as the village of Lambiri (Fig. 1). Firstly, we out-line the tsunami hazard probability for the Gulf of Corinth; secondly, review the evidence for and impacts of the 7th February 1963 tsunami and thirdly, apply the “Papathoma Method” of tsunami vulnerability assessment to two villages on the coast using the 1963 tsunami as a worse case scenario. The Gulf of Corinth has a long record of tsunami events. Some of them are listed in Table 1. Interestingly, it has been suggested that the spatial distribution of tsunami oc-currences in the Gulf is focused in the west and decreases to the east (Papadopoulos, 2003). In fact, nine out of twenty tsunami (45%), as well as the most powerful events, were recorded within the western part of the Gulf of Corinth. In contrast, the temporal distribution of the tsunami events is random. However, from the historical dataset of tsunamis in the Gulf, it has been possible to calculate the probabil-ity (return periods) for tsunami of different intensprobabil-ity. From an analysis of this dataset, tsunami with a maximum inten-sity or Ko (on the Ambraseys-Sieberg six grade Intensity
Table 1. Tsunami events in the Gulf of Corinth (Y = year, M = month, D = day. Generating cause: ER = submarine earthquake,
EA = earthquake associated, EL = earthquake landslide, ES = earthquake generated submarine sediment slide, GS = gravitative marine slide, Ko=Intensity). It is worth noting that no tsunami are reported for the period 373 BC to AD 552 and from AD 552 to AD 1402. Data from Papadopoulos (1998, 2003)
Y M D Cause Sub-region Short description Ko Run-up (m)
373 BC 05 ER West Corinth Gulf Destructive inundation V ?
AD 552 05 ER IV ?
AD 1402 06 ER Corinth Gulf Destructive inundation IV ?
AD 1742 02 20 ER Corinth Gulf Flooding in Vostiza III ?
AD 1748 05 25 ER West Corinth Gulf Damaging waves in Aeghio IV 10.00
AD 1769 ER Corinth Gulf Sea retreated in Desfina II ?
AD 1794 06 11 EL Corinth Gulf Strong inundation III 3.00
AD 1817 08 23 ER West Corinth Gulf Destructive inundation IV 1.5 m
AD 1858 02 21 ER Corinth Gulf Sea wave ? ?
AD 1861 12 26 EL West Corinth Gulf Damaging waves in Aeghio III 2.10
AD 1887 10 03 ER Corinth Gulf Sea wave in Galaxidi II ?
AD 1888 09 09 ER Corinth Gulf Sea wave in Galaxidi II ?
AD 1898 06 02 EA Corinth Gulf Sea waves III ?
AD 1928 04 22 EA East Corinth Gulf Sea inundation III 2.10
AD 1963 02 07 GS West Corinth Gulf Destructive waves in Aeghio IV 5.00
AD 1965 07 06 EL West Corinth Gulf Strong wave in Eratini III 3.00
AD 1981 02 24 ER East Corinth Gulf Weak wave II 0.30
AD 1984 02 11 ES West Corinth Gulf Strong wave in Sergoula III ?
AD 1995 06 15 ER West Corinth Gulf Sea wave in Eratini III ?
AD 1996 01 01 GS West Corinth Gulf Sea wave in Aeghio IV ?
Scale, Ambraseys, 1962) of II or larger, occur on average, every 16 years. The return periods of tsunamis with tensity III or larger is 40 years, whereas tsunamis with in-tensity IV or larger occur on average, every 103 years (Pa-padopoulos, 2003). No tsunamis are reported within the his-torical dataset with intensities of V or VI. Of equal impor-tance is an estimate of the likely wave height (or run-up) on-shore for tsunami of intensity II, III and IV. Wave heights for all known tsunami were averaged and maximum wave heights H (m)maxdetermined for intensity (Ko) II as +1 m,
for (Ko) III as +2 m, for KoIV as +4 m, for KoV as +8 m
and for KoVI as +16 m (Soloviev, 1978). Since these
cal-culations are more than 20 years old and relate to tsunami from all over the world, using the data from Papadopoulos (2001) and Soloviev et al. (2002) which is the most complete dataset for our study area, we recalculate the mean H (m)max
for all tsunami (KoII to IV) for the Gulf of Corinth alone.
We therefore calculate that the H (m)maxfor intensity (Ko) II
is +0.3 m, for (Ko) III is +2.55 m and for (Ko) IV is +5.5 m.
This follows the convention established in (Papathoma et al., 2003) and is useful because it permits direct comparison of tsunami impacts between different coastal segments within Greece.
Catalogues of historic tsunami were examined and those that impacted the study area were selected. By collecting information about these events it was possible to identify the extreme inundation zone as the area between the coast-line and the contour of the highest ever documented/recorded wave. In our study area the inundation zone is defined as the
area between the coastline and the 5 m contour since this is the run-up height calculated for the largest tsunami of KoIV.
In our study, we ignore the tsunami of AD 1748 with a re-ported run-up of +10.00 m even though this is the largest run-up recorded in the historical dataset. We exclude this event because there is insufficient data available concerning the exact locations affected by this tsunami; we are unable to verify the original sources thus making it impossible to cross-check the accuracy of the run-up data and it has been clearly demonstrated that for the Greek region, data relating to his-torical tsunami events is notoriously unreliable (Dominey-Howes, 2002). This correlates with the well documented tsunami of the 7th February 1963 (Papadopoulos, 2003; Pa-pathoma, 2003; Galanopoulos et al., 1964). Therefore, the worse case scenario has a H (m)maxof +5 m and correlates
with a tsunami intensity of Ko IV. The purpose of this
pa-per is not to consider physical mechanisms or hydrodynamic characteristics of tsunami during generation, propagation or inundation, but to identify and quantify the vulnerability to a hypothetical tsunami achieving a +5m wave run-up in a de-terministic way. Therefore, we do not consider factors such as tsunami source region, direction of wave approach, off-shore bathymetry, coastal configuration, coastal geomorphol-ogy and hydrodynamic processes during inundation as these parameters are of concern more to theoretical modelers.
In the following section, we describe the tsunami of 7th February 1963 and its effects since this represents the worse case tsunami event utilised within the present study.
3 The tsunami of 7th February 1963
The tsunami of 7th February 1963 is a well-documented event generated by a submarine sediment slide triggered by a small earthquake. Building damage, coastal erosion and esti-mates of distances of horizontal inundation and wave height were recorded (Galanopoulos et al., 1964). In this paper, we use the term “run-up” since this is the correct term to describe this component of tsunami action. The tsunami wave oc-curred at 21:28 LT and affected several villages on the coast west of Aeghio. The places where the most damage and in-juries are recorded were the port of Aeghio, and the coastal villages of Akoli, Selianitika (which includes part of Logos) and Lambiri. There are no official records from the local au-thorities concerning the actual number of houses damaged, nor of the nature of the damage. There is also no informa-tion on the exact locainforma-tion of the buildings affected nor on the costs of repair or reconstruction. However, the follow-ing paragraphs provide a description of the impacts of the 1963 tsunami on the four coastal villages most affected. It is worth noting that a numerical simulation of the 1963 tsunami by Koutitas and Papadopoulos (1998) reproduced very well the field observations of Galanopoulos et al. (1964).
In Aeghio (Fig. 1) the wave was of greatest intensity on the eastern part of the bay where horizontal inundation in-land reached 30 to 40 m and the vertical wave run-up reached
+3 m a.s.l. (metres above sea level). The wave reached the roof of the church of “Agios Nicholaos” and destroyed it. Two fishing boats were swept inland and damaged. A house and a tannery were flooded and two people were injured. At the centre of the bay the inundation of the water inland did not exceed the +2 m contour and it caused no damage. The western side of the bay appears to have received a reflection of the initial wave, which had a run-up height of +2 m a.s.l. Horizontal inundation was approximately 60 to 80 m inland. Six fishing boats were swept 10 to 12 m inland and two other fishing boats were found 30 to 40 m inland. According to local people, there were two waves, the initial one and the reflected one. There was also a noise before the waves struck. In Akoli (Fig. 1) horizontal inundation at the eastern end of the bay was to a distance of more than 100m from the shoreline. Traces of water were found on walls at a height of +2.5 m a.s.l. indicating a minimum vertical wave run-up. The fence of a building was swept away and the person in-side the building was injured. In the western part of the bay, the wave caused erosion of coastal sediments. The tsunami caused most damage in the centre of the bay where the wave height must have been +4.5 m a.s.l. (Galanopoulos et al., 1964). Seaweed was found on the top of lemon trees (2.5 m above the ground) at a distance of 90 m from the shoreline (Galanopoulos et al., 1964). Horizontal inundation was 250 to 300 m inland and the sea-water destroyed 30 lemon trees. The force of the tsunami caused the destruction of wooden floors within some of the houses. House contents were swept out to sea by the receding waters. At least 3 000 kg of olive oil was lost and a 200 kg monolith was moved a distance of 4.5 m from its original position. At a distance of 120 m from
the coastline many pebbles, fish and shells were found. Large quantities of cobbles and pebbles were deposited close to and inland of the beach. Parts of the beach were eroded and else-where a terrace 50 cm high and 10m long was deposited by the tsunami. The volume of beach material that was eroded was estimated at 20 to 25 m3.
The wave had the greatest impact in the village of Selian-itika (Fig. 1). The bay where the village is located is very shallow and the sea is only −4 m and 30 m in depth at dis-tances of 300 and 600 m from the coastline respectively. In the central part of the bay, horizontal inundation reached 40 m from the shoreline. The wave broke the doors and win-dows of several houses and swept away their contents. De-posits of sand and pebbles were found in some of the build-ings. At 10 to 15 m from the coastline, vertical wave run-up reached +3 m a.s.l. An iron container that weighed 1 tonne was moved horizontally a distance of 5 m and three fishing boats were swept 25 m inland. Inundation at the eastern end of the bay reached 40 m inland causing damage to houses. In fact, one of them totally collapsed. At the western end of the bay the inundation was 100 to 120 m inland and vertical wave height was estimated to be at least +4 m. Tsunami erosion of sediment uncovered the foundations of several houses. The coastal vineyards were damaged and 8 fishing boats were swept away and damaged. Between 6000 and 7000 kg of olive oil were lost and seven people were injured. Selianitika was struck by three waves and the first is reported to have been the strongest.
At Lambiri, the bay is relatively shallow and the depth of water only reaches −2 m at 200 to 300 m from the shoreline. Horizontal inundation of water in the central part of the bay was to a distance of 50 to 110 m. The tsunami is estimated to have had a vertical wave run-up of +4 m a.s.l. The phe-nomenon began with a withdrawal of the sea to a distance of 30 m from the coast. The coastline was then struck by three waves. Two coastal houses and the facilities of a camping site suffered damage and fishing boats were swept inland and de-stroyed. A 150 kg fridge was moved a distance of 50 m and a 700 kg fridge was overturned. A 3 m stretch of the beach front was eroded.
At locations east and west of Cape Salmenikos (Fig. 1) the wave run-up height was estimated to have exceeded
+6 m a.s.l. since seaweed was found 100 m away from the coastline and at altitudes of at least +2.20 m above the ground (Galanopoulos et al., 1964). However, the exact lo-cations of these observations are not provided making it dif-ficult to cross-check the information provided by the original authors.
Fortunately, only two deaths were caused by the tsunami due to its time of occurrence (late in the evening) and the fact that it occurred during the winter. It is interesting to wonder had the tsunami occurred during the day in summer time, whether many more casualties and fatalities would have been recorded due to the dense occupation of the near-shore coastal zone.
In this paper, a new tsunami vulnerability assessment methodology, the “Papathoma Method”, is applied to Akoli
Plate 1. Caf´e located on the coast of Akoli. Note how close it (and
buildings on the far coast) are to the waters edge. Many of these buildings have no protection from coastal floods.
Plate 2. The beach at Selianitika in July 2001. During the summer
period, the beach is densely populated. Once again, many of the buildings that fringe the coastline are extremely close to the waters edge and lack protective flood barriers.
and Selianitika only, due to their size and diversity of build-ing use. Today, Akoli is a tourist resort that is extremely busy in the summer. The coastal area immediately adjacent to the shoreline is full of cafes and restaurants (Plate 1). The contemporary beach is either very narrow or in some places, does not exist at all. The houses that face the shoreline are not protected by fences or walls and the distance to higher ground is quite considerable since the village occupies a flat area. Selianitika is an important tourist place attracting fam-ilies and elderly people as it is famous for its curative baths. Many hotels and restaurants are situated on the coastal plain just a few meters away from the present shoreline (Plate 2).
4 Methodology
It has recently been recognised that tsunami risk and vul-nerability assessment has traditionally been rather simplistic (Papathoma, 2003; Papathoma et al., 2003). It has further been noted that previous studies do not consider
vulnerabil-ity to be dynamic (Papathoma et al., 2003). It has also been realised that it is generally accepted that all buildings and spaces within a potential inundation zone are uniformly at risk. However, recent work has demonstrated that vulnera-bility actually has a very dynamic component dependent on a number of parameters (Papathoma et al., 2003). These au-thors illustrated their arguments by examining the tsunami vulnerability of Heraklio city, Crete Island, Greece. Here, the vulnerability assessment method developed in (Papath-oma, 2003) is applied to our study villages within the Gulf of Corinth.
In the present study, the following methodological steps are undertaken:
A Identification of the Inundation Zone and Inundation Depth Zones
We select two of the coastal villages that were affected by the 1963 tsunami to undertake our tsunami vulnera-bility assessment because: (1) the area is at significant risk from future tsunami inundation (see Sect. 2 above); (2) the area was badly affected by the 1963 tsunami; (3) the villages affected by the 1963 event have devel-oped significantly since the last event and (4) there are no specific tsunami disaster plans for the area.
The greatest wave height for the 1963 tsunami recorded in the area was 5 m (Galanopoulos et al., 1964). In this study the inundation zone is considered to be the area between the coastline and the 5m contour, ignoring the direction of tsunami approach and the bathymetry of the seabed. This is not considered to be necessary because: (a) it is not a specific wave that is simulated but a
wave’s impacts on the coastal community;
(b) in most tsunami-prone areas, historic events had different sources and;
(c) in most coastal areas it is hard to get data regarding the bathymetry at an appropriately detailed scale. Obtaining bathymetric data of this scale could be time consuming and very expensive. This would make the methodology unattractive for local au-thorities to use.
This study is interested in applying a method that is easy to utilise by different end-users and flexible enough to be applied in other places of the world. This study con-siders the identification of the inundation zone without taking into consideration the tsunami source and off-shore bathymetry in order to be simple, easy and realis-tic. The run-up does not equal the tsunami height on the shore and the run-up heights will show variation along the coastline due to several factors (Camfield, 1994). Since the run-up cannot be calculated, the safest option for the identification of the potential inundation zone is to define it as the area between the coastline and the con-tour of the highest recorded tsunami. Therefore in an area where the highest recorded tsunami was 5 m, the in-undation zone will be the area between the coastline and
Table 2. The criteria, their ranking and weight factor
Criteria Weight factor
Building material 7
Row 6
Surroundings 5
Condition of ground floor 4
Number of floors 3
Sea defence 2
Natural environment 1
the 5 m contour. It is understood that the depth of wa-ter during a tsunami will differ according to the ground elevation. Therefore, the inundation zone in each vil-lage will be divided into Inundation Depth Zones or IDZs on the basis of the topographic contours: High IDZ (ground elevation 0 − 2 m), Medium IDZ (ground elevation 2 − 3 m), Low IDZ (ground elevation 3 − 4 m) and Very Low IDZ (ground elevation 4 − 5 m). The IDZs are used as a background for the maps that display the spatial distribution of the vulnerability of individual buildings. It is understood that buildings located within the high IDZ will have to be the priority of the local au-thorities/ emergency planners etc. since the damage of the buildings will be more significant.
B Identification of factors that affect the vulnerability of buildings and people and collection of data
Field surveys of tsunami events such as the 1992 Flores tsunami, the 1993 Hokkaido tsunami and the 1994 Java tsunami (Maramai and Tinti, 1997; Tsuji et al., 1995; Shimamoto et al., 1995) demonstrate the importance of several characteristics of buildings that contribute to their vulnerability. These characteristics were identified and collected for each building within the potential in-undation zone together with data concerning the popu-lation, building use and so forth. For further information on these factors, the generation of the primary database, the coverages digitized and the use of the Geographi-cal Information System, readers are referred to (Papath-oma et al., 2003). The empirical data were collected in July 2001. At this time of the year the villages are full of tourists that gather at the coastline during the day and evening.
C Calculation of the vulnerability of individual buildings within the inundation zone using a Multi criteria evalu-ation method
The data collected for each building and open space may be divided into three categories:
(a) quantitative (population, population density, num-ber of households);
(b) qualitative (condition, building surroundings, natu-ral environment, etc.) and
(c) descriptive (e.g. land use).
The qualitative data are used for the calculation of the vulnerability of individual buildings. The first step is the standardisation of the raw data collected using the following formula:
Standardized score I = raw score I / maximum raw score Since the factors do not affect vulnerability equally, they have to be ranked according to their importance. The criteria are arranged in order of importance and a weight factor is applied (Table 2). The importance of the crite-ria is connected with the mitigation measures that may be taken. This is why the criteria that are concerned with the condition of the house are higher in the range of importance than the criteria that relate to the location. This is because it is felt that the condition of the house can change more easily and with less cost than its lo-cation. Relocation of buildings, construction of break waters and sea defences or coastal engineering works are frequently very expensive. On the other hand, rein-forcement of buildings and protection with surrounding walls is easier and cheaper and may protect the building from other types of natural disasters.
The vulnerability of each building (BV) in the inunda-tion zone is then calculated as follows:
BV = (7xa)+(6xb)+(5xc)+(4xd)+(3xe)+(2xf)+(1xg) Where:
(a) the standardised score that is related to the material of the building;
(b) the standardised score that is related to the row of the building;
(c) the standardised score that is related to the number of floors of the building;
(d) the standardised score that is related to the building surroundings;
(e) the standardised score that is related to the condition of the ground floor of the building;
(f) the standardised score that is related to the presence of sea defence in front of the building and;
(g) the standardised score that is related to the width of the intertidal zone in front of the building.
The Human Vulnerability (HV) of each building is calculated according to the following equation:
HV = BV x P (where P = Population).
D Display of Building Vulnerability (BV) and Human Vulnerability (HV)
The spatial and temporal variation of building and hu-man vulnerability may be displayed in a GIS map form. The results of our analyses are shown in Figs. 2 to 7. The database may also be used by various end-users and form a valuable tool for emergency planning, de-veloping mitigation measures and insurance. Examples of such applications are shown in Fig. 8 and 9.
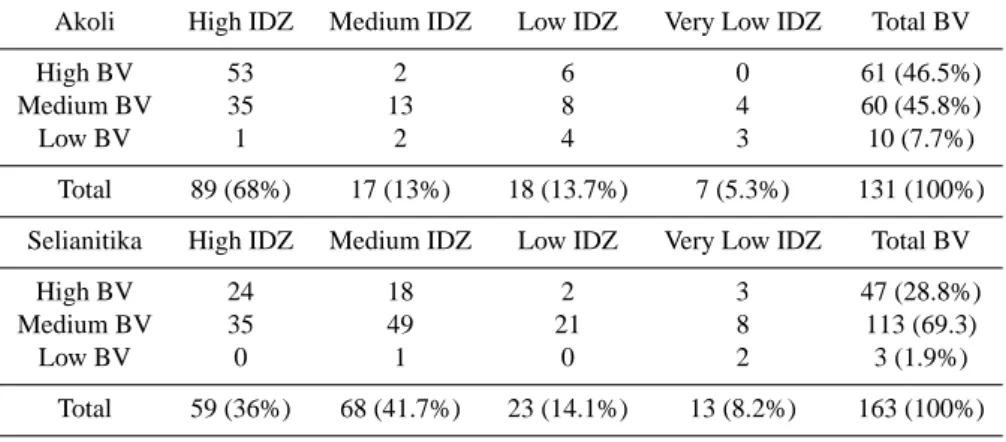
Table 3. The number of buildings in each of the three building vulnerability (BV) categories (High = High BV, Medium = Medium BV,
Low = Low BV) within each of the Inundation Depth Zones (IDZs)
Akoli High IDZ Medium IDZ Low IDZ Very Low IDZ Total BV
High BV 53 2 6 0 61 (46.5%)
Medium BV 35 13 8 4 60 (45.8%)
Low BV 1 2 4 3 10 (7.7%)
Total 89 (68%) 17 (13%) 18 (13.7%) 7 (5.3%) 131 (100%) Selianitika High IDZ Medium IDZ Low IDZ Very Low IDZ Total BV
High BV 24 18 2 3 47 (28.8%)
Medium BV 35 49 21 8 113 (69.3)
Low BV 0 1 0 2 3 (1.9%)
Total 59 (36%) 68 (41.7%) 23 (14.1%) 13 (8.2%) 163 (100%)
Table 4. Diversity of building use within the two study villages and
the permanent and maximum population
Akoli Selianitika Total number of buildings* 131 163
Buildings with no use 7 7
Residential buildings 104 95
Households 152 226
Buildings with services 0 3 Buildings with businesses 20 58 Restaurants, cafes etc. 14 22
Shops 2 2
Hotels 4 33
Permanent population 456 678 Maximum population 976 2232
* An individual building may have many residential and/or business and services units within it. Therefore, the total number of separate units is greater than the total number of buildings.
5 Results
5.1 The Building Vulnerability (BV)
The village of Akoli is now dominated by residential build-ings. There are also many restaurants/cafes (14) situated right at the waterfront. Figure 2 shows the distribution of BV in Akoli. Most of the buildings situated at the waterfront belong to the High BV category. Specifically, 61 or 46.5% of the total number of buildings belong to the High BV cat-egory (Table 3). Additionally, 60 or 45.8% of the buildings belong to the Medium BV category and 10 buildings or 7.7% belong to the Low BV category. The buildings that belong to the Low BV category are situated in the central part of the bay and the majority of them are located within the Low and the Very Low IDZ. Significantly, Table 3 shows that a total of 89 buildings (or 68% of the entire building stock of Akoli)
are located within the High IDZ and of these, 53 buildings (or 60%) are those classified as High BV.
In Selianitika today, there are 95 residential buildings, 33 hotels and 22 restaurants and cafes (Table 4). This is the most diverse and the most populated of the two study vil-lages. In Selianitika (Fig. 3) the majority of the buildings are situated within the High (59 or 36% of all buildings) and Medium (68 or 41.7% of all buildings) IDZs respectively (Table 3). 47 or 28.8% of all buildings are classified as of High BV. 113 or 69.3% of all buildings are classified as of Medium BV. Figure 3 shows that there are two clusters of High BV buildings, one in the west-central part of the bay right at the waterfront and the other one in the east side of the bay. Only 3 or 1.9% of the buildings belong to the Low BV category.
5.2 The Human Vulnerability
Once an assessment of the vulnerability of each building within the inundation zone of each village has been under-taken, it is possible to assess the human vulnerability and show its distribution within the inundation zone (Figs. 4 and 5). The results of this assessment are summarised in Ta-ble 5. TaTa-ble 5 shows that the majority of buildings in both villages have a Low HV classification. In Akoli, 18 or 13.7% of buildings have a High HV classification. In Selianitika, only 11 or 6.7% of buildings have a High HV classification. In Akoli, the High HV buildings are situated at the central and eastern part of the bay (Fig 4). In Selianitika, most of the High HV buildings are situated in the central part of the bay within easy reach of the roads that may be used during evacuation (Fig. 5).
The database can also provide information regarding the number of households that are located within buildings that are classified as of High, Medium and Low BV. These data are shown in Table 6. Table 6 shows that the vast major-ity of the households in Selianitika (199 or 88.1%) and the majority of households in Akoli (92 or 60.6%) are located
Table 5. Distribution of Human Vulnerability (HV) within the two
study villages
Human Vulnerability (HV) Akoli Selianitika
High 18 (13.7%) 11 (6.7%)
Medium 34 (26%) 29 (17.9%)
Low 79 (60.3%) 123 (75.4%)
within buildings with a Medium BV classification. How-ever, a significant percentage of the households in Akoli and Selianitika (26.3% and 11% respectively) are located within buildings with a High BV classification. In Selianitika, only 2 or 0.9% of the households are located in Low BV build-ings whereas, in Akoli, the percentage of such households is larger at 13.1%.
The database created for each village also contains infor-mation concerning the population density of individual build-ings and open spaces for different times of the day and year. By using this information, maps showing the population den-sity during the day in the summer in Akoli (Fig. 6) and in Selianitika (Fig. 7) may be produced. In this paper only the maps showing the population density during the summer are shown since the specific coastal villages do not have build-ings or spaces that have high population density during the winter. Such maps could be used by rescue teams and emer-gency planners in order to pre-plan where the rescuers will focus their attention and efforts. Specifically, which build-ings or open spaces are likely to contain dense concentra-tions of people (and therefore, possible casualties) during the emergency phase of a tsunami disaster.
5.3 The Economic Vulnerability
The number and percentage of businesses and services within each of the High, Medium and Low BV classifications are given in Table 7. Table 7 shows that in Akoli, the vast ma-jority of the businesses (17 or 85%) are located within build-ings with a High BV classification. However, in Selianitika this percentage is lower (29.3% or 17 buildings) since the majority of the businesses (68.9%) are located within build-ings with a Medium BV classification. In Akoli, there are no services within the inundation zone. In Selianitika there are three services and one of them is located within a building with a High BV classification. Therefore, in Akoli, 85% of businesses are at significant risk of being adversely affected by tsunami inundation. Specifically, buildings, equipment, stock and products may all be damaged or destroyed. Such impacts may lead to major business interruption losses. Em-ployees may have to be laid off thus increasing the impacts of the tsunami disaster beyond the initial emergency phase.
Table 6. Number of households located within buildings of High,
Medium and Low BV classification
Households in: Akoli Selianitika High BV 40 (26.3%) 25 (11%) Medium BV 92 (60.6%) 199 (88.1%) Low BV 20 (13.1%) 2 (0.9%)
5.4 Other applications of the database
The primary database for Akoli and Selianitika also contains information that may be used by various end-users or stake-holders in order to produce maps that satisfy their particular needs. For example, local authorities might be interested in the height of the vegetation within the inundation zone and its spatial relationship to the location of vulnerable build-ings in order to encourage the planting of trees in specific areas. Such coastal management may help to reduce horizon-tal flow velocities and hydrodynamic impacts on buildings and structures (such as bridges). Emergency planners may use the database in order to locate possible victims after an event. Figure 8 shows the location of one-floor buildings in Akoli that are at a distance of more than 50m from the roads that lead to higher ground. There are 20 one-floor buildings (15.3% of the total) that do not have direct access to the road network. Consequently, paramedic teams may go directly to these buildings since they are where casualties may be lo-cated. Finally, the database may be a useful tool to insurance and reinsurance companies that could use it in order to pro-duce maps showing buildings that might experience content loss. The level of content loss would be determined by a number of factors that could include condition of the ground floor, location (row) from the coastline and the presence of protective barriers (Fig. 9). Figure 9 shows the buildings that are likely to experience content loss in Selianitika. There are 99 such buildings that constitute 60.7% of the total number of buildings within the potential inundation zone at Seliani-tika. With such a significant percentage of buildings likely to experience content loss, the level of insured risk may need reassessment.
6 Discussion
In the present study, the application of the “Papathoma Method” shows clearly that the vulnerability of buildings to tsunami flooding is not uniform within the inundation zone. Vulnerability is a complex factor that depends on a number of parameters. Analyses of the spatial distribution of vul-nerability enables local authorities and emergency planners to focus their limited resources in the most effective way. For example, it is obvious that the percentage of High BV buildings in Akoli (46.5% of all buildings) is larger than the percentage of High BV buildings in Selianitika (28.8% of
Fig. 2. Map to display the vulnerability of the buildings (BV) in Akoli.
Fig. 4. Map to display the human vulnerability (HV) within individual buildings in Akoli.
Fig. 6. Map to display the distribution of population in Akoli during the day in summer.
Fig. 8. Map to show the distribution of single (one)-story buildings that are at a distance of more than 50 m from the road network in Akoli.
This map therefore, identifies those buildings from which it would be difficult to escape to safer (higher) ground.
Table 7. Number of businesses and services located within buildings of High, Medium and Low BV classification
Akoli Selianitika
BV classification Business Service Business Service High BV 17 (85%) 0 17 (29.3%) 1 (33.4%) Medium BV 3 (15%) 0 40 (68.9%) 2 (66.6%)
Low BV 0 0 1 (1.8%) 0
all buildings). Also, a larger percentage of households are located within High BV buildings in Akoli (26.3%) than in Selianitika (11%). Finally, the local economy of Akoli will suffer more since 85% of the businesses within the inunda-tion zone are located within High BV buildings whereas the percentage of the businesses located within High BV build-ings in Selianitika is 29.3%. These results suggest therefore, that those agencies tasked with the responsibility of manag-ing and respondmanag-ing to actual disasters and preplannmanag-ing mit-igative measures, should in the first instance focus their ef-forts and resources on targeting buildings, households and businesses located in High BV buildings in Akoli. The scale of this study and the spatial distribution of the results may enable various end-users to produce a series of maps that may be used for emergency planning, mitigation measures and house insurance issues.
By examining Tables 5, 6, 7 and 8 and the maps produced for the two study villages, it is possible to make a comparison between the damages and casualties that occurred in 1963 with the pattern of vulnerability based on data collected in 2001. Unfortunately, there were no lists of damage or prop-erty destruction after the tsunami of 1963. As such, no dam-age map could be produced nor could an accurate account of the number of houses that were damaged be given. How-ever, a good description of the impact of the tsunami and its characteristics has previously been given (Galanopoulos et al., 1964). Valuable information concerning this event was collected in local newspaper archives. According to these newspapers, more that 10 residential houses collapsed, 2 people died and 7 were injured, animals and house con-tents were carried away by the waves, many houses were left empty with broken windows and doors (Erevna, 1963) and 25 households were compensated by the state (Foni tou Aeghiou, 1963). Although it is not possible to map the dis-tribution of the damage of 1963, it has been determined that at least 10 residential houses completely collapsed and 25 households claimed compensation. It is easy to appreciate the potential effects of a similar event by looking at the re-sults of the present study. There are 108 highly vulnera-ble buildings in Akoli and Selianitika (36.7% of the total), which accommodate 65 households (approximately 17.2%) and 34 (43.5%) businesses. Finally, it is worth mentioning that the tsunami of 1963 occurred during a winter evening. It is clear that the impact would be much more serious if it were to have happened during the summer. Data concerning
the value of buildings in the area could be used in order to “translate” the vulnerability maps into minimum estimates of cost. Data concerning compensation rates in 1963 were also hard to find. However, using the rates of compensation that were awarded by the Greek State Government follow-ing the Athens earthquake of 1999, it is possible to estimate potential compensation costs for our study area following a major tsunami.
An approximate picture of the expected costs may be cre-ated based on the hypothesis that the highly vulnerable build-ings within the study area will be destroyed during a tsunami flood. The hypothetical damage/costs for the area are given in Table 8. According to this rough calculation the costs of an event similar to that of 1963 would be at least 1.5 million Euros. Considering that the estimated costs do not include: compensation to families for the dead and injured, recon-struction costs, repair and reconrecon-struction of infrastructure and communications, compensation to services, indirect im-pacts on tourism and so forth, it is easy to understand that the impact of an event at the present time would be significantly larger than that in 1963.
On the basis of the results presented herein, it is recom-mended that: (1) further research be undertaken in order to fully assess the probability of occurrence of tsunami with different Ko intensities and H (m)max. This is of
funda-mental importance so that proper calculations of frequency-recurrence may be completed. This is especially neces-sary for the Gulf of Corinth because the frequency of large tsunamis is not great. Furthermore, only one event is recorded for the period 373 BC to AD 1402; (2) more de-tailed “ground truthing” field survey assessments be com-pleted around the shores of the Gulf of Corinth to fully identify those parameters that influence the vulnerability of people, property, businesses and infrastructure and (3) the “Xenokratis” plan should be re-written to take in to consid-eration the hazard posed by tsunami.
7 Conclusions
Greece is frequently affected by tsunami and the Gulf of Corinth has witnessed the impacts of large tsunami repeat-edly during historical times. An analysis of the historical dataset indicates that tsunami with an intensity (Ko) of IV
recur, on average, every 103 years. The H (m)maxfor
Table 8. Estimated costs of a future hypothetical tsunami similar to the event of AD 1963 (achieving a flood run-up of +5 m a.s.l.) for
Akoli and Selianitika combined. Costs are in Euros and are based on compensation payments made following the 1999 Athens earthquake in different compensation classes. Data from http://www.minenv.gr
Impact of the tsunami upon: Estimates costs Euro
108 buildings 108 × 5869 633 852
378 households within inundation zone 378 × 587 221 186 34 businesses with minimum of 2 employees 34 × 2 × 587 39 916 65 households within destroyed buildings 65 × 293 × 24
(24 = mean rent allowance for 2 years) 457 080
67 uninhabited residential units* 67 × 1467 98 289
Total 1 450 323
* The number of uninhabited residential units is the number of residential units that are likely to experience content loss minus, the High BV buildings that overlap. Therefore, here: (99 + 76 − 108 = 67).
on the 7th February 1963. While another event of this mag-nitude may not be expected for many years, we undertake a new tsunami vulnerability assessment at two locations on the south shore of the Gulf of Corinth. Our reasons for undertak-ing such an analyses include: (1) the recent recognition that tsunami vulnerability is more complicated than hitherto con-sidered; (2) the area affected by the 1963 tsunami has a much more developed urban landscape and infrastructure where the risk for tsunami impacts are considered much greater than in the past and; (3) that the existing emergency management plan (Xenokratis) does not consider tsunami disaster man-agement.
In Akoli, 46.5% of all buildings are classified with a High BV. 26.3% of all households are located within buildings with a High BV classification. 85% of all businesses are located within buildings with a High BV classification. Fi-nally, in Akoli, 13.7% of the entire population is located within buildings with a High BV classification. In Seliani-tika, 28.8% of all buildings are classified with a High BV. 11% of all households are located within buildings with a High BV classification. 29.3% of all businesses and 33.4% of all services are located within buildings with a High BV classification. Finally, in Selianitika, 6.7% of the entire pop-ulation is located within buildings with a High BV classifi-cation.
The results of our study have important implications for many different end-users and stakeholders. Specifically, it would seem appropriate that those agencies tasked with tsunami disaster management ought to consider focusing their resources in the area of Akoli. In particular, businesses appear to be at significant risk to the impacts of a future tsunami event. Finally, recommendations include (1) further research that considers the occurrence of tsunami with dif-ferent intensities; (2) detailed ground truthing assessments following tsunami events in order to identify those param-eters that influence vulnerability and (3) the rewriting and improvement of “Xenokratis” emergency plan.
Acknowledgements. Dr. G. A. Papadopoulos is thanked for
provid-ing help durprovid-ing the data collection phase and Coventry University
and the Coventry Centre for Disaster Management are thanked for providing the funding for this research.
References
Ambraseys, N. N.: Data for the investigation of seismic sea waves in the eastern Mediterranean, Bulletin of the Seismological So-ciety of America, 52, 895–913, 1962.
Ambraseys, N. N. and Jackson, J. A.: Seismicity and strain in the Gulf of Corinth (Greece) since 1694, J. Earthqu. E., 1, 3, 433– 474, 1997.
Camfield F. E.: Tsunami effects on coastal structures, J. Coast. Res., Special Issue No 12, Coastal Hazards, 177–187, 1994.
Dominey-Howes, D. T. M.: Documentary and geological records of tsunamis in the Aegean Sea region of Greece and their poten-tial application to risk assessment and disaster management, Nat. Hazards, 25, (3), 195–224, 2002.
Erevna (Local Greek Newspaper), 10/2/1963. Foni tou Aegiou (Local Greek Newspaper), 14/2/1963.
Galanopoulos A. G., Delibasis N. D., and Komninaki, P. E.: A tsunami generated by an earth slump set in motion without shock, Annales Geologique des pays Helleniques (in Greek), 93–110, 1964.
Ganas, A., Nikolaou, E., Dermentzopoulos, Th., and Papadopou-los, G. A.: A GIS for tsunami risk mapping and management, in: NATO Advanced Research Workshop “Underwater Ground Fail-ures on Tsunami Generation Modeling, Risk and Mitigation”, Is-tanbul, May 23-26, 2001, 249–252, 2001.
http://www.minenv.gr
Koukouvelas I. K.: The Egion Fault, earthquake related and long term deformation, Gulf of Corinth, Greece, J. Geodyn., 26, 2-4, 501–513, 1998.
Koutitas, C. G. and Papadopoulos, G. A.: Numerical simulation of the aseismically induced tsunami of 7 February 1963 in the western Corinthos bay, International Conference on Tsunamis, Paris, May 26-28, 247–254, 1998.
Lekkas, E. L., Lozios, S., Skourtsos, E., and Kranis, H.: Liquefac-tion, ground fissures and coastline change during the Egio earth-quake (15 June 1995, Central-Western Greece). Terra Nova, 8, 648–654, 1996.
Lekkas, E. L., Lozios, S. G., Skourtsos, E. N., and Kranis, H. D.: Egio Earthquake (15 June 1995): An episode in the neotectonic
evolution of Corinthiakos Gulf, J. Geodyn., 26, 2–4, 487–499, 1998.
Maramai, A. and Tinti, S.: Coastal effects and damage due to the 3rd June Java tsunami. in: Perspectives on Tsunami Hazard Re-duction, edited by Hebenstreit, D., Kluwer Academic Publishers, 1–20, 1997.
Papadopoulos, G. A. and Dermentzopoulos, Th.: A tsunami risk management pilot study in Heraklion, Crete, Nat. Hazards, 18, 91–118, 1998.
Papadopoulos, G. A.: Tsunamis in the East Mediterranean: A Cata-logue for the area of Greece and adjacent seas, Proceedings Join IOC–IUGG International Workshop Tsunami Risk Assessment Beyond 2000: Theory, Practice & Plans, Moscow, 14 - 16 June, 2000, 34–43, 2001.
Papadopoulos, G. A.: Tsunami hazard in the Eastern Mediter-ranean: strong earthquakes and tsunamis in the Corinth Gulf, Central Greece. Nat. Hazards, 29, 437–464, 2003.
Papatheodorou, G. and Ferentinos, G.: Submarine and coastal sed-iment failure triggered by the 1995, MS = 6.1 R Aegion earth-quake, Gulf of Corinth, Greece, Marine Geol., 137, 287–304, 1997.
Papathoma, M.: Assessing tsunami vulnerability using GIS with special reference to Greece, unpublished PhD thesis, Coventry University, pp. 290, 2003.
Papathoma, M., Dominey-Howes, D. T. M, Smith, D. E., and Zong, Y.: Assessing tsunami vulnerability, an example from
Her-akleio, Crete, Natural Hazards and Earth System Science, 3, 1– 13, 2003.
Postma G.: Catastrophic sediment transport in the coastal zone of tectonically active regions: relevance to the destruction of He-like. Helike II, Ancient Helike and Aigialeia, Proceedings of the Second International Conference, Aigion, 1–3 December 1995, 417–441, 1995.
Shimamoto, T., Tsutsumi, A., Kawamoto, E., Miyawaki, M., and Sato, H.: Field survey report on tsunami disasters caused by the 1993 Southwest Hokkaido earthquake, Pur. A. Geoph., Special Issue: Tsunamis: 1992–1994. Their Generation, Dynamics and Hazard, 144, (3–4), 665–691, 1995.
Soloviev, S. L.: Tsunamis: the assessment and mitigation of earth-quake and risk. UNESCO, 118–143, 1978.
Soloviev, S. L., Solovieva, O. N., Go, C. N., Kim, K. S., and Shchet-nikov, N. A.: 2000 Tsunamis in the Mediterranean Sea 2000 B.C. – 2000 A.D., Kluwer Academic Publishers, 237 pp, 1978. Soter, S.: Holocene uplift and subsidence of the Helike Delta, Gulf
of Corinth, Greece, in: Coastal Tectonics, edited by Stewart, I. S. and Vita-Finzi, C., Geological Society, London, Special Publica-tions, 146, 41–56, 1998.
Tsuji Y., Matsutomi, H., Imamura, F., Takeo, M., Kawata, Y., Mat-suyama, M., Takahashi, T., and Harjadi, P.: Damage to coastal villages due to the 1992 Flores Island earthquake tsunami, Pur. A. Geoph., Special Issue: Tsunamis: 1992–1994. Their Genera-tion, Dynamics and Hazard, 144, (3–4), 482–521, 1995.