HAL Id: hal-00330138
https://hal.archives-ouvertes.fr/hal-00330138
Submitted on 30 Jul 2007
HAL is a multi-disciplinary open access
archive for the deposit and dissemination of
sci-entific research documents, whether they are
pub-lished or not. The documents may come from
teaching and research institutions in France or
abroad, or from public or private research centers.
L’archive ouverte pluridisciplinaire HAL, est
destinée au dépôt et à la diffusion de documents
scientifiques de niveau recherche, publiés ou non,
émanant des établissements d’enseignement et de
recherche français ou étrangers, des laboratoires
publics ou privés.
drizzle and ice particles obtained from alternated lidar
and in situ measurements
Jean-François Gayet, I. S. Stachlewska, O. Jourdan, V. Shcherbakov, Alfons
Schwarzenboeck, R. Neuber
To cite this version:
Jean-François Gayet, I. S. Stachlewska, O. Jourdan, V. Shcherbakov, Alfons Schwarzenboeck, et al..
Microphysical and optical properties of precipitating drizzle and ice particles obtained from alternated
lidar and in situ measurements. Annales Geophysicae, European Geosciences Union, 2007, 25 (7),
pp.1487-1497. �hal-00330138�
www.ann-geophys.net/25/1487/2007/ © European Geosciences Union 2007
Annales
Geophysicae
Microphysical and optical properties of precipitating drizzle and ice
particles obtained from alternated lidar and in situ measurements
J.-F. Gayet1, I. S. Stachlewska2,*, O. Jourdan1, V. Shcherbakov1, A. Schwarzenboeck1, and R. Neuber2 1LaMP UMR 6016 CNRS/Universit´e Blaise Pascal, 24 avenue des Landais, 63177 Aubi`ere, France
2Alfred-Wegener-Institute for Polar and Marine Research, Telegrafenberg A43, 14473 Potsdam, Germany *now at: Leosphere, EcolePolytechnique, 91128 Palaiseau Cedex, France
Received: 30 October 2006 – Revised: 18 June 2007 – Accepted: 27 June 2007 – Published: 30 July 2007
Abstract. During the international ASTAR experiment
(Arc-tic Study of Aerosols, Clouds and Radiation) carried out from Longyearbyen (Spitsbergen) from 10 May to 11 June 2004, the AWI (Alfred Wegener Institute) Polar 2 aircraft was equipped with a unique combination of remote and in situ instruments. The airborne AMALi lidar provided down-ward backscatter and Depolarisation ratio profiles at 532 nm wavelength. The in situ instrumental setup comprised a Po-lar Nephelometer, a Cloud Particle Imager (CPI) as well as a Nevzorov and standard PMS probes to measure cloud par-ticle properties in terms of scattering characteristics, parpar-ticle morphology and size, and in-cloud partitioning of ice/water content. The objective of the paper is to present the results of a case study related to observations with ice crystals pre-cipitating down to supercooled boundary-layer stratocumu-lus. The flight pattern was predefined in a way that firstly the AMALi lidar probed the cloud tops to guide the in situ measurements into a particular cloud formation. Three kinds of clouds with different microphysical and optical properties have therefore been quasi-simultaneously observed: (i) water droplets stratiform-layer, (ii) drizzle-drops fallstreak and (iii) precipitating ice-crystals from a cirrus cloud above. The sig-natures of these clouds are clearly evidenced from the in situ measurements and from the lidar profiles in term of backscat-ter and Depolarisation ratio. Accordingly, typical lidar ra-tios, i.e., extinction-to-backscatter rara-tios, are derived from the measured scattering phase function combined with sub-sequent particle shapes and size distributions. The backscat-ter profiles can therefore be retrieved under favourable con-ditions of low optical density. From these profiles extinction values in different cloud types can be obtained and compared with the direct in situ measurements.
Keywords. Atmospheric composition and structure (Aerosols and particles; Cloud physics and chemistry; Instruments and techniques)
Correspondence to: J.-F. Gayet
1 Introduction
The impact of clouds on the radiation balance of our planet has been identified as a major unsolved problem in climate research (see among others Norris, 2005). It is generally rec-ognized that inadequate parameterisation of the ice-phase, mixed-phase, and polluted clouds is one of the greatest sources of uncertainty in the modeling of climate processes (Sun and Shine, 1995; Gregory and Morris, 1996). Accurate determination of the microphysical and optical cloud prop-erties, including the identification of particle phase and sub-sequent water partition (liquid and/or ice), is crucial for bet-ter understanding of the cloud formation and evolution par-ticularly in Arctic regions (Curry et al., 1996) as well as the effects of anthropogenic emissions. Detailed observa-tions of cloud microphysical and optical characteristics are also required for the validation of retrieved cloud parameters obtained from remote sensing devices (Korolev and Isaac, 1999). Indeed, remote sensing of cloud properties has be-come an increasingly determinant field, because retrieval al-gorithms used from ground (see among others Shupe et al., 2005) and from airborne platforms (Brogniez et al., 2004; Tinel et al., 2005) are now being adapted and implemented for widespread use from space like the A-Train project which includes the CALIPSO satellite (Stephens et al., 2002). The strategy of validation of retrieved products yet has to be de-veloped for mixed-phase and ice clouds. In the case of wa-ter clouds, the spherical shape of the droplets considerably simplifies the validation of the retrieved effective diameter with the exception for highly contaminated particles by at-mospheric pollutants. In the latter case the non-absorption hypothesis is no longer valid. Because of the occurrence of both spherical droplets and ice crystals in mixed-phase clouds and the complexity of the ice crystal shapes in such clouds as well as in glaciated (cirrus) clouds, the determina-tion of an “effective dimension” needs to be reviewed with detailed in situ information on the shape of these particles and on the related effects on scattering properties.
In this paper we present the results of a case study (5 June 2004) which has been documented during the ASTAR exper-iment (Herber et al., 2004) from observations carried out on-board the Polar 2 aircraft operated by the Alfred Wegener In-stitute (AWI). These observations relate alternated lidar and in situ measurements of ice crystals precipitating down to su-percooled boundary-layer stratocumulus. The flight pattern consisted firstly to probe the cloud tops by lidar then to pro-ceed to in situ measurements at lower levels in the cloud. The instruments used for the remote and in situ observations are presented first, together with the evaluation of the measure-ment errors.
2 Instrumentation and procedure
2.1 Instrumentation
The Airborne Mobile Aerosol Lidar (AMALi) has been used onboard the Polar-2 aircraft to probe the backscatter proper-ties of the atmosphere below the aircraft. This instrument, the performances and the retrieving technique for the end-products determination have been thoroughly described by Stachlewska (2006a).
The instruments used for the determination of microphys-ical and optmicrophys-ical properties of Arctic clouds during ASTAR include four independent techniques: (1) the Polar Neph-elometer, (2) the PMS 2D-C, (3) the Cloud Particle Imager (CPI) and (4) the Nevzorov probe. The combination of these techniques provides a description of particles within a diam-eter range varying from a few micromdiam-eters (typically 3 µm) to several millimeters. The method of data processing, the reliability of the Polar Nephelometer and PMS 2D-C instru-ments and the uncertainties of the derived microphysical and optical parameters have been described in detail by Gayet et al. (2004).
2.1.1 Remote measurements
The Airborne Mobile Aerosol Lidar (AMALi) was devel-oped by the Lidar Group of the Alfred Wegener Institute (AWI) in Potsdam (Stachlewska et al., 2004). The sys-tem is designed to provide remote sensing measurements at 1064 nm and 532 nm wavelengths with Depolarisation infor-mation at 532 nm. Onboard the Polar-2 aircraft, the AMAli was operated in the nearly nadir-looking configuration. The data acquisition system recorded single-shot lidar signals providing high temporal and hence horizontal resolution. Measured lidar profiles deliver qualitative information about properties of the atmosphere between the flight altitude and the ground or sea surface. To assure eye-safety, the laser beam divergence was large (2.6 mrad). The overlap range of the field of view of the telescope (3.1 mrad) and the laser beam determines a distance between the aircraft and the first reliable point in lidar profiles, which was at 235 m. The ef-fects of the multiple scattering are neglected. The resolutions
of lidar profiles used in this paper were chosen 7.5 m for the vertical resolution and 15 s for the temporal resolution. The latter one corresponds to a horizontal resolution of 1.2 km for the aircrafts cruising speed of about 80 m/s.
The method of data processing of the AMALi measure-ments to retrieve the backscatter and extinction coefficients and the Depolarisation ratio are discussed with details in the Appendix along with the evaluation of the errors.
2.1.2 Microphysical and optical measurements
The Polar Nephelometer (Gayet et al., 1997) measures the scattering phase function of an ensemble of cloud particles (i.e., water droplets or ice crystals or a mixture of these par-ticles ranging from a few micrometers to about 1 mm diam-eter), which intersect a collimated laser beam near the focal point of a parabolic mirror. The light source is a high-power (1.0 W) multimode laser diode operating at λ=804 nm. The data acquisition system of the airborne version of the Polar Nephelometer is designed to provide a continuous sampling volume by integrating the measured signals of each of the de-tectors over a selected period. For instance, the sampling vol-ume (v) is determined by the sampling surface (10-mm long and 5-mm diameter beam) multiplied by the Polar-2 cruise speed of approximately 80 m s−1, i.e.: 500 cm3 for an ac-quisition frequency of 10 Hz. This means that the detection threshold is 0.5 particle per litre at this frequency. Direct measurement of the scattering phase function allows parti-cle types (water droplets or ice crystals) to be distinguished and calculations of the optical parameters to be performed (extinction coefficient and asymmetry parameter, see Gayet et al., 2002). The accuracies on extinction coefficient and asymmetry parameters derived from the Polar Nephelometer are estimated to be within 25% and 4%, respectively (Gayet et al., 2004).
The PMS 2D-C instrument provides information on crys-tal size and shape for the size range 25–800 µm. Because large ice crystals as larger as several millimeters have been observed during the ASTAR experiment, the ‘reconstructed’ method of 2-D data processing (Heymsfield and Parrish, 1978) has been used in this study. The ‘reconstructed’ method allows an extrapolation of the data to particles larger than 800 µm. The sampling surfaces have been derived ac-cordingly for the calculation of microphyical parameters. In order to improve the statistical significance of low particle concentrations, a 5-s running mean was applied. Irregular ice particles were the most predominant crystals sampled in arctic clouds during ASTAR. Therefore, the bulk parame-ters were calculated assuming the surface-equivalent diam-eter relationships given by Heymsfield (1972) and Locatelli and Hobbs (1974). As the sensitivity of the probe to small particles decreases with airspeed (i.e. ∼70 to 90 m s−1with the Polar-2 aircraft), the five-first channels (up to 125 µm) were corrected according to the results of Baumgardner and Korolev (1997) assuming that these corrections take into
account the miss and/or the under-sizing of the particles ev-idenced by Strapp et al. (2001) and by Lawson et al. (2006). The use of the first six 2D-C channels was justified as they were found reliable in terms of statistical significance by applying the Principal Component Analysis procedure (Shcherbakov et al., 2005). The accuracy of derived mi-crophysical parameters is considerably affected by inherent shortcomings of probes and data processing. Considering the sampling time of 5 s, the total random uncertainties were es-timated as ranging from 75% to 100% for PMS probe data (see details in Gayet et al., 2002). These errors may be con-siderably reduced by taking averages over longer periods. 2.1.3 Other measurements
In this study the data from the Cloud Particle Imager (CPI, Lawson et al., 1998) will only be used to give indication on the type and/or the shape of particles, which have been ob-served. Of course, microphysical parameters can also be de-rived from the CPI data (Lawson et al., 1998). As for the Nevzorov instrument (Korolev et al., 1998), the liquid water content (LWC) and the ice water content (IWC) can be de-duced according to calibration relationships. The accuracies on these quantities have been evaluated to 30%.
2.2 Cloud situation and flight procedure
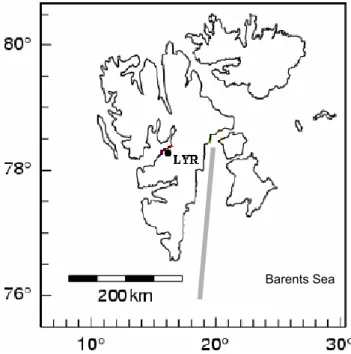
The observations discussed in this paper were obtained on 5 June 2004 between 07:40–11:35 UT over the Storfjor-den area which is located in the South-East of the Svalbard Archipelago (see Fig. 1). From the AVHRR/NOAA15 satel-lite images (09:16 UT), the weather situation over the obser-vation area was characterized by a multi-layers cloudy sys-tem, i.e., scattered cirrus clouds at upper levels with a low optical depth (rather transparent in the visible channel) and a broken stratiform layer at lower levels. The vertical sound-ing derived from the airborne measurements revealed that the boundary layer cloud extended from about 1200 m/−9◦C to1400 m/−11◦C with a wind rather homogeneous both in the magnitude (6±1 m/s) and the direction (5–30◦) in the
sampled altitude range (up to 3000 m: the aircraft ceiling). The flight consisted, first, to perform nadir remote mea-surements with the AMALi lidar at the aircraft ceiling along a flight distance of 200 km while heading strait into south-ern part of Storfjorden (see Fig. 1). Afterwards, the aircraft descended to 1400 m/−11◦C and in-situ measurements were carried out at this level in order to document the cloud micro-physical and optical properties along a horizontal distance of about 200 km and with a heading North oriented (see Fig. 1). The 1400 m flight level has been chosen according to on-board real-time lidar observations which revealed interesting cloud features, i.e. stratiform layer and ice crystals precipi-tating (Stachlewska et al., 2006b).
The lidar measurements will be first presented to overview the backscatter cloud properties, then the cloud
microphysi-Barents Sea
Fig. 1. Map of the Svalbard Archipelago and location of the Polar 2 aircraft flight (grey line) on 5 June 2004 during the ASTAR cam-paign. The ASTAR flights were made from Longyearbyen (LYR).
cal and optical properties obtained at a single flight level will be discussed in order to give some insights about the vali-dation of retrievals results in terms of particle phase (water droplets and/or ice crystals) and extinction coefficient.
3 Lidar observations
Figures 2a and b display respectively the vertical profiles (be-tween 3000 m and the sea surface) of the lidar signal (back-ground and range corrected) and the Depolarisation ratio at 532 nm during a flight sequence of about 200 km long, i.e. between 08:57 and 09:42 UT. The line superimposed on each Figs. 2 indicates the flight level of the in situ measurements (see Sect. 4) performed about one hour after the sequence of remote sensing observations. The analysis of the results on Fig. 2 highlights a broken cloud layer vertically extended from about 1200 m and 1600 m with strong backscattering signals and low Depolarisation ratio (1–5%). This feature reveals the presence of a stratiform cloud with water (spher-ical) supercooled droplets. In these cloud regions, the laser beam is rapidly attenuated due to very high concentration of scatters. Additionally, multiple scattering must be expected under these conditions. Hence, the lidar signal and Depo-larisation ratio below these clouds and down to the sea level cannot be exploited (i.e. blank areas on Fig. 2b). An interest-ing feature, evidenced between 09:15 and 09:20, is the fall-streak signature attributed to precipitating freezing-drizzle because of a Depolarisation ratio as low as a few percent, typical for spherical particles. Subsequently, the cloud layer
Drizzle
In situ measurements Ice crystals precipitating
Supercooled stratocumulus Si g n a l s tr e n g th (a rb itr a ry u n its ) Fig
Fig. 2. (a) Vertical cross-section of the range corrected AMALi lidar signal at 532 nm for measurements carried out between 08:57 and 09:42 UT on 5 June 2004. (b) Corresponding vertical cross-section of the Depolarisation ratio at 532nm. The blank areas represent non-exploited data due to strongly attenuated signal by water droplet clouds (see text for explanation).
was optically thinner compared to the other cloud parts, thus the lidar information can be processed down to the sea level. A similar situation was described by Gayet et al. (1994) where lidar data were inverted in drizzle precipitation situ-ation which occurred in a boundary-layer stratiform cloud. At uppermost levels (i.e. from about 1600 m to 3000 m) and from the beginning of the flight sequence to 09:20, the high values of the Depolarisation ratio (25% to 50%) give indi-cation that different types of particles were detected that is attributed to irregularly shaped ice crystals falling from the cirrus cloud above observed from satellite (AVHRR images). The final part of the measurement between 09:36 and 09:42 UT was taken in a cloud-free background atmosphere. The noisy character of the Depolarisation ratio profiles ob-served in the clear atmosphere areas is due to lower tar-get concentrations compared to aerosol-rich atmosphere or in clouds cases, resulting in a weaker backscatter signal at perpendicular 532 nm wavelength. The representative mean value of Depolarisation ratio of 5% in the clear parts of atmo-sphere above the water cloud and in cloud-free atmoatmo-sphere between 09:25 and 09:42 UT was found.
4 In situ measurements
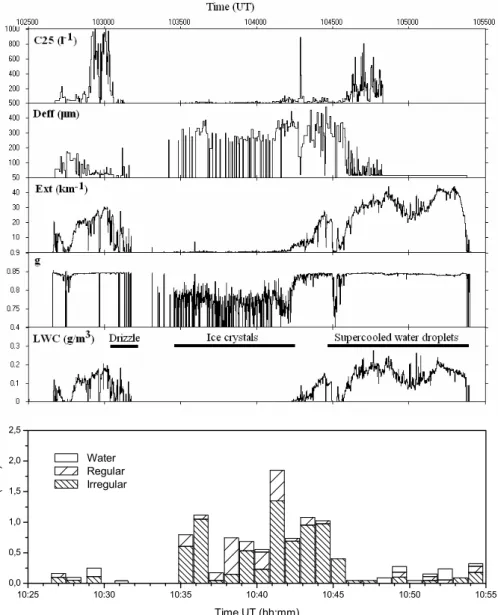
Figure 3 displays time-series of cloud parameters mea-sured between 10:25 and 10:55 UT at a single flight level (1400 m/−11◦C). The parameters are: the particle concen-tration (C25) and the effective diameter (Deff) measured by the PMS 2D-C probe, the extinction coefficient (Ext) and the asymmetry parameter (g) derived from the Polar Neph-elometer measurements and the liquid water content (LWC) deduced from the Nevzorov instrument. Shape classification of particles larger than 50 µm from CPI images is also shown in Fig. 3 with three categories, i.e. water spherical droplets, regular shape (columns, plates, . . . ) and irregular shape par-ticles. Of course, due to the time differences in sampling times (about 1 h 20 min) the in situ measurements cannot be directly related to the remote observations in Fig. 2 because of both the natural time-evolution of the cloud and the air-mass advection. Nevertheless at the flight level, the wind being roughly parallel-oriented to the flight trajectory (5◦, see Fig. 1) the airmass advection is about 30 km according to the sampling time difference and a wind speed of 6 m/s. This leads us to the conclusion that the aircraft sampled the same cloud system which may retain similar features be-tween the two flight sequences. Indeed, Fig. 3 shows that the aircraft sampled distinct cloud patches with different features
10:25 10:30 10:35 10:40 10:45 10:50 10:55 0,0 0,5 1,0 1,5 2,0 2,5 C o n c e n tr a tio n ( # / L ) Time UT (hh:mm) Water Regular Irregular
Fig. 3. Time-series of microphysical and optical parameters measured at 1400 m/−11◦C level. C25: particle concentration of particles
with D>25 µm, Deff: effective diameter, Ext: extinction coefficient, g: asymmetry parameter and LWC : liquid water content. The shape classification of particles larger than 50 µm from CPI images is also reported with three categories, i.e. water spherical droplets, regular shape (columns, plates, . . . ) and irregular shape particles.
that may be related to the cloud properties inferred from the lidar observations depicted in Figs. 2 at the corresponding level. As a matter of fact, the examination of Fig. 3 shows that the aircraft samples first (10:27–10:31) a cloud which exhibits typical (supercooled) water droplets signature since the asymmetry parameter value is 0.845. The liquid water content (LWC from the Nevzorov instrument) and the con-centration of drops larger than 25 µm (C25) reach 0.20 g/m3 and 1000 l−1, respectively. It should be noticed that very sim-ilar cloud properties are observed during the last part of the flight sequence (10:40–10:54). These cloud characteristics may be related to the broken stratiform water droplet layer detected by the AMALi in which the laser beam is rapidly
attenuated due to very high concentration of particles. In-deed the cloud microphysical parameters retrieved from the measured scattering phase function (Gayet et al., 2002) are: 130 cm−3, 0.25 g/m3and 17.3 µm for the droplet concentra-tion, liquid water content and effective diameter respectively. We note in passing the good correspondence between the two liquid water content measurements from the Nevzorov probe and the Polar Nephelometer, i.e., 0.20 g/m3and 0.25 g/m3, respectively.
Furthermore, at the fringe of the first sampled cloud patch (i.e. between 10:30 and 10:31:30), the CPI revealed the oc-currence of drizzle droplets with diameter up to 500 µm (see examples of CPI images in Fig. 5). Therefore, the
(a) Diameter (μm) Scattering angle (°) Pa rt icl e co n c e n tra ti o n (l -1 μ m-1 ) μ μ
4.a
An g u la r sca tt e ri n g c o e ff ici e n t (μ m-1 sr-1 ) μ μ C25 = 9 l-1 LWC = 30 mg/m3 Deff = 65 μm Ext = 3.5 km-1 g = 0.845 (b) μ μDiameter (μm) Scattering angle (°)
Pa rt icl e co n ce n tra ti o n (l -1 μ m-1 )
4.b
μ An g u la r sca tt e ri n g c o e ff ici e n t (μ m-1 sr-1 ) C25 = 10 l-1 IWC = 9.0 mg/m3 Deff = 270 μm Ext = 0.2 km-1 g = 0.766 μFig. 4. (a) Example of measurements obtained between 10:30 and 10:31:30: Drizzle area. Left panel: PMS 2D-C size distribution and values of the corresponding parameters. Right panel: Measured scattering phase function by the Polar Nephelometer. (b) Same as panel (a). Example of measurements obtained between 10:35 and 10:42: Ice particles zone.
above cloud characteristics may be related to the precipitat-ing drizzle-drops inferred at the same level from the lidar data on Figs. 2. Figure 4a illustrates the mean results ob-tained in the drizzle zone (10:30–10:31:30, see Fig. 3). The left panel displays the PMS 2D-C particle size distribution (with the mean values of the parameters), whereas the right panel represents the measured (Polar Nephelometer) scatter-ing phase function. The scatterscatter-ing properties reveal a typical response of water (spherical) droplets with the well-marked rainbow feature at 144◦and an asymmetry factor of 0.845. The corresponding droplet concentration (C25), liquid wa-ter content, extinction coefficient and effective diamewa-ter are 9 l−1, 30 mg m−3, 3.6 km−1and 65 µm, respectively.
Coming back to Fig. 3, the results show that the middle-part of the sequence (10:35–10:42) exhibits quite different microphysical and optical cloud properties. Indeed, an opti-cally thin layer is evidenced with low values of the asymme-try parameter, extinction and concentration of particles with
large effective diameter. These characteristics reveal the oc-currence of large ice crystals as confirmed by the CPI analy-sis (see examples in Fig. 5) and could also be related to ice particles precipitating from the levels above as inferred from the lidar data. Figure 4b, with a similar representation as in Fig. 4a, displays the results observed in the ice crystals re-gion between 10:35 and 10:42 (see Fig. 3) which indicates the properties of the optically thin ice layer with mean values of the ice water content, extinction and effective diameter of 10 l−1, 9.0 mg m−3, 0.2 km−1and 270 µm, respectively. The scattering phase function exhibits a smoothed feature typical of irregular ice-crystal signature (see Gayet et al., 1998) with an asymmetry parameter value of 0.771.
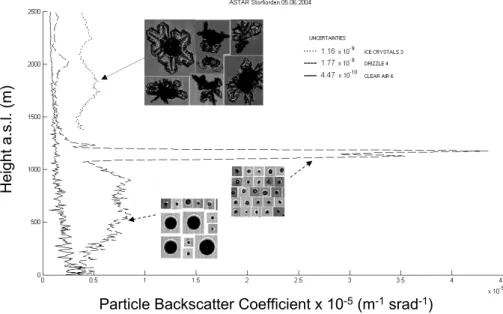
Particle Backscatter Coefficient x 10-5(m-1srad-1) H e ig h t a .s. l. (m)
Fig. 5. Vertical profiles of particle backscatter coefficient retrieved for the selected regions in Fig. 3 of: (i) drizzle fallstreak (dashed line), (ii), ice crystals (dotted line) and (iii) cloud-free atmosphere (solid line) from the AMALi measurements at 532 nm. Some CPI images exemplify water drops and ice crystals to related-profiles.
5 An attempt to compare remote and in situ observa-tions
We recall that the particle backscatter coefficient profiles were obtained using the iterative method (Stachlewska, 2006a, see Appendix) with lidar ratios evaluated by using the method of Jourdan et al. (2003) applied to the scatter-ing phase functions measured by the Polar Nephelometer and displayed on Figs. 4a and b. At a wavelength of 532 nm the lidar ratios (i.e., extinction-to-backscatter ratio) are 14.5 sr and 13.8 sr for the drizzle drops and the ice crystals, respec-tively. We note in passing that similar values of lidar ratios are found for both water droplets and ice crystals and agree well to values expected in water and cirrus clouds (Sassen et al., 1989; Ansmann et al., 1992; Chen et al., 2002).
Three vertical profiles of particle backscatter coefficient obtained from the lidar signals in selected regions of Fig. 2 are displayed on Fig. 5. In order to get statistically sentative observations on large volumes, these profiles repre-sent mean values calculated over 2 mn for the drizzle-drop-fallstreak sample at 09:19 UT (see Fig. 2) and over 7 mn in the ice crystal layer at 09:13 UT (see Fig. 2). The profile at 09:37 related to a cloud-free atmosphere has been calculated as a background profile which allows to better identify the cloud heights and the transition between the cloud particles and background aerosols.
The results in Fig. 5 show that in the drizzle region the particle backscatter profile can be retrieved down to the sea level despite the large peak of the backscatter coeffi-cient (4.5×10⁻⁵m−1sr−1) evidenced between 1300 m and
1400 m. This layer is likely a remnant part of the
strat-iform water cloud in which the drizzle precipitation was formed by coalescence process and then has washed-out the cloud. At lower levels, much lower values of the backscat-ter coefficient characbackscat-terize the drizzle precipitation, i.e. from 0.4×10⁻⁵m−1sr−1to 0.9×10⁻⁵m−1sr−1. Table 1 summa-rizes the retrieved particle backscatter coefficients related to the drizzle cloud parts and the corresponding particle extinc-tion coefficient calculated by multiplicaextinc-tion with indicated lidar ratios. Compared to the extinction coefficient derived from the Polar Nephelometer during the 10:30–10:31:30 se-quence (see mean value and standard deviation on Fig. 4a and in Table 1) the remote values are smaller (0.65 km−1versus 3.5 km−1) but are overlapping within the range of horizontal
variations of the in-situ measurements and within the given uncertainties.
The profile of the retrieved backscattering coefficient re-lated to the ice crystal layer between 1400 m and 3000 m (at 09:13 UT, see Fig. 5) highlights vertical variation of the layer structure between 0.4×10⁻⁵m−1sr−1 and
0.6×10⁻⁵m−1sr−1or between 0.06 and 0.08 km−1in term
of extinction coefficient. Comparisons in Table 1 also show smaller remote values versus direct measurements (0.20 km−1) with variation ranged within the in situ
variabil-ity of the horizontal layer structure.
In conclusion, the extinction values significantly disagree between the two instruments for both cases (drizzle particles and ice crystals). The main reason to explain these discrep-ancies could be the non-accurate co-location of the two mea-surements. Indeed, a time separation of about 80 mn between lidar and in situ observations can lead to large differences in the results due both to the time-evolution of the cloud and to
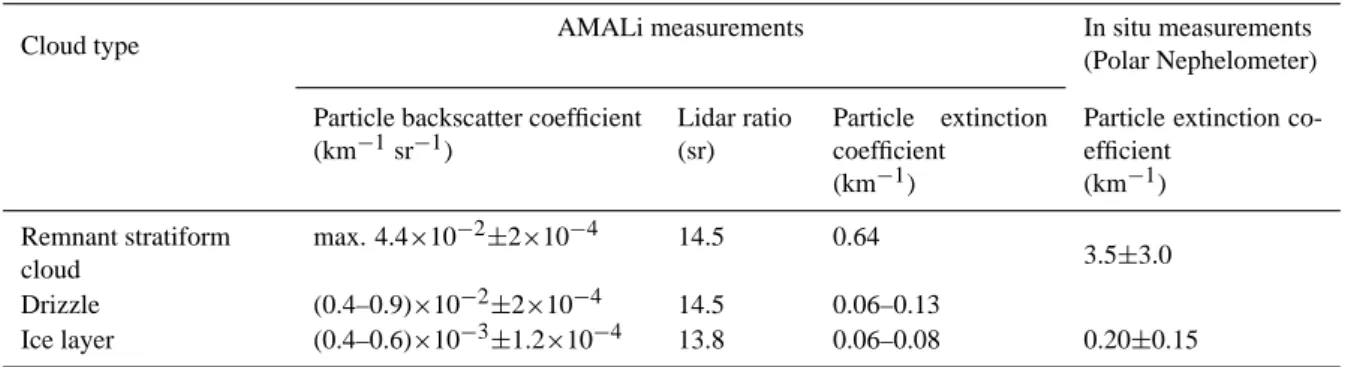
Table 1. Values of the particle backscatter and extinction coefficient with uncertainties (error discussion in text) retrieved from the AMALi observations in three different clouds. The values of the particle extinction coefficient and the lidar ratio derived from the Polar Nephelometer measurements (mean values and standard deviations) are also reported.
Cloud type AMALi measurements In situ measurements
(Polar Nephelometer) Particle backscatter coefficient
(km−1sr−1) Lidar ratio (sr) Particle extinction coefficient (km−1)
Particle extinction co-efficient (km−1) Remnant stratiform cloud max. 4.4×10⁻²±2×10⁻⁴ 14.5 0.64 3.5±3.0 Drizzle (0.4–0.9)×10−2±2×10⁻⁴ 14.5 0.06–0.13 Ice layer (0.4–0.6)×10−3±1.2×10⁻⁴ 13.8 0.06–0.08 0.20±0.15
the airmass advection. A lower sensitivity of the in situ mea-surements for the detection of small particle concentration may also explain parts of the differences in the compared ex-tinction values. Nevertheless, the signatures of these kinds of clouds are clearly evidenced from the in situ measurements and from the lidar profiles in terms of backscatter and De-polarisation ratio. With the prospect of the validation of the retrieved products (i.e. extinction coefficient, particle phase, effective diameter, . . . ) of the new generation of the A-Train satellites (including CALIPSO), an airborne plate-form for in situ observations, like the one presented in this paper, could be an pertinent tool. The experiment strategy should consider co-located observations with the satellite traces in order to get relevant results.
6 Conclusions
During the international ASTAR experiment (Arctic Study of Aerosols, Clouds and Radiation) carried out from Longyear-byen (Spitsbergen) a case study related to observations with ice crystals precipitating down to supercooled boundary layer stratocumulus has been performed from airborne mea-surements provided by an unique combination of remote and in situ instruments. Quasi-simultaneous alternated remote observations of clouds vertical and horizontal structures and Depolarisation effects due to presence of ice particles were combined with in-situ microphysics and optical observations of cloud particles.
Three kinds of clouds with different microphysical and op-tical properties have therefore been alternately observed: (i) water droplets stratiform layer, (ii) drizzle-drops fallstreak and (iii) precipitating ice crystals from cirrus above. The signatures of these clouds are clearly evidenced from the in situ measurements and from the lidar profiles in term of backscatter and Depolarisation ratio. Accordingly, typical lidar ratios are derived from the measured scattering phase function combined with subsequent particle shapes and size
distributions. The remote extinction profiles can therefore be retrieved under favourable conditions of low optical density and compared with the direct in situ measurements, though a further improvement of the methodology needs more co-ordinated observations in space and time. With the prospect of the validation of the retrieved products (i.e. extinction co-efficient, particle phase, effective diameter, . . . ) of the new generation of the A-Train satellites (including CALIPSO), an airborne plate-form for in situ observations, like the one presented in this paper, could be an pertinent tool.
Appendix A
A1 Derivation of the particle backscatter and extinction co-efficients from AMALi data
From the AMALi data, the particle backscatter coefficient profiles βpart(h) were calculated using a Klett’s method
(Klett, 1985) with an assumption of the lidar ratio B(h) (i.e., the particle extinction-to-backscatter ratio). The molecular backscatter coefficient profile βmol(h) also was considered.
A stable solution can be obtained with a reference value of the known particle backscatter coefficient at the far signal range. For a nadir-looking airborne lidar flying at a low al-titude, it is difficult to use such assessment, due to strong variability of atmospheric properties near the ground/sea level. Thus, an iterative procedure was applied to deter-mine reliable particle backscatter coefficient at a reference range (Stachlewska, 2006a). The lidar calibration constant, which contains all depth-independent system parameters, was derived according to the procedure proposed in Stach-lewska (2006b). This provides a way to compute the parti-cle backscatter coefficient value βpart(h0) in a layer of 100 m
below overlap range, i.e. close enough to the aircraft to ne-glect the attenuation of the lidar signal within this range (the transmittance is equal to 1). Thereafter the value βKlettpart(hng)
calculation of the particle backscatter coefficient profile us-ing the Klett’s inversion βKlettpart(h). Then, the calculated value
of the particle backscatter coefficient at the height close to the aircraft βKlettpart(hf) is compared to the estimatedβpart(h0).
If they disagreed by more than 1%, the value of βKlettpart(hng)
is modified according to the Newton method. The βKlettpart(h)
profile is recalculated and both values were compared again. These iterations with changed βKlettpart(hng) are performed until βKlettpart(hf) and βpart(h0) matched.
For these calculations a lidar ratio has to be assumed. For most of the AMALi data under clean clear-sky conditions, the constant lidar ratio of 20–25 sr was assumed (Stach-lewska, 2006b). Because the lidar ratio depends on the parti-cle phase and shape, typical values were evaluated using the approach reported by Jourdan et al. (2003) from measured phase functions by the Polar Nephelometer (see Sect. 5). At the wavelength of 532 nm, the lidar ratios are of 14.5 sr and of 13.8 sr for the water and ice clouds, respectively.
The particle extinction coefficients profiles αpart(h) were
calculated by multiplication of the βKlettpart(h) with a lidar ratio B(h). It was assumed that the lidar ratio profile depends on
the type of particles in a cloud. In the areas where the De-polarisation ratio was large and hence indicated an existence of the ice particles, the lidar ratio corresponding to the value obtained from in situ measurements for the ice crystals was applied. In the areas of low Depolarisation ratio, the lidar ratio corresponding to the in situ value obtained for the water particles was used.
When a lidar probes in optically thick aerosol layers or clouds, measurements are affected by presence of higher or-der scattering. In such cases the Depolarisation ratio can be as large as 50%. For nadir-aiming short-range AMALi we assume that the amount and order of the multiple scattering depend mainly on the range from the lidar, the particle size and the optical depth of the particle layer. The optical depth threshold for a layer from the aircraft altitude downwards was assumed in this case study. The value of the threshold was of 1 for the case study presented here. In the areas were cloud system was thicker, the retrieval was not possible (for example, below the water cloud).
A2 Derivation of the Depolarisation ratio
Depolarisation ratio DR(h) profiles were calculated as the ratio of the background-corrected signals in perpendicular
S⊥(h) and parallel SII(h) channels. The DR(h) profiles
were normalised just below the overlap range of 235 m to a value of 1.44% assumed for the Depolarisation that is due to the air anisotropy (including the Cabannes line and the ro-tational Raman lines). Identical detectors with exactly the same settings (PMT high voltage 850 V, no neutral density filters) were used. For instrumental calibration, the gain ratio
G1=P1/P2was obtained for the raw signals P1and P2
mea-sured on each detector. Then, the detectors were physically
exchanged and the raw signals P′
1 and P
′
2 were measured
to obtain G2=P1′/P2′. The correction gain G=(G1+G2)/2
was not dependent on the polarization and small changes of source light intensity during the measurement. The depen-dence on changes in surrounding temperature was negligible (less than 1%/C◦). High quality of optics used for the po-larization separation and accurate adjustment of optical ele-ments assured very low cross-talk between the perpendicular and parallel channels, i.e., less than 10−6of “wrong” polar-ization was transmitted on each component. In order to avoid the effect of horizontally oriented ice plates on the Depolar-isation ratio, the AMALi was always pointed in nearly the nadir-looking direction (aircraft’s pitch angle ∼7◦). Linear Depolarisation ratio measurements provided a way to dis-tinguish well between spherical DR≈0 and non-spherical 0<DR<1 particles if the assumption of single scattering holds.
A3 Discussion on the errors
In case of the AMALi lidar, for the height chosen just below the overlap range of 235 m, the error associated with neglect-ing the transmittance term varies from 0.7% for the low par-ticle extinction of 1.5×10⁻⁵m−1, which is typical for a clear Arctic atmosphere, up to 2.8% for the particle extinction of 6.×10−5m−1. In the cloud case discussed in this paper, the latter uncertainty was considered. Uncertainties in the parti-cle backscatter coefficient were estimated accordingly to the error propagation. In the case of the nadir-looking short-range lidar, the largest term of the error propagation of the backscatter coefficient profiles is due to the wrong assump-tion of the backscatter calibraassump-tion value 1βpart(h
0), while the
wrong assumption of the lidar ratio contributes much less to the uncertainty (small values of dβ/dB). Due to the short range for the AMALi measurements (the flight altitude < 3 km, and the signal-to-nose ratio >35) the assumption of the constant lidar ratio does not introduce a significant error. The accuracy of the backscatter coefficient calculated with the iterative approach for the different arctic aerosol types was discussed in details by Stachlewska (2006a). According to that study, the highest error value was found to be less than the particle backscatter error of 2.0×10⁻⁷m−1sr−1.
The molecular backscatter coefficient profiles used for the calibration of the particle backscatter coefficient profiles are obtained as a climatology monthly mean of air density and temperature profiles for the Arctic region from the daily ra-diosonding data base of the AWI Koldewey Station in Ny
˚
Alesund, Spitsbergen. The molecular backscatter profile ac-curacy is of ±4.2×10⁻⁸m−1sr−1. For the cloudy areas the
uncertainty of this calibration is negligible.
As for the extinction coefficient profiles, the deviation of the estimated lidar ratio value from the real one is trans-formed directly into an offset of the extinction coefficient.
Acknowledgements. This work was partially funded by the
the CNRS/INSU. Thanks are due to our ASTAR colleagues for their helpful contribution to the experiment. We are very grate-ful to A. Herber (AWI) for supporting our participation on board the Polar-2 aircraft. We thank the members of Optimare and DLR (Deutsches Zentrum f¨ur Luft- und Raumfahrt) who organize the ex-periment management and aircraft operations. We acknowledge J.-F. Fournol and C. Gourbeyre (LaMP) for their technical assis-tance. The authors would like to give recognition to C. Duroure and R. Lefevre (LaMP) and C. Ritter (AWI) for helpful discussions.
The authors and Topical Editor F. D’Andrea thank G. Brogniez and another anonymous referee for their help in evaluating this pa-per.
References
Ansmann, A., Wandinger, U., Riebesell, M., Weitkamp, C., and Michaelis, W.: Independent measurement of extinction and backscatter profiles in cirrus clouds by using combined Raman elastic-backscatter lidar, Appl. Opt., 31, 7113–7131, 1992. Baumgardner, D. and Korolev, A.: Airspeed corrections for
opti-cal array probe sample volumes, J. Atmos. Ocean. Technol., 14, 1224–1229, 1997.
Brogniez, G., Parol, F., B´ecu, L., Pelon, J., Jourdan, O., Gayet, J.-F., Auriol, F., Verwaerde, C., Balois, J.-Y., and Damiri, B.: Determination of cirrus radiative parameters from combination between active and passive remote sensing measurements during FRENCH/DIRAC 2001, Atmos. Res., 72, 425–452, 2004. Chen, W.-N., Chiang, C.-W., and Nee, J.-B.: Lidar Ratio and
De-polarization Ratio for Cirrus Clouds, Appl. Opt., 41, 6470–6476, 2002.
Curry, J. A., Rossow, W. B., Randall, D., and Schramm, J. L.: Overview of Arctic cloud and radiation characteristics., J. Cli-mate, 9, 1731–1764, 1996.
Gayet, J.-F., Febvre, G., Brogniez, G., and Moerl, P.: Microphysical characteristics of a marine stratiform cloud obtained from lidar and in situ measurements, Atmos. Res., 34, 99–115, 1994. Gayet, J.-F., Cr´epel, O., Fournol, J.-F., and Oshchepkov, S.: A new
airborne Polar Nephelometer for the measurements of optical and microphysical cloud properties. Part I: Theoretical design, Ann. Geophys., 15, 451–459, 1997,
http://www.ann-geophys.net/15/451/1997/.
Gayet, J.-F., Auriol, F., Oshchepkov, S., Schr¨oder, F., Duroure, C., Febvre, G., Fournol, J.-F., Cr´epel, O., Personne, P., and Daugeron, D.: In situ measurements of the scattering phase func-tion of stratocumulus, contrails and cirrus, Geophys. Res. Lett., 25, 971–974, 1998.
Gayet, J.-F., Asano, S., Yamazaki, A., Uchiyama, A., Sinyuk, A., Jourdan, O., and Auriol, F.: Two case studies of winter continental-type water and mixed-phase stratocumuli over the sea 1. Microphysical and optical properties, J. Geophys. Res., 107, D21, doi:10.1029/2001JD001106, 2002.
Gayet, J.-F., Ovarlez, J., Shcherbakov, V., Str¨om, J., Schumann, U., Minikin, A., Auriol, F., Petzold, A., and Monier, M.: Cirrus cloud microphysical and optical properties at southern and north-ern midlatitudes during the INCA experiment, J. Geophys. Res., 109, D20206, doi:10.1029/2004JD004803, 2004.
Gregory, D. and Morris, D.: The sensitivity to climate simulations to the specification of mixed phase clouds, Clim. Dynam., 12, 641–651, 1996.
Herber, A., Gayet, J.-F., Hara, K., et al.: Arctic study of tro-pospheric aerosols, clouds and radiation (ASTAR 2004): First results, in: Proceeding of the European Aerosol Conference (EAC’2004), Budapest, Hungary (6–10 September), pp. 299, 2004.
Heymsfield, A. J.: Ice crystal terminal velocities, J. Atmos. Sci., 29, 1348–1366, 1972.
Heymsfield, A. J. and Parrish, J. L.: A computational technique for increasing the effective sampling volume of the PMS two-dimensional particle size spectrometer, J. Appl. Meteor., 17, 1566–1572, 1978.
Jourdan, O., Oshchepkov, S., Shcherbakov, V., Gayet, J.-F., and Isaka, H.: Assessment of cloud optical parameters in the
so-lar region: retrievals from airborne measurements of
scat-tering phase functions, J. Geophys. Res., 108(D18), 4572, doi:10.1029/2003JD003493, 2003.
Klett, J. D.: Lidar inversions with variable backscatter/extinction values, Appl. Opt., 24, 1638–1648, 1985.
Korolev, A. V., Strapp, J. W., Isaac, G. A., and Nevzorov, A. N.: The Nevzorov airborne hot-wire LWC-TWC probe: principle of op-eration and performance characteristics, J. Atmos. Ocean. Tech-nol., 15, 1495–1510, 1998.
Korolev, A. V. and Isaac, G. A.: Ice particle habits in Arctic clouds, Geophys. Res. Lett., 26, 1299–1302, 1999.
Lawson, P., Heymsfield, A. J., Aulenbach, S. M., and Jensen, T. L.: Shapes, sizes and light scattering properties of ice crystals in cirrus and a persistent contrail during SUCCESS, Geophys. Res. Lett., 25, 1331–1334, 1998.
Lawson, P., Baker, B., Pilson, B., and Mo, Q.: In situ observations of the microphysical properties of wave, cirrus and anvil clouds. Part II: Cirrus clouds, J. Atmos. Sci., 63(12), 3186–3203, 2006. Locatelli, J. D. and Hobbs, P. V.: Fall speeds and masses of solid
precipitation particles, J. Geophys. Res., 79, 2185–2197, 1974. Norris, J. R.: Multidecadal changes in near-global cloud cover
and estimated cloud cover radiative forcing, J. Geophys. Res., 110(D24), D24113, doi:10.1029/2004JD005600, 2005. Sassen, K., Griffin, M. K., and Dodd, G. C.: Optical scattering and
microphysical properties of subvisual cirrus clouds, and climate implications, J. Appl. Meteor., 28, 91–98, 1989.
Shcherbakov, V., Gayet, J.-F., Jourdan, O., Minikin, A., Str¨om, J., and Petzold, A.: Assessment of cirrus cloud optical and micro-physical data reliability by applying statistical procedures, J. At-mos. Oceanic. Technol., 22, 409–420, 2005.
Shupe, M. D., Uttal, T., and Matrosov, S. Y.: Arctic cloud retrievals from surface-based remote sensors at SHEBA, J. Appl. Meteor., 44, 1544–1562, 2005.
Stachlewska, I. S., Wehrle, G., Stein, B., and Neuber, R.: Airborne Mobile Aerosol Lidar for measurements of Arctic aerosol, Pro-ceeding of the 22nd International Laser Radar Conference, edited by: Pappalardo, G. and Amodeo, A., ESA SP-561, 87–89, 2004. Stachlewska, I. S.: Investigation of tropospheric arctic aerosol and mixed-phase clouds using airborne lidar technique, PhD The-sis, University of Potsdam, 100 pp., http://opus.kobv.de/ubp/ volltexte/2006/698/, 2006a.
Stachlewska, I. S., Gayet, J.-F., Duroure, C., Schwarzenbock, A., Jourdan, O., Shcherbakov, V., and Neuber, R.: Observations of mixed phase clouds using airborne lidar and in situ instrumen-tation, Revived and revised Papers Presented at the 23rd Inter-national Laser Radar Conference, Chikao Nagasava and Nobuo
Sugimoto, 325–328, 2006b.
Stephens, G. L., Vane, D. G., Boain, J., et al.: The CloudSat Mission and the A-Train: A new dimension of space-based observations of clouds and precipitation, Bull. Am. Meteor. Soc., 83, 1771– 1790, 2002.
Strapp, J. W., Albers, F., Reuter, A., Korolev, A., Maixner, U., Rashke, E., and Vukoviv, Z.: Laboratory measurements of the response of a PMS OAP-2DC, J. Atmos. Oceanic Technol., 18, 1150–1170, 2001.
Sun, Z. and Shine, K. P.: Parametrization of ice cloud radiative properties and its application to the potential climatic importance of mixed-phase clouds, J. Climate, 8, 1874–1888, 1995. Tinel, C., Testud, J., Pelon, J., et al.: The retrieval of ice cloud
properties from cloud radar and lidar synergie, J. Appl. Meteor., 44, 860–875, 2005.