HAL Id: hal-00316756
https://hal.archives-ouvertes.fr/hal-00316756
Submitted on 1 Jan 2000
HAL is a multi-disciplinary open access
archive for the deposit and dissemination of sci-entific research documents, whether they are pub-lished or not. The documents may come from teaching and research institutions in France or abroad, or from public or private research centers.
L’archive ouverte pluridisciplinaire HAL, est destinée au dépôt et à la diffusion de documents scientifiques de niveau recherche, publiés ou non, émanant des établissements d’enseignement et de recherche français ou étrangers, des laboratoires publics ou privés.
Observations of interplanetary scintillation during the
1998 Whole Sun Month: a comparison between
EISCAT, ORT and Nagoya data
P. J. Moran, S. Ananthakrishnan, V. Balasubramanian, A. R. Breen, A.
Canals, R. A. Fallows, P. Janardhan, M. Tokumaru, P. J. S. Williams
To cite this version:
P. J. Moran, S. Ananthakrishnan, V. Balasubramanian, A. R. Breen, A. Canals, et al.. Observations of interplanetary scintillation during the 1998 Whole Sun Month: a comparison between EISCAT, ORT and Nagoya data. Annales Geophysicae, European Geosciences Union, 2000, 18 (9), pp.1003-1008. �hal-00316756�
Observations of interplanetary scintillation during the 1998 Whole
Sun Month: a comparison between EISCAT, ORT and Nagoya data
P. J. Moran1, S. Ananthakrishnan2, V. Balasubramanian3, A. R. Breen1, A. Canals1,
R. A. Fallows1, P. Janardhan4,*, M. Tokumaru5, P. J. S. Williams1
1Physics Department, University of Wales Aberystwyth, Penglais Hill, Aberystwyth, SY23 3BZ, UK 2National Centre for Radio Astrophysics, TIFR, PO Box 3, Ganeshkhind, Pune 411 007, India 3Radio Astronomy Centre, TIFR, PO Box 8, Udhagamandalam 643 001, India
4Department of Astronomy, University of Maryland, College Park, MD 20742, USA 5Solar-Terrestrial Environment Laboratory, Nagoya University, Toyokawa, Aichi 442, Japan * On leave from the Physical Research Laboratory, Ahmedabad 380 009, India
Received: 3 April 2000 / Revised: 30 June 2000 / Accepted: 4 July 2000
Abstract. Observations of interplanetary scintillation (IPS) allow accurate solar wind velocity measurements to be made at all heliographic latitudes and at a range of distances from the Sun. The data may be obtained with either single, double or multiple antennas, each requir-ing a dierent method of analysis. IPS data taken durrequir-ing the 1998 whole sun month (30th July±31st August 1998) by EISCAT, the ORT (Ooty Radio Telescope), India, and the Nagoya IPS system, Japan, allow the results of individual methods of analysis to be compared. Good agreement is found between the velocity measurements using each method, and when combined an improved understanding of the structure of the solar wind can be obtained.
Key words: Interplanetary physics (solar wind plasma; sources of the solar wind) ± Solar physics, astrophysics and astronomy (instruments and techniques)
1 Introduction
Planar wave-fronts from compact radio sources (e.g. quasars) are distorted as they pass through the solar wind creating a moving diraction pattern at the Earth. Observations of this shifting pattern, known as inter-planetary scintillation (IPS), allow properties of the solar wind, such as velocity, ¯ow direction and r.m.s. electron density ¯uctuations, to be determined. For over thirty years, IPS has been used to make measurements at all heliographic latitudes and at a wide range of distances, from inside 10 solar radii out to beyond Earth's orbit (Rickett and Coles, 1991; Coles, 1995).
The earliest multi-site observations were used to obtain values of scintillation index and solar wind
velocity (e.g. Dennison and Hewish, 1967; Hewish and Symonds, 1969), and later dual-site experiments provid-ed continuity and improvements in the analysis tech-nique (e.g. Armstrong and Coles, 1972). The accuracy of velocity measurements was found to improve as the baseline between sites increased (Bourgois et al., 1985) and with some observations, this allowed more than one distinct velocity lying along the line-of-sight to be resolved (Grall et al., 1996).
In recent years, much work has been published on several aspects of the solar wind, such
as:-1. The acceleration region (Grall et al., 1996; Breen et al., 2000)
2. The large-scale structure of solar wind (Moran et al., 1997; Kojima et al., 1998; Asai et al., 1998; Breen et al., 1999)
3. Corotating interaction regions and travelling inter-planetary disturbances (Breen et al., 1997; Janardhan et al., 1996; Manoharan et al., 1995; Tokumaru et al., 2000)
4. The large-scale ¯ow direction of the high latitude wind (Moran et al., 1998)
IPS is now accepted as a powerful ground-based tool for probing the structure of the inner heliosphere, and several groups around the world regularly make a number of dierent types of observation. This work compares results from observations made by the Ooty Radio telescope (ORT, Selvanagayam et al., 1993), the European Incoherent Scatter Radar (EISCAT, Rishbeth and Williams, 1985) and the Nagoya array in Japan (Kojima and Kakinuma, 1990). The ORT is a single antenna operating at 327 MHz, EISCAT comprises three radio telescopes in Northern Scandinavia operat-ing at 931 MHz and the Nagoya array comprises four radio telescopes operating at 327 MHz.
The observing frequency places constraints on the distance from the Sun at which IPS is reliably measured and interpreted. All observations require the plasma density to produce sucient scattering power and cannot, therefore, be made beyond an outer limit. For single-site observations, the inner limit is de®ned by the
Correspondence to: P. J. Moran e-mail: [email protected]
need to be in a region of weak scattering (Hewish, 1951). Closer to the Sun, in strong scattering, it is not possible to calculate the spatial scale of irregularities using a single station and velocity measurements can not be made. Multi-site observations, however, can make measurements closer in, although they are less accurate than measurements made in weak scattering.
The transition region between strong and weak scattering diers in regions of fast and slow solar wind. At solar minimum, the slow equatorial wind is denser than the fast polar wind so that observations must be made further out from the Sun. The transition region is found near the peak in scintillation index with solar distance and can be measured experimentally. The observing window for ORT is approximately 40 to 200 solar radii, whereas Nagoya can make some measure-ments in as far as 20 solar radii. At the higher frequency, EISCAT can make measurements in weak scattering between approximately 15 and 120 solar radii.
The ORT makes nearly 100 observations per day, whereas EISCAT requires the observation to be made when the antennas' lines-of-sight lie parallel to the radial plane passing through the centre of the Sun. The orientation of the three EISCAT telescopes with respect to the solar wind changes as the Earth rotates about its axis and in general there are no more than 10 observa-tions per day for which both geometry and source characteristics are favourable.
The four Nagoya telescopes allow a greater number of opportunities when the geometry between two sites is favourable, and reliable velocity data are available from approximately 40 radio sources a day. However, the largest baseline between antennas is 207 km, so that the ability to resolve more than one distinct velocity along the line-of-sight in a single observation is limited. EISCAT, however, has a maximum baseline of 350 km and in some circumstances the signatures of two distinct velocities can be seen in the cross-correlation function of the power spectra (Breen et al., 1996a). The Japanese group resolve velocities by combining data taken over several complete solar rotations to create synoptic maps of large scale heliospheric activity (Jackson et al., 1997; Asai et al., 1998; Kojima et al., 1998).
2 Observations and analysis
During the 1998 Whole Sun Month (WSM2, 30 July 1998±31 August, 1998), ORT, Nagoya and EISCAT made a total of 1369, 824 and 45 observations respec-tively from which solar wind velocities could be determined.
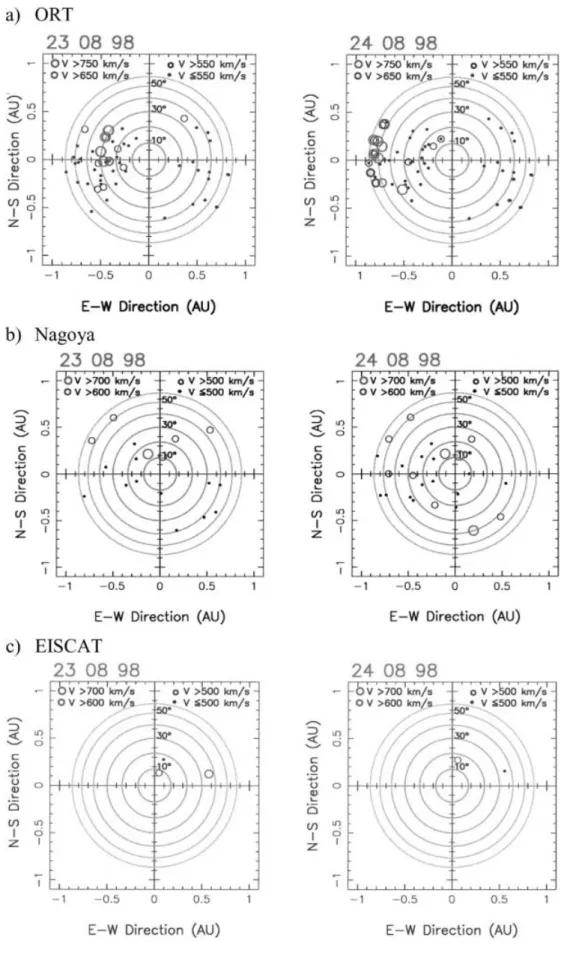
Such large numbers of observations allow ORT and Nagoya to make measurements of the heliosphere with far greater spatial resolution than EISCAT, enabling them to track transient events such as coronal mass ejections (CMEs) over a period of days. Figure 1 shows example plots of solar wind velocity measurements from the three systems as a function of solar elongation (de®ned as the angle subtended between the Earth/Sun line and the Earth/radio source line).
The fast velocity values on the East limbs in Fig. 1a suggest a transient event moving outwards from the Sun. The event is not so clearly evident in the Nagoya data, Fig. 1b, owing to lower spatial resolution. How-ever, analysis of the data to obtain scintillation index, which gives an indication of plasma turbulence, shows enhancements that are consistent with ORT. Corre-sponding eects were also measured by spacecraft and this work is reported in separate papers (Tokumaru et al., 2000; Ananthakrishnan et al., 1999). Figure 1c shows the equivalent EISCAT plots. These measure-ments are on the opposite limb to the proposed CME, but quite clearly, the spatial resolution would be too low to be able to determine the presence of any such event. Velocity estimates from single site IPS observations made by ORT are obtained by modelling the power spectra (Manoharan and Ananthakrishnan, 1990). A similar approach is taken with the EISCAT and Nagoya data, although as each observation involves two tele-scopes, the cross-correlation function of the spectra may also be modelled.
The diraction pattern observed at the Earth is caused by scattering along the whole line-of-sight. In weak scattering, the model sums the scattering power from each point along this line-of-sight, giving each contribution a weighting that is proportional to R)4,
where R is distance from the Sun. The weighting assumes a uniformly expanding solar atmosphere and such a rapid drop-o with distance, therefore, means that the majority of scattering occurs in the region where R is at a minimum (i.e. the point of closest approach to the Sun). The model used for ORT and EISCAT data calculates scattering to values of R at which the contribution is no longer signi®cant. The Nagoya data is modelled to a distance from the Earth of 2 AU. Again, scattering from beyond this point is negligible.
If the radial ¯ux of plasma is relatively uniform, a condition often found near solar minimum for observations at high or low solar latitude, both single and dual-site methods can provide reliable velocity values. However, when there are two or more distinct velocities present, it is necessary to know the region along the line-of-sight occupied by each ¯ow type in order to determine their mean values. Two widely spaced antennas can sometimes resolve such velocities (Jackson et al., 1998; Breen et al., 1996b), but this is more dicult with a single antenna observation and any modelled velocity, therefore, will represent the weighted mean of the two velocities crossing the line-of-sight. The accuracy of velocity estimates also depends on factors such as signal to noise ratio and duration of the observation, and for both observation methods, the modelling is improved with extra information about the heliosphere.
ORT bene®ts from the large number of measure-ments so that the projection eects of observations that are both spatially and temporally close to each other, each of which will have dierent weighted values of velocity, may be used to model two stream velocities. EISCAT, having far fewer measurements, utilises white light coronagraphs taken by the High Altitude
Observatory (HAO) to constrain the modelling. By mapping the radial ¯ow crossing the line-of-sight back to the Sun's surface, the HAO maps allow an estimate to
be made of the regions from which fast and slow ¯ow emerges, enabling the two velocities to be modelled fairly easily (Breen et al., 1996a).
Fig. 1. Solar wind velocity as a function of solar elongation. The axes outside the plots are labelled in terms of astronomical units, whereas inside they are labelled in degrees. The circles of constant radial distance are in-cluded to help guide the eye
3 Results
A speci®c comparison between the three data-sets may be made between observations of the same source for EISCAT and ORT, and mapping the lines-of-sight for these observations back to the Sun's surface as repre-sented by the Nagoya synoptic maps. There were a total of four simultaneous observations made by EISCAT and ORT during the WSM2, the velocity estimates for which are shown in Table 1. There were no simulta-neous observations with EISCAT and Nagoya because of their positions in dierent hemispheres of the Earth. All velocity estimates match well, except for the observation made on 980814 in which the EISCAT data indicated two streams crossing the line-of-sight. The ®tting method included estimates of the proportion of the line-of-sight lying in fast and slow ¯ow and the
relative amount of scattering per unit length between them. The `primary' and `secondary' velocities, there-fore, indicate the dominance of the scattering power produced by each stream.
Figure 2 shows the lines-of-sight for each observation mapped back to the Nagoya synoptic map produced for the Whole Sun Month. It is more dicult to make a direct comparison of velocities between individual IPS measurements and the synoptic map seeing as the map shows regions of ¯ow that are stable over a complete solar rotation. Nevertheless, it is clear that the complete line-of-sight for all the observations of the strongly scintillating quasar 3C273 (1229 + 020) made between the 23 to 25 August lie below the 550 km/s contour. They also tend to lie parallel to the contour lines, especially at the point of closest approach. The mini-mum and maximini-mum values indicated by the contour lines
Table 1. Velocity estimates made by EISCAT and ORT (see text)
Date Source Helio latitude
(degree) Radial distance(R ) Velocity (km/s)
EISCAT ORT Primary Secondary 980814 1120 + 143 20.2 92 820 80 411 29 500 25 980823 1229 + 020 9.1 126 487 21 475 25 980824 1229 + 020 9.3 124 369 20 300 50 980825 1229 + 020 9.5 121 529 16 550 50
Fig. 2. Lines-of-sight for the simultaneous ORT/EISCAT observa-tions mapped back to the synoptic map constructed from the Nagoya IPS data. The lines-of-sight are indicated by the solid black lines. The circled cross indicates where the line-of-sight reaches the Earth and the
circled dot represents the point of closest approach to the Sun. Any point, P, along the line-of-sight may be considered in terms of an angle between OP and Ox, where O represents the centre of the Sun. Divisions of 20 degrees from j are marked with circles
are 425±500 km/s, 375±500 km/s and 300±525 km/s on 23, 24 and 25 August respectively. Whilst all three sets of data on 23 August compare well, the EISCAT and ORT values are below those suggested by Nagoya for 24 August and above those suggested by Nagoya for 25 August. This suggests that ORT and EISCAT are picking up contributions of power from relatively short-term features in the solar wind that are not detectable in the synoptic maps (although individual Nagoya obser-vations would be able to pick up these features).
The observation on 14 August shows the line-of-sight to be orthogonal to the contours at the point of closest approach, giving weight to the validity of the EISCAT two stream velocity ®gures. The angle from the Earth to the point of closest approach is bounded by the 300 and 425 km/s contour lines. Beyond this point, there is a sharp gradient between 0 and 10° in which the velocity rises from 425 to 550 km/s. At approximately 35° beyond the point of closest approach, the line-of-sight enters slow ¯ow again. The ®gures for slow ¯ow agree well with the EISCAT value of 411 km/s. However, EISCAT suggests a fast stream of 820 km/s that does not concur with the synoptic map. Again this suggests that this fast ¯ow is a short-term feature, not present for a complete solar rotation.
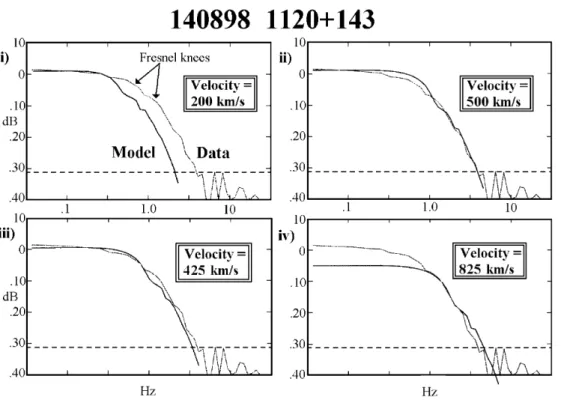
The ORT observation for 14 August was reanalysed using a two-stream model. Modelling of the power spectra relies primarily on the position of the `Fresnel knee', the point at which there is a sharp gradient change in the spectra. The signal to noise ratio was high for 1120 + 143, and as the EISCAT result had shown, the scattering power from the fast stream was less dominant than the slow stream. Two Fresnel knees were identi®ed in the power spectra of this ORT observation, which was consistent with the EISCAT result.
Figure 3 shows the raw spectra with four examples of a single stream ®tted model. Figure 3a shows a model velocity of 200 km/s; clearly inaccurate, but included for demonstration purposes. Figure 3b shows the original model in which the velocity estimate is 500 km/s. Figure 3c and d show models where the two `knees' in the spectra are ®tted separately.
Quite clearly, these two ®tted velocities of 425 25 and 825 25 km/s match the EISCAT ®tted velocities of 411 29 and 820 80 km/s very closely.
4 Conclusions
Single, double and multiple antenna IPS observations make measurements of the solar wind that dier in spatial and temporal accuracy. Single antennas are able to make regular measurements at all heliographic latitudes, allowing the spatial signatures of transient events such as CMEs to be observed.
Double antennas can give more accurate velocity estimates and, if the baseline between them is large enough, can resolve two distinct velocities along the line-of-sight. Far fewer useful observations may be made owing to the need for the appropriate geometrical conditions to be met, so the ability to map the spatial signatures of transients is limited.
In theory multiple antennas should give the best of both worlds. The greater the number of telescopes, the greater the number of two-antenna combinations there are, allowing a large number of accurate observations to be made. However, owing to the bimodal nature of the solar wind speed during solar minimum, it is also often necessary to resolve more than one velocity. If the distance between the sites is insucient to be able to do
Fig. 3a±d. Power spectra (thin line) of the observation of 1120 + 143 on 14 August 1998, with four examples of a ®tted model (thick line). Clearly a modelled velocity of 200 km/s does not match, as shown in a. b Shows the best ®t of the model if a single stream velocity is assumed. c, d Show the ®ts of the two Fresnel knees separately (indicated in a), each yielding a separate velocity. The dashed line indicates the power at which the spectrum falls to the noise level. In general, ®ts are only made when the signal to noise ratio of the spectra is greater than 20 dB
this, a suitable alternative is to use tomographical analysis to build up a large-scale heliospheric map of solar wind activity. What such a map gains in spatial information it loses in temporal information, however, and it is not possible to detect solar events that occur for less than a few days using this method.
The three sets of IPS data from EISCAT, ORT and Nagoya reported in this study are shown to complement each other very well, allowing the accuracy of some individual observations to be enhanced.
Acknowledgement. Topical Editor M. Lester thanks W. Coles and E. Lucek for their help in evaluating this paper.
References
Ananthakrishnan, S., M. Kojima, M. Tokumaru, S. Balasubrama-nian, P. Janardhan, P. K. Manoharan, and M. Dryer, Study of solar wind transients using IPS, Proc. of Solar Wind 9 Conference, Eds. S. R. Habal, R. Esser, J. V. Hollweg, P. A. Isenberg, 471, pp 321±324, AIP Conference Proceessings, New York, 1999.
Armstrong, J. W., and W. A. Coles, Analysis of three-station interplanetary scintillation, J. Geophys. Res., 77, 4602±4610, 1972.
Asai, K., M. Kojima, M. Tokumaru, A. Yokobe, B. V. Jackson, P. L. Hick, and P. K. Manoharan, Heliospheric tomography using interplanetary scintillation observations 2. Correlation between speed and electron density ¯uctuations in the solar wind, J. Geophys. Res., 103, 1991±2001, 1998.
Bourgois, G., W. A. Coles, G. Daigne, J. Silen, T. Turenen, and P. J. S. Williams, Measurements of the solar wind velocity with EISCAT, Astron. Astrophys., 144, 452±462, 1985.
Breen, A. R., W. A. Coles, R. Grall, U.P. Lùvhaug, J. Markkanen, H. Misawa, and P. J. S. Williams, EISCAT measurements of interplanetary scintillation, J. Atmos. Terr. Phys., 58, 507±519, 1996a.
Breen, A. R., W. A. Coles, R. Grall, M. T. Klinglesmith, J. Markkanen, P. J. Moran, B. Tegid, and P. J. S. Williams, EISCAT measurements of the solar wind, Ann. Geophysicae, 14, 1235±1245, 1996b.
Breen, A. R., W. A. Coles, R. R. Grall, M. T. Klinglesmith, J. Markkanen, P. J. Moran, C. A. Varley, and P. J. S. Williams, EISCAT measurements of interaction regions in the solar wind, Adv. Space Res., 20, 27±30, 1997.
Breen, A. R., D. A. Biesecker, A. J. Lazarus, A. Lecinski, J. A. Linker, Z. Mikic, P. J. Moran, B. J. Thompson, C. A. Varley, and P. J. S. Williams, Interplanetary scintillation measurements of the solar wind during Whole Sun Month: comparisons with coronal and in situ observations, J. Geophys. Res. ± Space Phys., 104(A5), 9847±9870, 1999.
Breen, A. R., C. F. DeForest, J. F. McKenzie, A. Modigliani, P. J. Moran, B. J. Thompson, C. A. Varley, and P. J. S. Williams, Comparisons of interplanetary scintillation and optical mea-surements of solar wind acceleration with model results, Adv. Space Res., 26(5), 781±784, 2000.
Coles, W. A., Interplanetary scintillation observations of the high latitude solar wind, Space Sci. Rev., 72(1/2), 211±222, 1995. Dennison, P. A., and A. Hewish, The solar wind outside the plane of
the ecliptic, Nature, 213, 343±346, 1967.
Grall, R. R., W. A. Coles, M. T. Klinglesmith, A. R. Breen, P. J. S. Williams, J. Markkanen, and R. Esser, Rapid acceleration of the polar solar wind, Nature, 379, 429±432, 1996.
Hewish, A., The diraction of radio waves in passing through a phase-changing ionosphere, Proc. R. Soc. London, 209, 81±96, 1951.
Hewish, A., and M. D. Symonds, Radio investigation of the solar plasma, Planet Space Sci., 17, 313, 1969.
Jackson, B. V., P. L. Hick, M. Kojima, and A. Yokobe, Heliospheric tomography using interplanetary scintillation ob-servations, Adv. Space Res., 20(1), 23±26, 1997.
Jackson, B. V., P. L. Hick, M. Kojima, and A. Yokobe, Heliospheric tomography using interplanetary scintillation ob-servations: 1. Combined Nagoya and Cambridge data, J. Geophys. Res., 103, 12 049±12 067, 1998.
Janardhan, P., V. Balasubramanian, S. Ananthakrishnan, M. Dryer, A. Bhatnagar, and P. S. McIntosh, Travelling interplanetary disturbances detected using interplanetary scintillation at 327 MHz, Solar Phys., 166, 379±401, 1996.
Kojima, M., and T. Kakinuma, Solar-cycle dependence of global distribution of solar-wind speed, Space Sci. Rev., 53(3, 4), 173± 222, 1990.
Kojima, M., M. Tokumaru, H. Watanabe, A. Yokobe, K. Asai, B. V. Jackson, and P. L. Hick, Heliospheric tomography using interplanetary scintillation observations 2. Latitude and heliocentric distance dependence of solar wind structure at 0.1±1 AU, J. Geophys. Res., 103, 1981±1989, 1998.
Manoharan P. K., and S. Ananthakrishnan, Determination of solar-wind velocities using single-station measurements of interplanetary scintillation. Mon. Notices R. Astron. Soc., 244(4), 691±695, 1990.
Manoharan P. K., S. Ananthakrishnan, M. Dryer, T. R. Detman, H. Leinbach, M. Kojima, T. Watanabe, and J. Khan, Solar-wind velocity and normalized scintillation index from single-station IPS observations. J. Sol. Phys., 156(2), 377±393, 1995. Moran, P. J., A. R. Breen, W. A. Coles, R. Grall, M. T. Klinglesmith,
J. Markkanen, C. A. Varley, and P. J. S. Williams, EISCAT measurements of the solar wind: measurements of fast and slow streams, Phys. Chem. Earth Sol. Sys., 22(5), 389±392, 1997. Moran, P. J., A. R. Breen, J. Markkanen, C. A. Varley, W. P.
Wilkinson, and P. J. S. Williams, Measurements of the direction of the Solar wind using interplanetary scintillation, Ann. Geophysicae, 16(10), 1259±1264, 1998.
Rickett, B. J., and W. A. Coles, Evolution of the solar wind structure over a solar cycle: interplanetary scintillation velocity measurements compared with coronal observations, J. Geophys. Res., 96(A2), 1717±1736, 1991.
Rishbeth, H., and P. J. S. Williams, Ionospheric radar: the system and its early results, R. Astron. Soc., 26, 478±512, 1985. Selvanagayam, A. J., A. Praveenkumar, D. Nandagopal, and
T. Veluswamy, IETE Technical Rev. 10(4), 333, 1993.
Tokumaru, M., M. Kojima, K. Fujiki, and A. Yokobe, Three-dimensional propagation of interplanetary disturbances detected with radio scintillation measurements at 327 MHz, J. Geophys. Res., 105(A5), 10 435±10 453, 2000.