HAL Id: hal-00299458
https://hal.archives-ouvertes.fr/hal-00299458
Submitted on 26 Oct 2007
HAL is a multi-disciplinary open access
archive for the deposit and dissemination of
sci-entific research documents, whether they are
pub-lished or not. The documents may come from
teaching and research institutions in France or
abroad, or from public or private research centers.
L’archive ouverte pluridisciplinaire HAL, est
destinée au dépôt et à la diffusion de documents
scientifiques de niveau recherche, publiés ou non,
émanant des établissements d’enseignement et de
recherche français ou étrangers, des laboratoires
publics ou privés.
Observation evidences of atmospheric Gravity Waves
induced by seismic activity from analysis of
subionospheric LF signal spectra
A. Rozhnoi, M. Solovieva, O. Molchanov, P.-F. Biagi, M. Hayakawa
To cite this version:
A. Rozhnoi, M. Solovieva, O. Molchanov, P.-F. Biagi, M. Hayakawa. Observation evidences of
atmo-spheric Gravity Waves induced by seismic activity from analysis of subionoatmo-spheric LF signal spectra.
Natural Hazards and Earth System Science, Copernicus Publications on behalf of the European
Geo-sciences Union, 2007, 7 (5), pp.625-628. �hal-00299458�
www.nat-hazards-earth-syst-sci.net/7/625/2007/ © Author(s) 2007. This work is licensed under a Creative Commons License.
and Earth
System Sciences
Observation evidences of atmospheric Gravity Waves induced by
seismic activity from analysis of subionospheric LF signal spectra
A. Rozhnoi1, M. Solovieva1, O. Molchanov1, P.-F. Biagi2, and M. Hayakawa31Institute of the Earth Physics, RAS, Bolshaya Gruzinskaya 10, Moscow, Russia 2University of Bari, Bari, Italy
3University of Electro-Communications, Chofu, Tokyo, Japan
Received: 18 July 2007 – Revised: 28 September 2007 – Accepted: 3 October 2007 – Published: 26 October 2007
Abstract. We analyze variations of the LF subionospheric
signal amplitude and phase from JJY transmitter in Japan (F=40 kHz) received in Petropavlovsk-Kamchatsky station during seismically quiet and active periods including also pe-riods of magnetic storms. After 20 s averaging, the frequency range of the analysis is 0.28–15 mHz that corresponds to the period range from 1 to 60 min. Changes in spectra of the LF signal perturbations are found several days before and after three large earthquakes, which happened in November 2004 (M=7.1), August 2005 (M=7.2) and November 2006 (M=8.2) inside the Fresnel zone of the Japan-Kamchatka wavepath. Comparing the perturbed and background spec-tra we have found the evident increase in specspec-tral range 10–25 min that is in the compliance with theoretical estima-tions on lithosphere-ionosphere coupling by the Atmospheric Gravity Waves (T>6 min). Similar changes are not found for the periods of magnetic storms.
1 Introduction
Different ideas concerning the influence of acoustic and gravity waves upon the upper atmosphere in connection with seismicity have been pushed ahead rather long time ago (see Nekrasov et al., 1995; Gokhberg et al., 1995; Liperovsky et al., 2000 and references therein). For example, attention has been devoted to the direct coupling of precursory seismic os-cillations near the Earth’s eigenmodes (periods ∼1 h) with the Atmospheric Gravity Waves (AGW) at the ground sur-face (Lin’kov et al., 1990; Garmash et al., 1989). However, it has been recognized only recently, that the source had a turbulent nature such as being sporadic in time and exhibit-ing spatial variations. This dictates a change of approach: instead of considering plane (or spherical) waves
propagat-Correspondence to: A. Rozhnoi
Fig. 1. Positions of the earthquake epicenters for 3 periods of strong
seismic activity in 2004–2006.
ing with phase velocity, we need to expand our perturbation as a sum of pulses or structures (wavelets) propagating with group velocity. These two approaches could give more or less equivalent results in a case of isotropic propagation, like as for acoustic waves with frequencies ω>>ωB, where ωBis
the Brunt-Vaisala frequency. However, the second approach is certainly preferable if one is interested in the propagation of perturbation energy by anisotropic waves like AGW in the range ω<ωB(period T>6 min). Propagation of AGW
turbu-lent energy into the upper atmosphere/lower ionosphere was considered by Mareev et al. (2002), Molchanov (2004) and recently by Molchanov and Hayakawa (2007) in details.
Although the mechanism of the atmosphere-ionosphere coupling has been discussed theoretically in many works,
626 A. Rozhnoi et al.: Gravity Waves induced by seismic activity
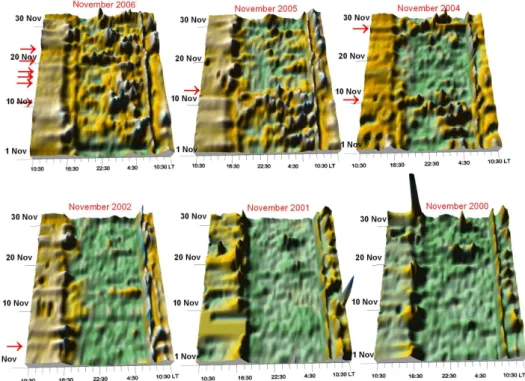
Fig. 2. 3-D image day-to-day sequences of the diurnal variations of the amplitude of LF signal for November, 2000, 2001, 2002, 2004, 2005
and 2006. Arrows indicate the date of the earthquakes with M>6.
the experimental verifications of seismic-associated AGW are not numerous. Ionospheric perturbation was observed on satellites from the tsunami wave front generated by the Sumatra earthquake of 26 December 2004 (Lognonne et al., 2005). Such a perturbation was associated to the coupling between the gravity tsunami wave and atmospheric gravity waves and revealed a time delay of about 1 h. During the pe-riod of seismic activity for the wave-path JJY- Chofu was found a maximum in a spectrum of the amplitude of LF signal in the range below 30 min and a small maximum at 12 min (Molchanov et al., 2001; Miyaki et al., 2002).
In this paper we present the further evidence of AGWs induced by seismic activity from the analysis of LF signal spectra.
2 Observation and results
We analyze variations of the subionospheric LF signal ampli-tude and phase from JJY transmitter in Japan (F=40 kHz) re-ceived in Petropavlovsk-Kamchatsky station. The 20-s digi-tal data of the signal are used. The observations during 2004– 2006 have been included into examination. Three groups of the strongest earthquakes with M>7 which happened in this interval of time in the zone of sensitivity of our wave path (3 Fresnel zones) have been selected. The transmitter and re-ceiver locations together with the distribution of earthquakes epicenters for the period 2004–2006 are shown in Fig. 1.
The first series of earthquakes occurred in November and December 2004 in Hokkaido region (Japan). Within almost 3 months until the first earthquake (M=5.6, 02.11.04) there were no any strong earthquakes with M>5.0 in this region. Night-time “bay-lake” phase and amplitude anomalies of the LF signal have begun 3–5 days before the first earthquake and continued up to the last earthquake of this set (M=6.2, 11 November 2004). Whereupon a period of seismic calm was observed within about a fortnight. Then there followed anomalies of the LF signal before two earthquakes (M=7.1, 28.11.04 and M=6.8, 6.12.04). The next LF anomalies were observed before earthquakes December, 18 and 21 (M=5.8 and M=5.6). During the whole period of seismic activity a significant shift in terminator times was also evident (in detail Rozhnoi et al., 2005).
The second series of strong earthquakes happened near Honshu (Japan) area in August 2005 and consisted of 3 earth-quakes: M=7.2, 16.08.05, M=6.2, 24.08.05, and M=6.2, 30.08.05. Anomalies were observed on the amplitude and phase of the LF signal; they have started 2 days before the first earthquake and lasted during all the period of seismic activity (Rozhnoi et al., 2007).
At last, the very strong earthquake with M=8.3 took place in Central Kuril region (Russia) in 15 November 2006. Fol-lowing to this, a series of strong aftershocks (M=5–6.5) was observed during several months. The monitoring of the LF signal was carried out within 15 days before and 15 days af-ter the main shock. Anomalies of amplitude and phase of the
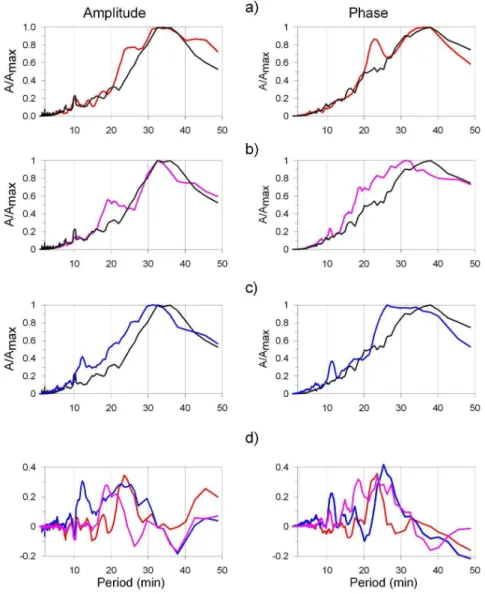
Fig. 3. Normalized spectra of amplitude (left panel) and phase (right panel) of the LF signal for three series of earthquakes. (a) November–
December 2004 – red line; (b) August 2005 – pink line; (c) November 2006 – blue line. Black line – averaged spectrum of 19 quiet days. Differences in spectra density between seismically active and quiet days for three series of earthquakes are shown in panel (d). Colors of lines correspond to the colors on panels (a), (b), (c).
signal have begun about 10 days prior to the earthquake and were observed up to the end of November.
We have analyzed the signal during November for 6 years – 2000–2006 except for 2003 when data were absent (Fig. 2). Only nighttime interval from 19:00 till 07:00 of local time was examined. Variations of the signal are insignificant in 2000 and 2001 when there were no earthquakes in the sensi-tivity zone of the wave path. Small disturbances in the signal (yellow color) are registered within several days in 2002 dur-ing and after an earthquake with M=6.4. Rather strong distur-bances of the signal associated with earthquakes are clearly observed in 2004 and 2005. The longest and the strongest disturbances are obvious for the period of very strong seis-mic activity in 2006. From the analysis of these data we can
conclude that the observed anomalies in the signal are caused by seismic activity.
In previous works we have applied the spectral analysis to several cases of seismically disturbed days (Rozhnoi et al., 2004, 2005). It was found that the maximum of a spectrum had the period about 20–25 min (0.7–0.8 mHz).
In this work we demonstrate the accumulated spectra of the amplitude and phase of the signal for the 3 series of seismic activity described above. Only nighttime of the sig-nal filtered in a frequency band of 0.28–15 MHz that cor-responds to the period range T from 1 to 60 min was used for spectral analysis. Days, where the filtered signal ex-ceeded background more than 3σ (except for magnetically disturbed days), have been included in consideration. The
628 A. Rozhnoi et al.: Gravity Waves induced by seismic activity selected disturbances for each case included several days
be-fore the first quake in the series and anomalous days during all the period of seismic activity. Sometimes it was not clear whether these anomalies were connected with the preseismic perturbation related to the next quake or to the postseismic effect after the previous quake. Anyway we consider it as a manifestation of EQ influence on the upper atmosphere-lower ionosphere boundary that controls the signal proper-ties. Thus 12–15 seismically disturbed days have been se-lected in each case. For comparison the accumulated spectra of 19 days for quiet magnetic and seismic periods have been calculated.
The normalized summary spectra of anomaly days and quiet days for the all series are presented in Fig. 3 together with differential spectra (the difference between the sum-mary spectra of anomaly and quiet days). Each spectrum is normalized by its own Amax.
Both spectra of quiet days and of anomaly days have the main maximum about 30–35 min, but in the spectra of seismo-induced anomaly days a second maximum with pe-riod 20–25 min is clearly observed for all the cases. Some more maxima in the shorter periods range (about 10–12 min) are also revealed for anomaly days. The frequency range of the signal corresponds to the AGW frequency (Miyaki et al., 2002).
As to magnetically disturbed days the shift in lower fquencies, typical for seismically disturbed days, is not re-vealed (Rozhnoi et al., 2005, 2006).
3 Conclusions
As it is mentioned in introduction, the thorough discussion of AGW seismo-associated influence upon ionosphere is pre-sented in the book by Molchanov and Hayakawa (2007) in-cluding consideration of the source properties, AGW turbu-lence propagation into atmosphere, competition with natu-ral atmospheric turbulence, and transformation in the plasma variations at the lower ionosphere. The observation results presented here are more or less in compliance with the theo-retical approach. Note that we did not found any effect in the infrasound frequency range (T=1–5 min).
Acknowledgements. The work was supported by ISTC under Grant 2990.
Edited by: S. Tinti
Reviewed by: D. Trian and another anonymous referee
References
Garmash, S. V., Lin’kov, E. M., Petrova, L. N., and Shved, G. M.: Excitation of atmospheric oscillations of the Earth, Izv. Phys. At-mos. Ocean, 25, 1290–1299, 1989.
Gokhberg, M. B., Morgounov, V. A., and Pokhotelov, O. A.: Earth-quake prediction: seismoelectromagnetic phenomena, Gordon and Breach Sci. Pub., 287 pp., 1995.
Lognonne, P., Jeansou, E., Garcia, R., Artru, J., Occhipinti, G., Cre-spon, F., Achache, J., Helbert, J., and Moreaux, G.: Detection of the Ionospheric perturbation associated to the tsunami of Decem-ber 26th, 2004 with Topex and Jason-1 TEC data, Geophys. Res. Abstracts, 7, 09028, 2005.
Lin’kov, E. M., Petrova, L. N., and Osipov, K. S.: Seismogravity pulsations of the Earth and atmospheric disturbances as possible precursors of strong earthquakes, Doklady RAN, 313, 239–258, 1990.
Liperovsky, V. A., Pokhotelov, O. A., Liperovskaya, E. V., Parrot, M., Meister, C.-V., and Alimov, O. A.: Modification of sporadic E-layers caused by seismic activity, Surveys in Geophysics, 21, 449–486, 2000.
Miyaki, K., Hayakawa, M., and Molchanov, O. A.: The role of gravity waves in the lithosphere-ionosphere coupling, as revealed from the subionospheric LF propagation data, in: Seismo-Electromagnetics (Lithosphere-Atmosphere-Ionosphere Coupling), edited by: Hayakawa, M. and Molchanov, O., Ter-rapub, Tokyo, 229–232, 2002.
Mareev, E. A., Iudin, D. I., and Molchanov, O. A.: Mosaic source of internal gravity waves associated with seismic activity, in: Seismo- Electromagnetics (Lithosphere-Atmosphere-Ionosphere Coupling), edited by: Hayakawa, M. and Molchanov, O., Terra-pub, Tokyo, 335–342, 2002.
Molchanov, O. A., Hayakawa, M., and Miyaki, K.: VLF/LF sound-ing of the lower ionosphere to study the role of atmospheric oscil-lationsin the lithosphere-ionosphere coupling, Adv. Polar Upper Atmos. Res., 15, 146–158, 2001.
Molchanov, O. A.: On the origin of low- and middle-latitude iono-spheric turbulence, Phys. Chem. Earth, 29(4–9) 559–567, 2004. Molchanov, O. and Hayakawa, M.: Seismo-electromagnetics and
related phenomena: History and latest results, TERRUPUB, pp. 432, 2007.
Nekrasov, A. K., Shalimov, S. L., Shukla, P. K., and Stenflo, L.: Nonlinear disturbances in the ionosphere due to acoustic gravity waves, J. Atmos. Terr. Phys., 57, 732–742, 1995.
Rozhnoi, A., Solovieva, M. S., Molchanov, O. A., and Hayakawa, M.: Middle latitude LF (40 kHz) phase variations associated with earthquakes for quiet and disturbed geomagnetic conditions, Phys. Chem. Earth, 29, 589–598, 2004.
Rozhnoi, A. A., Solovieva, M. S., Molchanov, O. A., Hayakawa, M., Maekawa, S., and Biagi, P. F.: Anomalies of LF signal dur-ing seismic activity in November–December 2004, Nat. Hazards Earth Syst. Sci., 5, 1–4, 2005,
http://www.nat-hazards-earth-syst-sci.net/5/1/2005/.
Rozhnoi, A. A., Solovieva, M. S., Molchanov, O. A., Hayakawa, M., Maekawa, S., and Biagi, P. F.: Sensitivity of LF signal to global ionosphere and atmosphere perturbations in the network of stations, Phys. Chem. Earth, 31, 409–415, 2006.
Rozhnoi, A., Molchanov, O., Solovieva, M., Gladyshev, V., Aken-tieva, O., Berthelier, J. J., Parrot, M., Lefeuvre, F., Biagi, P. F., Castellana, L., and Hayakawa, M.: Possible seismo-ionosphere perturbations revealed by VLF signals collected on ground and on a satellite, Nat. Hazards Earth Syst. Sci., 7, 617–624, 2007, http://www.nat-hazards-earth-syst-sci.net/7/617/2007/.