HAL Id: hal-00304870
https://hal.archives-ouvertes.fr/hal-00304870
Submitted on 31 Dec 2005HAL is a multi-disciplinary open access archive for the deposit and dissemination of sci-entific research documents, whether they are pub-lished or not. The documents may come from teaching and research institutions in France or abroad, or from public or private research centers.
L’archive ouverte pluridisciplinaire HAL, est destinée au dépôt et à la diffusion de documents scientifiques de niveau recherche, publiés ou non, émanant des établissements d’enseignement et de recherche français ou étrangers, des laboratoires publics ou privés.
Forest: a comparison between urban and natural areas
(São Paulo State, Brazil)
M. C. Forti, D. C. Bicudo, C. Bourotte, V. de Cicco, F. C. S. Arcova
To cite this version:
M. C. Forti, D. C. Bicudo, C. Bourotte, V. de Cicco, F. C. S. Arcova. Rainfall and throughfall chemistry in the Atlantic Forest: a comparison between urban and natural areas (São Paulo State, Brazil). Hydrology and Earth System Sciences Discussions, European Geosciences Union, 2005, 9 (6), pp.570-585. �hal-00304870�
Rainfall and throughfall chemistry in the Atlantic Forest: a
comparison between urban and natural areas (São Paulo State,
Brazil)
M. Cristina Forti
1, Denise C. Bicudo
2, Christine Bourotte
,3, Valdir de Cicco
4and
Francisco C. S. Arcova
41Instituto Nacional de Pesquisas Espaciais INPE, CP515 S.J.dos Campos, SP/Brasil CEP 12201-970 2Instituto de Botânica, Av. Miguel Stéfano, 3687, CP 4005 São Paulo SP/Brasil CEP 01061-970 3NUPEGEL/USP Av Pádua Dias,11; CP 9, Piracicaba SP/Brasil CEP 13418-900
4Instituto Florestal, R. do Horto, 931 São Paulo SP/Brasil CEP 02377-000 Email for corresponding author: [email protected]
Abstract
Two areas in the Atlantic Forest (São Paulo State, Brazil), with contrasting environments in respect of human occupation, were monitored from 1999 to 2001. One area named PEFI (23o38´08´´ 23o40´18´´ S and 46o36´48´´ 46o38´00´´ W) at an altitude of 798 m a.s.l., 526.4 ha in
area and about 50 km from the sea, lies in a State Park within the largest metropolis of South America São Paulo. The other area, named CUNHA (between 23o13´18´´ and 23o16´10´´ S and 45o02´53´´ and 45o05´15´´ W) about 1050 m a.s.l. with an area of 2854 ha and about 15
km from the sea, is also within a State Park in the Atlantic Forest, but is surrounded by rural areas and small villages. For each area, the rainfall and throughfall chemistry were examined and pH and Na+, K+, Mg2+, Ca2+, NH
4+, Cl, NO3 and SO42 as well as trace metals were
determined. Compared with PEFI, CUNHA is characterised by low chemical fluxes and the largest differences are for the ions such as Ca2+,
H+, NO
3 and SO42 which are mainly anthropogenic in origin. Differences in throughfall chemical fluxes are linked to the nutritional status
of the trees.
Keywords: Atlantic Forest, hydrochemistry, nutrient cycles, rainfall, throughfall, water chemistry
Introduction
In the past, the Atlantic Forest comprised 15% of Brazilian territory, covering as it did almost the whole of the Brazilian coastal region from 25oS (State of Santa Catarina) to 5oS (State of Rio Grande do Norte). Since the European colonisation of Brazil in the 16th century, the Atlantic forest has been exploited so that, nowadays, much of its original area is occupied by farms as well as urban and industrial centres, including the major urban centres of South America such as the Metropolitan Region of São Paulo city (State of São Paulo) which is the fourth largest urban centre in the world with 17 million inhabitants. At present, only about 15% of the original Atlantic Forest in the State of São Paulo is preserved as the Biosphere Reserve. Although protected legally, these areas are still under anthropogenic stress from the presence, nearby, of urban and industrial centres as well
as from exposure to the deposition of pollutants transported through long distances from such centres.
This paper presents the results of a hydrogeochemical study of two key locations within the Atlantic Forest, mainly to characterise the evolution of the water chemistry of the rainfall and throughfall over time and to examine regional differences in the solute depositions from the atmosphere to the soil and vegetative canopy. The study was undertaken in the State of São Paulo, Brazil, at sites with contrasting pollution climates; the one is polluted, while the other is nearly pristine. The changes occurring are linked to the nutritional status of the vegetation; temporal and spatial differences in the concentrations of solute transferred from the atmosphere to the vegetation cover and thence to the soil surface are examined. Here, a hypothesis is tested: forested areas constantly exposed to pollutants are prone to
degradation of their vegetation. A major environmental issue for Brazil is protection of the functioning of the ecosystem as well as of the biological resource of the Atlantic Forest.
Study areas
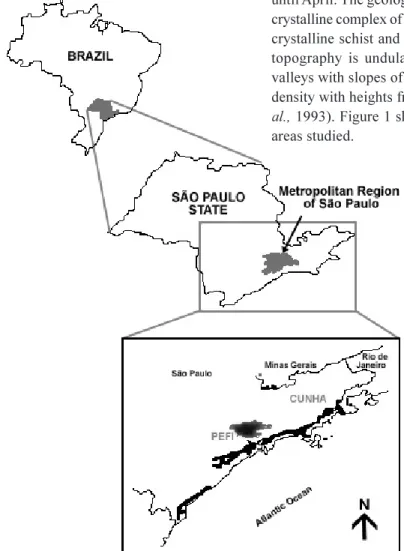
The urban forest studied is in the Parque Estadual das Fontes do Ipiranga (PEFI) between parallels 23o3808 and 23o4018S and meridians 46o3648 and 46o3800W at a mean altitude above sea level of 798 m (Fernandes et al., 2002) and 50 km from the sea shore. The PEFI is a biological reserve 526.4 ha in area within the metropolitan region of São Paulo city in the south-eastern region of São Paulo City County. PEFI includes an area of water source preservation and is a reserve of biodiversity, a natural laboratory for basic and applied research, a controlling factor for micro-climate, a protection for the water table, a natural laboratory for educational programmes and an important recreation area for the community (Bicudo et al., 2002). Its climate is
Fig. 1. Schematic map showing the relative positions of the São Paulo city metropolitan region, PEFI, and CUNHA.
influenced by extra-tropical (e.g. frontal systems) and tropical (e.g. squall lines and convergence zones) systems. The mean annual rainfall (19331999) is 1368 mm, with a dry period from May to August. The mean temperature for the coldest month, July, is 15oC and for January and February, the two hottest months, 2122oC (Santos and Funari, 2002). It is on crystalline rocks with gneisses and secondary micaschists, overlain by clay, sand and gravels of the São Paulo Formation. The topography is undulating, with heights of 770 m to 825 m, being part of the central ridge hills of São Paulo city (Almeida, 1974).
The CUNHA is at 1050 m a.s.l., 15 km from the sea between 23o1328 and 23o1610 S and 45o0253 and 45o0515 W with an area of 2854 ha.
It hosts the Walter Emmerich Forest Hydrology Laboratory of the Institute of Forestry of the State of São Paulo. The mean maximum and minimum temperatures are 26oC and 16oC, respectively. The region can be classed as mist-tropical and mean annual rainfall is 1982 mm (19822000) with the main rainy period from September until April. The geology of the area belongs to the Brazilian crystalline complex of Pre-Cambrian with granites, gneisses, crystalline schist and diabase rocks of Mesozoic age. The topography is undulating, with low, well rounded hills, valleys with slopes of 10 to 20 degrees and a low drainage density with heights from 1050 to 1170 m a.s.l. (Arcova et al., 1993). Figure 1 shows the relative position of the two areas studied.
Methods
SAMPLING PROCEDURE
Rainfall and throughfall water for two wet and two dry periods were sampled from June 1999 to December 2001 in the area of the urban forest (PEFI) (70 samples) and from April 2000 to March 2002 in the control forest (CUNHA) (75 samples). Here, the dry and wet periods refer to the driest (May to August) and the wettest (November to February) months. The water samples were accumulated weekly but, if there was insufficient water after 15 days exposure, the collecting funnel and bottles were substituted with clean ones to minimise dry deposition. The rainfall bulk collector is a polyethylene funnel 167.4 cm2 in collecting area, covered with a nylon mesh of 5 mm to avoid contamination by insects, branches and leaves, coupled to a 5-L polyethylene bottle. A wet-only collector (MTX-Italy) was deployed simultaneously and the two sets of measurements were used to estimate the effect of dry deposition on the rainfall chemistry.
Throughfall was sampled with ten bulk collectors in a 6 × 6 matrix of 36 sampling points 5 m apart in a 30 × 30 m plot. Each of the 36 points was chosen to avoid trees and understorey vegetation and a 1.5m stake was deployed and identified with a number from 1 to 36. The top of each of the 36 stakes enabled a bulk collector to be installed or removed easily. For each sampling interval, the collectors were sited at ten different positions determined by generation of ten random numbers between 1 and 36. The volume of catch was determined gravimetrically. The ten bulk throughfall samples were mixed in proportion to the sample volumes into one composite sample for chemical analysis (Forti et al., 1997; 2000a).
ANALYTICAL PROCEDURE
The waters were vacuum filtered with pre-washed membrane Millipore filters of 0.22 µm pore diameter to allow the determination of the dissolved fraction and to eliminate micro-organisms and fungi spores that might contaminate and degrade the sample. Three sub-samples were taken for chemical analysis: one stored in a high density polyethylene bottle without preservation for anion analysis, one acidified with supra-pure Nitric Acid (1% in volume) for the aluminium and transition metal analysis and one acidified with hydrochloric acid (0.1% in volume) for cation analysis. After the appropriate preservation, all samples were stored at 4oC to avoid sample degradation.
Liquid Ion Chromatography (DIONEX DX500) was employed for the chemical analysis. For the major cations a CS12 analytical column was used with sulphuric acid as
eluent. For the anions, an AS4A analytical column was used. Conductivity detection was used for major cations and anions. For the trace metals (Fe III, CuII, Zn II and Mn II) a UV/Visible detector was used with a CS5A analytical column with post-column derivation with 4-(2-piridilasol) resorcinol and pyridine dicarboxilic acid as eluent, with detection at a wavelength of 530 nm; for aluminium the column was the same and the eluent was sulphuric acid/ ammonium sulphate, with post-column reaction involving pyrocatecol violet and detection at a wavelength of 530 nm. The accuracy was checked against certified reference material samples (TM28 and TM 26.2, trace metal fortified water, National Water Research Institute, Ontario Canada, 1999), standards from the United Kingdom Centre for Ecology and Hydrology Hydrochemistry Laboratory (Robson and Neal, 1997) and CRM 409 No. 629 major compounds in simulated rainwater from the Community Bureau of Reference BCR (Commission of the European Communities). The precision and accuracy of the analysis of the different chemical species in the samples were, respectively, 3% and 7% for Na+, 3% and 9% for K+, 8% and 11% for Mg2+, 8% and 9% for Ca2+, 10% and 11% for NH4+, 3% and 6% for Cl, 3.5% and 10% for NO3, 8% and 8% for SO42, 5% and 7% for Al III, 11% and 8% for Cu II, 11% and 15% for Fe III, 4% and 7% for Mn II and 7% and 11% for Zn II .
PRINCIPAL COMPONENT ANALYSIS (PCA)
Principal component analysis (PCA) was used to reduce the variables to fewer linear combinations of the original variables (Johnson and Wichern, 1988). Broken-stick eigen-values were used to define the number of interpretable axes (Jackson, 1993). Before computation, variables were log transformed to approximate more closely the linear relationships assumed in PCA. For data processing and plotting, FITOPAC (Shepherd, 1996) and PC-ORD version 3.0 for Windows (McCune and Mefford, 1999) packages were used.
Results and discussion
COMPARISON BETWEEN WET-ONLY AND BULK COLLECTORS
A test of the null hypothesis was applied to the wet-only and bulk rainwater samples, with a probability confidence interval of 95% and significance level of 5%. The results for CUNHA indicate that, except for NO3, no differences in the composition of the rainwater for all the chemical species of the two sampling groups were statistically
significant; this finding is in accord with studies in the Amazonian region (Forti et al., 2000b). Correspondingly, the results for PEFI showed that the weighted mean concentration values for K+ and Cl were significantly higher in the samples collected in the bulk collector: dry deposition over the bulk collector was significant during the collection period but the procedure to minimise dry deposition was inefficient for these ions.
Because of the lack of major differences between wet-only and bulk measurements, the study hereafter has been based on the concentrations determined from the samples collected with the bulk collector because one of the objectives of this work is the quantification of the solutes deposited on each ecosystem. The statistical analysis has concluded that rainwater samples accumulated in bulk collectors do not overestimate the concentrations of the chemical species in natural areas or those exposed to low anthropogenic influences. However, the collectors were not exposed for periods longer than seven days.
RAINFALL CHEMISTRY
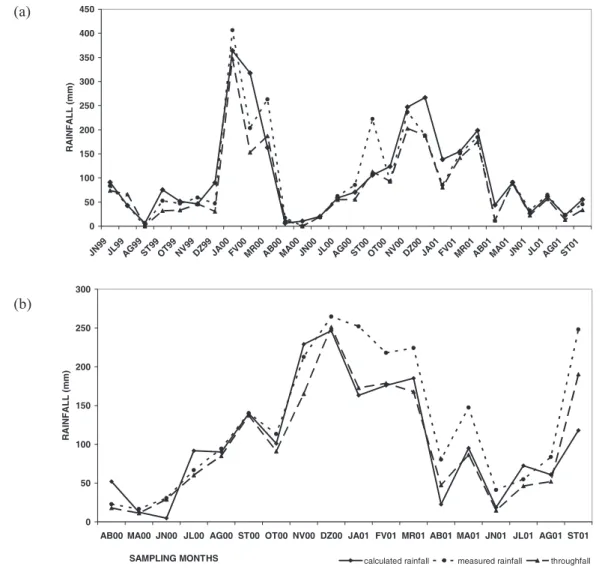
Precipitation was measured monthly at the meteorological stations at each site; for the period of the study, these values and the estimates from volume measurements (rainfall and throughfall) are given in Figs. 2a and 2b.
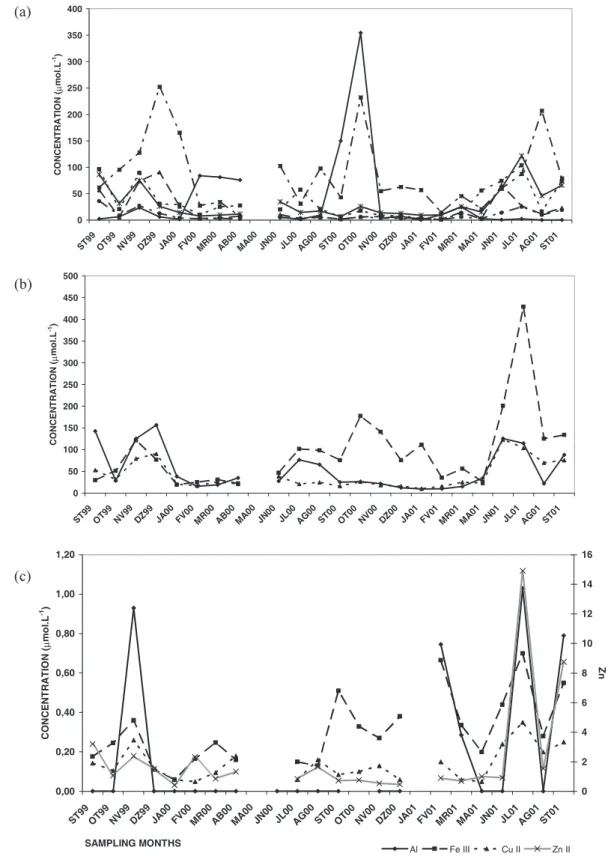
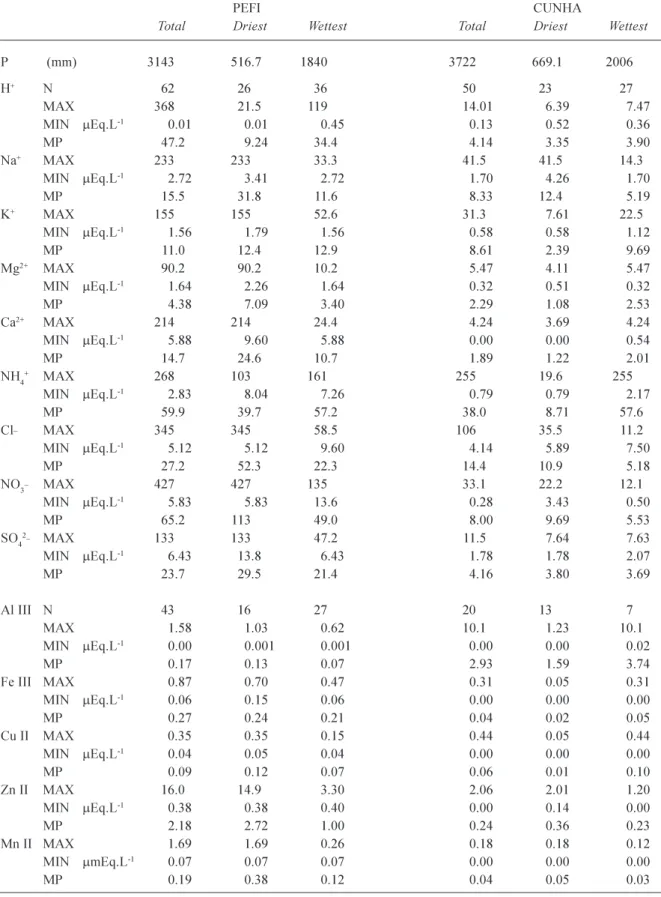
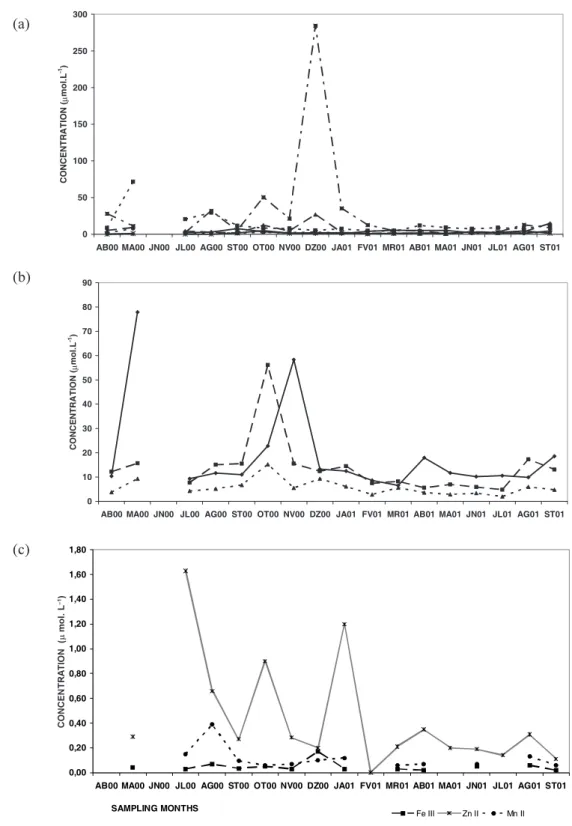
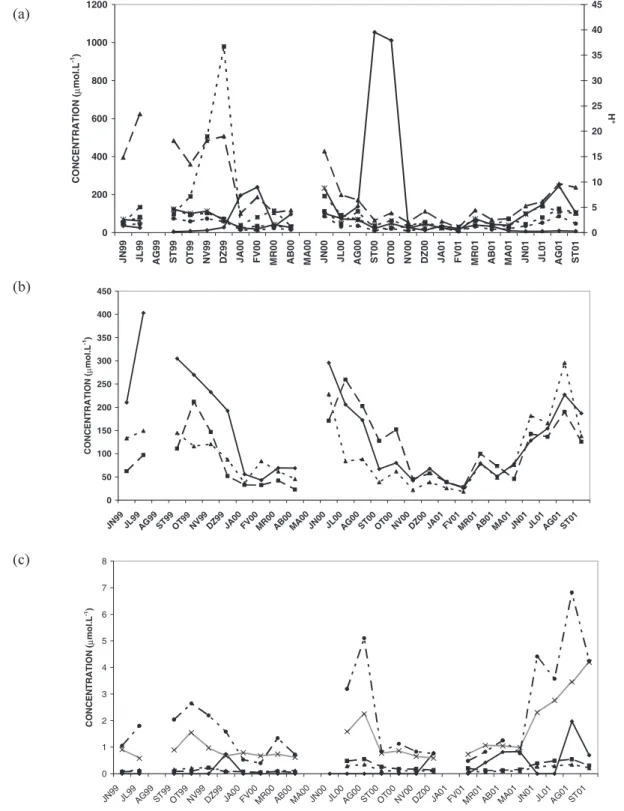
Figures 3 (a, b and c) and 4 (a, b and c) present the mean monthly variations in rainwater chemistry for PEFI and CUNHA, respectively. The highest concentrations occur during periods of low rainfall at both sites. However, at PEFI, the concentrations are significantly higher during the driest months (May to August). For CUNHA, concentrations decrease slightly in the rainiest months (November to February). The concentrations vary over time at PEFI which underlines the importance of pollutant scavenging in the atmosphere.
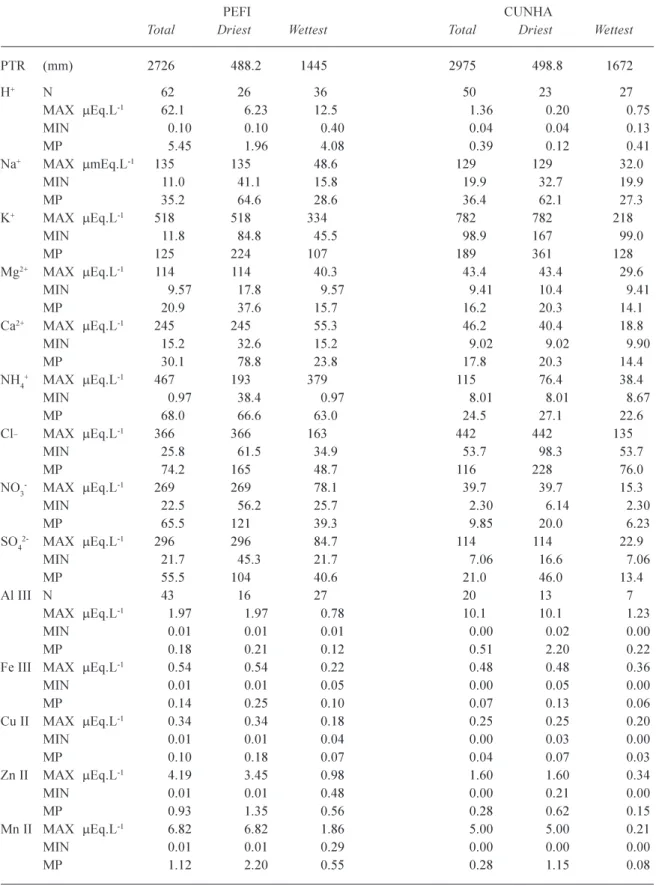
Mean concentrations are calculated as the volume weighted mean (VWM); in Table 1, values for both forests are presented together with maxima and minima for the
0 50 100 150 200 250 300
AB00 MA00 JN00 JL00 AG00 ST00 OT00 NV00 DZ00 JA01 FV01 MR01 AB01 MA01 JN01 JL01 AG01 ST01 SAMPLING MONTHS R A IN FA LL (m m)
calculated rainfall measured rainfall throughfall
0 50 100 150 200 250 300 350 400 450 JN9 9 JL99AG99ST9 9 OT9 9 NV9 9 DZ99JA00FV0 0 MR0 0 AB00MA0 0 JN0 0 JL00AG0 0 ST0 0 OT00NV0 0 DZ0 0 JA01FV01MR01AB0 1 MA0 1 JN01JL01AG0 1 ST01 RAIN F AL L ( m m )
Fig. 2 Monthly mean rainfall in mm at the meteorological station and rainfall and throughfall values calculated from the measured volume for the period studied for (a) the PEFI area and (b) for the CUNHA area
(a)
Fig. 3. Rainfall monthly mean concentration variations in different chemicals at PEFI: (a) major cations (b) major anions (c) transition metals. whole sampling period as well as for the four rainiest and
driest months. Clearly, concentrations vary to a large extent. For PEFI, the rainwater is acidic with a mean pH of 4.3 and there is no significant statistical difference (95% of
confidence interval at 5% of confidence level) between the dry and rainy periods. The mean pH is about 5.4 for CUNHA, without significant seasonal differences. Trace metal concentrations for rainfall at CUNHA are generally
0 50 100 150 200 250 300 350 400 ST99OT99NV9 9 DZ99JA00FV00MR0 0 AB00MA00JN00JL00AG0 0 ST00OT00NV0 0 DZ00 JA01FV01MR01MA0 1 JN01 JL0 1 AG01ST01 CONCE NT RAT ION ( µ m o l.L -1) 0 50 100 150 200 250 300 350 400 450 500 ST9 9 OT99NV9 9 DZ99JA00FV00MR00AB00MA00JN00 JL00AG00ST00OT00NV00DZ00JA01FV01MR01MA01JN01 JL01AG01ST01 CONCEN T RAT ION ( µ m o l.L -1) 0,00 0,20 0,40 0,60 0,80 1,00 1,20 ST99OT99NV9 9 DZ99JA0 0 FV00MR00AB0 0 MA00JN00JL00AG0 0 ST0 0 OT00NV0 0 DZ00JA01FV01MR0 1 MA01JN01JL01AG0 1 ST01 SAMPLING MONTHS CON C ENT RAT IO N ( µ mo l.L -1) 0 2 4 6 8 10 12 14 16 Zn Al Fe III Cu II Zn II (a) (b) (c)
Table 1. Rainfall chemistry in mEq.L1 for the whole period and the driest and wettest months obtained for PEFI and
CUNHA. P: rainfall, mm; N: sample number; MAX: maximum values; MIN: minimum values, MP: volume weighted mean.
PEFI CUNHA
Total Driest Wettest Total Driest Wettest
P (mm) 3143 516.7 1840 3722 669.1 2006 H+ N 62 26 36 50 23 27 MAX 368 21.5 119 14.01 6.39 7.47 MIN mEq.L-1 0.01 0.01 0.45 0.13 0.52 0.36 MP 47.2 9.24 34.4 4.14 3.35 3.90 Na+ MAX 233 233 33.3 41.5 41.5 14.3 MIN mEq.L-1 2.72 3.41 2.72 1.70 4.26 1.70 MP 15.5 31.8 11.6 8.33 12.4 5.19 K+ MAX 155 155 52.6 31.3 7.61 22.5 MIN mEq.L-1 1.56 1.79 1.56 0.58 0.58 1.12 MP 11.0 12.4 12.9 8.61 2.39 9.69 Mg2+ MAX 90.2 90.2 10.2 5.47 4.11 5.47 MIN mEq.L-1 1.64 2.26 1.64 0.32 0.51 0.32 MP 4.38 7.09 3.40 2.29 1.08 2.53 Ca2+ MAX 214 214 24.4 4.24 3.69 4.24 MIN mEq.L-1 5.88 9.60 5.88 0.00 0.00 0.54 MP 14.7 24.6 10.7 1.89 1.22 2.01 NH4+ MAX 268 103 161 255 19.6 255 MIN mEq.L-1 2.83 8.04 7.26 0.79 0.79 2.17 MP 59.9 39.7 57.2 38.0 8.71 57.6 Cl_ MAX 345 345 58.5 106 35.5 11.2 MIN mEq.L-1 5.12 5.12 9.60 4.14 5.89 7.50 MP 27.2 52.3 22.3 14.4 10.9 5.18 NO3_ MAX 427 427 135 33.1 22.2 12.1 MIN mEq.L-1 5.83 5.83 13.6 0.28 3.43 0.50 MP 65.2 113 49.0 8.00 9.69 5.53 SO42_ MAX 133 133 47.2 11.5 7.64 7.63 MIN mEq.L-1 6.43 13.8 6.43 1.78 1.78 2.07 MP 23.7 29.5 21.4 4.16 3.80 3.69 Al III N 43 16 27 20 13 7 MAX 1.58 1.03 0.62 10.1 1.23 10.1 MIN mEq.L-1 0.00 0.001 0.001 0.00 0.00 0.02 MP 0.17 0.13 0.07 2.93 1.59 3.74 Fe III MAX 0.87 0.70 0.47 0.31 0.05 0.31 MIN mEq.L-1 0.06 0.15 0.06 0.00 0.00 0.00 MP 0.27 0.24 0.21 0.04 0.02 0.05 Cu II MAX 0.35 0.35 0.15 0.44 0.05 0.44 MIN mEq.L-1 0.04 0.05 0.04 0.00 0.00 0.00 MP 0.09 0.12 0.07 0.06 0.01 0.10 Zn II MAX 16.0 14.9 3.30 2.06 2.01 1.20 MIN mEq.L-1 0.38 0.38 0.40 0.00 0.14 0.00 MP 2.18 2.72 1.00 0.24 0.36 0.23 Mn II MAX 1.69 1.69 0.26 0.18 0.18 0.12 MIN mmEq.L-1 0.07 0.07 0.07 0.00 0.00 0.00 MP 0.19 0.38 0.12 0.04 0.05 0.03
Fig. 4. Rainfall monthly mean concentration variations in different chemicals at CUNHA: (a) major cations (b) major anions (c) transition metals. 0 50 100 150 200 250 300
AB00 MA00 JN00 JL00 AG00 ST00 OT00 NV00 DZ00 JA01 FV01 MR01 AB01 MA01 JN01 JL01 AG01 ST01
CO NCE NT R A T IO N (µ mo l.L -1) 0 10 20 30 40 50 60 70 80 90
AB00 MA00 JN00 JL00 AG00 ST00 OT00 NV00 DZ00 JA01 FV01 MR01 AB01 MA01 JN01 JL01 AG01 ST01
CO NC E N T R A T IO N ( µ mol. L -1) 0,00 0,20 0,40 0,60 0,80 1,00 1,20 1,40 1,60 1,80
AB00 MA00 JN00 JL00 AG00 ST00 OT00 NV00 DZ00 JA01 FV01 MR01 AB01 MA01 JN01 JL01 AG01 ST01 SAMPLING MONTHS
Fe III Zn II Mn II
close to the detection limits, except for Zn II and Mn II, while for PEFI the concentrations are within the confidence intervals of the analytical method.
Statistical evaluation (to 95% probability) showed a difference between the wet and dry season for the rainfall but not for the mean values of all the chemical determinands at both sites.
THROUGHFALL CHEMISTRY
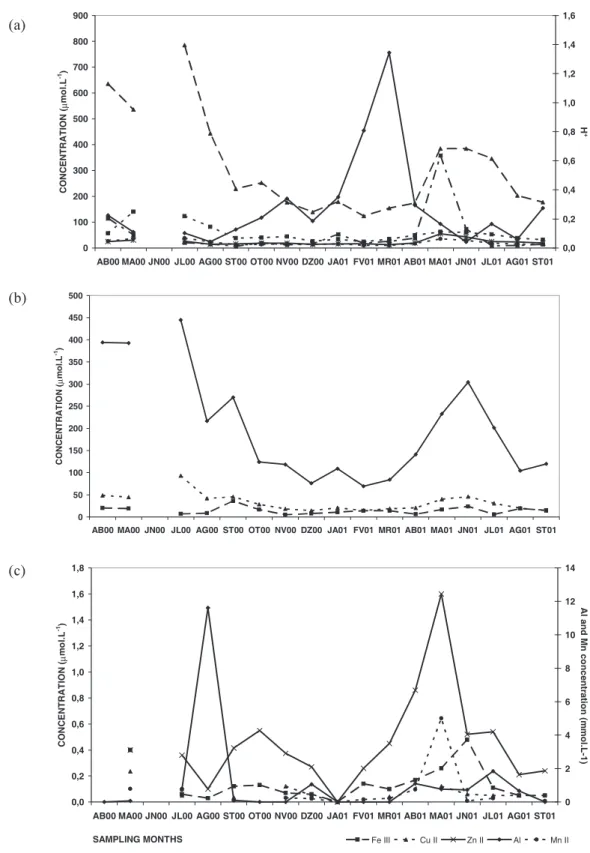
Figures 5 (a, b and c) and 6 (a, b and c) show mean monthly variations (VWM) for each chemical species in throughfall for PEFI and CUNHA, respectively. In both regions, the concentrations for all chemical species are significantly higher in the driest than in the wettest period, because the vegetation is an efficient filter for the airborne particulates (a) (b) (c) CONCENTRA TION ( m mol. L 1)
Fig. 5. Throughfall monthly mean concentration variations in different chemicals at PEFI: (a) major cations (b) major anions (c) transition metals. 0 50 100 150 200 250 300 350 400 450 JN99JL99 AG99ST99 OT99NV9 9 DZ99 JA00FV00MR00AB00MA00 JN00JL00AG00ST0 0 OT0 0 NV0 0 DZ00JA01FV01MR01 AB01MA01JN01JL01AG01ST0 1 CO NC E N T RAT IO N ( µ mo l.L -1) 0 1 2 3 4 5 6 7 8 JN99JL99AG99ST99OT99NV9 9 DZ99JA00FV00MR00AB00MA00JN00JL00 AG00ST00OT00NV00DZ0 0 JA01FV01MR01AB0 1 MA01JN01JL01 AG01ST01 SAMPLING MONTHS C O N C E N T RAT IO N ( µ mo l.L -1) Al III Fe III Cu II Zn II Mn 0 200 400 600 800 1000 1200 JN 99 JL9 9 AG9 9 ST 99 OT 99 NV99 DZ 99 JA 00 FV 00 MR 00 AB0 0 MA 00 JN 00 JL0 0 AG0 0 ST 00 OT 00 NV00 DZ 00 JA 01 FV 01 MR 01 AB0 1 MA 01 JN 01 JL0 1 AG0 1 ST 01 CO NCENT RAT IO N ( µ mo l.L -1) 0 5 10 15 20 25 30 35 40 45 H +
that become trapped in the canopies. The foliage is an active scavenger for several atmospheric components; when rain falls, it interacts with the components in the canopy to form throughfall solutions which interact with the vegetation. Several processes are involved such as wash of soluble species like Na+ and Cl deposited over the vegetation,
leaching of soluble species present like K+ in the foliar tissue or like Ca2+ in its structure, the absorption of available nutrients such as NH4+ and NO3 or precipitated like Al III due to pH changes. Even trace metals, essential elements for biological processing, can be leached. In polluted areas such as PEFI, where the anthropogenic inputs are very high, (a)
(b)
Fig. 6. Throughfall monthly mean concentration variations in different chemicals at CUNHA: (a) major cations (b) major anions (c) transition metals. 0 100 200 300 400 500 600 700 800 900
AB00 MA00 JN00 JL00 AG00 ST00 OT00 NV00 DZ00 JA01 FV01 MR01 AB01 MA01 JN01 JL01 AG01 ST01
CON C ENT R AT IO N (µ m o l.L -1) 0,0 0,2 0,4 0,6 0,8 1,0 1,2 1,4 1,6 H + 0 50 100 150 200 250 300 350 400 450 500
AB00 MA00 JN00 JL00 AG00 ST00 OT00 NV00 DZ00 JA01 FV01 MR01 AB01 MA01 JN01 JL01 AG01 ST01
CO NC E N T R A T IO N (µ mo l.L -1) 0,0 0,2 0,4 0,6 0,8 1,0 1,2 1,4 1,6 1,8
AB00 MA00 JN00 JL00 AG00 ST00 OT00 NV00 DZ00 JA01 FV01 MR01 AB01 MA01 JN01 JL01 AG01 ST01 SAMPLING MONTHS CO NC EN T R A T IO N (µ m o l.L -1) 0 2 4 6 8 10 12 14 A l and Mn co nc ent rat ion (m mol .L-1) Fe III Cu II Zn II Al Mn II
the natural processes of throughfall formation are altered due to the excess of chemicals present in the rainfall and deposited on the vegetation.
Table 2 presents the throughfall chemistry for the whole period and for the four driest and wettest months at both PEFI and CUNHA. The mean throughfall pH is higher at
CUNHA (6.4) than at PEFI (5.3) and, although at CUNHA a seasonal difference is significant statistically, it is not so at PEFI. The PEFIs throughfall is slightly acid indicating that the bases leached from the vegetation and solubilised from the dry deposited material are insufficient to neutralise the acidity introduced by the rainfall. A hypothesis test of (a)
(b)
Table 2. Throughfall chemistry in mEq.L-1 for the whole (TOTAL) period and the driest and wettest months obtained for
PEFI and CUNHA. PTR: throughfall amount mm; N: sample number; MAX: maximum values; MIN: minimum values, MP: volume weighted mean.
PEFI CUNHA
Total Driest Wettest Total Driest Wettest
PTR (mm) 2726 488.2 1445 2975 498.8 1672 H+ N 62 26 36 50 23 27 MAX mEq.L-1 62.1 6.23 12.5 1.36 0.20 0.75 MIN 0.10 0.10 0.40 0.04 0.04 0.13 MP 5.45 1.96 4.08 0.39 0.12 0.41 Na+ MAX mmEq.L-1 135 135 48.6 129 129 32.0 MIN 11.0 41.1 15.8 19.9 32.7 19.9 MP 35.2 64.6 28.6 36.4 62.1 27.3 K+ MAX mEq.L-1 518 518 334 782 782 218 MIN 11.8 84.8 45.5 98.9 167 99.0 MP 125 224 107 189 361 128 Mg2+ MAX mEq.L-1 114 114 40.3 43.4 43.4 29.6 MIN 9.57 17.8 9.57 9.41 10.4 9.41 MP 20.9 37.6 15.7 16.2 20.3 14.1 Ca2+ MAX mEq.L-1 245 245 55.3 46.2 40.4 18.8 MIN 15.2 32.6 15.2 9.02 9.02 9.90 MP 30.1 78.8 23.8 17.8 20.3 14.4 NH4+ MAX mEq.L-1 467 193 379 115 76.4 38.4 MIN 0.97 38.4 0.97 8.01 8.01 8.67 MP 68.0 66.6 63.0 24.5 27.1 22.6 Cl_ MAX mEq.L-1 366 366 163 442 442 135 MIN 25.8 61.5 34.9 53.7 98.3 53.7 MP 74.2 165 48.7 116 228 76.0 NO3- MAX mEq.L-1 269 269 78.1 39.7 39.7 15.3 MIN 22.5 56.2 25.7 2.30 6.14 2.30 MP 65.5 121 39.3 9.85 20.0 6.23 SO42- MAX mEq.L-1 296 296 84.7 114 114 22.9 MIN 21.7 45.3 21.7 7.06 16.6 7.06 MP 55.5 104 40.6 21.0 46.0 13.4 Al III N 43 16 27 20 13 7 MAX mEq.L-1 1.97 1.97 0.78 10.1 10.1 1.23 MIN 0.01 0.01 0.01 0.00 0.02 0.00 MP 0.18 0.21 0.12 0.51 2.20 0.22
Fe III MAX mEq.L-1 0.54 0.54 0.22 0.48 0.48 0.36
MIN 0.01 0.01 0.05 0.00 0.05 0.00 MP 0.14 0.25 0.10 0.07 0.13 0.06 Cu II MAX mEq.L-1 0.34 0.34 0.18 0.25 0.25 0.20 MIN 0.01 0.01 0.04 0.00 0.03 0.00 MP 0.10 0.18 0.07 0.04 0.07 0.03 Zn II MAX mEq.L-1 4.19 3.45 0.98 1.60 1.60 0.34 MIN 0.01 0.01 0.48 0.00 0.21 0.00 MP 0.93 1.35 0.56 0.28 0.62 0.15 Mn II MAX mEq.L-1 6.82 6.82 1.86 5.00 5.00 0.21 MIN 0.01 0.01 0.29 0.00 0.00 0.00 MP 1.12 2.20 0.55 0.28 1.15 0.08
the difference between the mean values for throughfall for the wet and dry periods was undertaken for all chemicals at both sites. There was no statistically significant difference for H+, K+, NH
4+ and Al III for PEFI and for Mg2+, NH4+ and NO3 for CUNHA. The other ions showed significant differences between wet and dry periods.
PCA analyses were carried out for PEFI and CUNHA rainfall and throughfall variables separately. According to the broken-stick model, PCA extracted two interpretable axes of variation from the 13 chemical water variables (Tables 3 and 4) over the entire observational period accordingly with the climatic characteristics: the wettest, driest and transitional months (time interval between the wet and dry seasons).
For PEFI rainfall (Fig. 7a) and throughfall (Fig. 7b), the eigen-values of the two first principal components accounted for 69.2% and 76.5% of the total variance of the observations, respectively (Table 3). Six (rainfall) and eight (throughfall) variables contributed most to the construction of component 1 (r > 0.6). This axis was related negatively to major ionic species except for NH4+ and NO3 for rainfall (Table 3). On the second axis, transition metals were the main variables indicating the diverse processes involved in the incorporation of transition metals in the rainfall and throughfall. For rainfall chemistry, both axes do not contrast
samples from the climatic characteristics indicating a lack of seasonal variation in agreement with the tests of the hypothesis. However, for throughfall chemistry, the first axis contrasts samples from the dry months (which were positively associated with major ionic species) with those from the other periods, mainly the wet months.
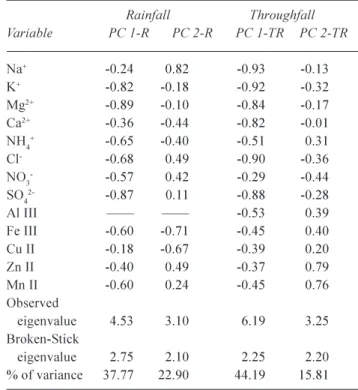
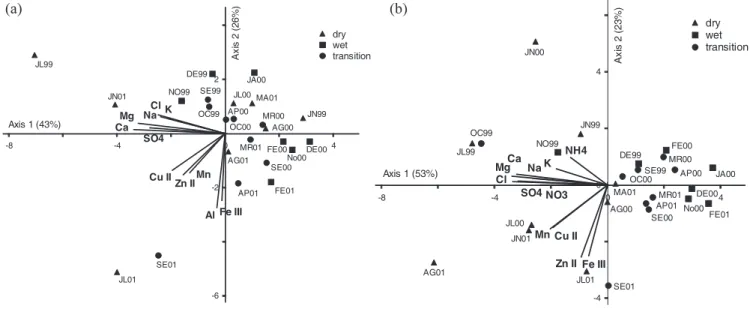
The eigen-values of the two first principal components for CUNHA, rainfall (Fig. 8a) and throughfall (Fig. 8b) represent, respectively, up to 60.7% and 60% of the total variance of the observations (Table 4). For rainfall, five variables contributed most to the construction of component 1 (r > 0.6). This axis was negatively related with the major ionic species except for Na+ and Ca²+ (Table 4). On the second axis, two transition metals, (Fe III and Cu II) and Na+ were the main variables. For throughfall, the major ionic species were highly correlated (r > 0.6) with the first axis (except for NO3) and all transition metals to the second component, indicating that the terrigenous source is accountable for a significant part (16%) of the total variance (Table 4). As was found for PEFI, the analysis indicates no seasonal variation in rainfall chemistry. However, throughfall chemistry was even more clearly separated into wet and dry periods than in PEFI.
Table 3. Loadings of variables on the first two principal components for rainfall (R) and throughfall (TR) water samples in PEFI and the proportion of variance explained by each component. Rainfall Throughfall Variable PC 1-R PC 2-R PC 1-TR PC 2-TR Na+ -0.78 0.40 -0.83 0.25 K+ -0.73 0.38 -0.68 0.39 Mg2+ -0.91 0.32 -0.93 0.29 Ca2+ -0.93 0.20 -0.93 0.19 NH4+ 0.08 0.31 -0.58 0.50 Cl- -0.80 0.42 -0.91 0.32 NO3- -0.07 -0.48 -0.78 0.03 SO42- -0.85 0.24 -0.90 0.20 Al III -0.29 -0.84 -0.18 -0.42 Fe III -0.18 -0.80 -0.42 -0.80 Cu II -0.71 -0.59 -0.70 -0.62 Zn II -0.63 -0.63 -0.49 -0.81 Mn II -0.58 -0.61 -0.72 -0.63 Observed 5.56 3.43 6.94 3.04 eigenvalue Broken-Stick eigenvalue 3.18 2.18 3.18 2.18 % of variance 42.80 26.37 53.40 23.11
Table 4. Loadings of variables on the first two principal components for rainfall (R) and throughfall (TR) water samples in CUNHA and the proportion of variance explained by each component. Rainfall Throughfall Variable PC 1-R PC 2-R PC 1-TR PC 2-TR Na+ -0.24 0.82 -0.93 -0.13 K+ -0.82 -0.18 -0.92 -0.32 Mg2+ -0.89 -0.10 -0.84 -0.17 Ca2+ -0.36 -0.44 -0.82 -0.01 NH4+ -0.65 -0.40 -0.51 0.31 Cl- -0.68 0.49 -0.90 -0.36 NO3- -0.57 0.42 -0.29 -0.44 SO42- -0.87 0.11 -0.88 -0.28 Al III -0.53 0.39 Fe III -0.60 -0.71 -0.45 0.40 Cu II -0.18 -0.67 -0.39 0.20 Zn II -0.40 0.49 -0.37 0.79 Mn II -0.60 0.24 -0.45 0.76 Observed eigenvalue 4.53 3.10 6.19 3.25 Broken-Stick eigenvalue 2.75 2.10 2.25 2.20 % of variance 37.77 22.90 44.19 15.81
JN99 JL99 SE99 OC99 NO99 DE99 JA00 FE00 MR00 AP00 JL00 AG00 SE00 OC00 No00DE00 FE01 MR01 AP01 MA01 JN01 JL01 AG01 SE01 Na K Mg Ca Cl SO4 Al Fe III Cu IIZn IIMn -8 -6 -4 0 4 -2 2 Axis 1 (43%) Ax is 2 (2 6% ) dry wet transition JN99 JL99 SE99 OC99 NO99 DE99 JA00 FE00 MR00 AP00 JN00 JL00 AG00 SE00 OC00 No00 DE00 FE01 MR01 AP01 MA01 JN01 JL01 AG01 SE01 Na K MgCa NH4 Cl NO3 SO4 Fe III Cu II Zn II Mn -8 -4 -4 0 4 0 4 Axis 1 (53%) Ax is 2 ( 23 % ) dry wet transition AP00 MA00 JL00 AG00 SE00 OC00 No00 DE00 JA01 FE01 MR01 AP01 MA01 JN01 JL01 SE01 No01 Na K Mg Ca NH4 Cl NO3 SO4 Fe III Cu II Zn II Mn II -4 -5 -2 0 2 -3 -1 1 3 Axis 1(38%) A xi s 2 (2 3% ) dry wet transition AP00 MA00 JL00 AG00 SE00 OC00 No00 DE00 JA01 FE01 MR01 AP01 MA01 JN01 JL01 AG01 SE01 OT01 No01 DE01 JA02 Na K Mg Ca NH4 Cl NO3 SO4 AlFe III Cu II Zn II Mn II -6 -4 -2 2 -2 0 2 4 Axis 1 (44%) A xi s 2 (16% ) dry wet transition Fig. 7. PCA biplot of variables and scores for the rainfall (a) and throughfall (b) water samples at PEFI. The samples are labelled with month and year, with the symbols representing the climatic periods. For variables correlation with principal components see Table 3.
Fig. 8. PCA biplot of variables and scores for the rainfall (a) and throughfall (b) water samples at CUNHA. The samples are labelled with month and year, with the symbols representing the climatic periods. For correlation of variables with principal components see Table 4.
DEPOSITION OF CHEMICAL SPECIES FROM RAINFALL AND TRHOUGHFALL
The volume weighted mean values of the total amount of each species deposited in kg ha1yr1 were determined by multiplying the concentration by the annual rainfall amount while seasonal deposition was calculated for the four wettest and driest months. (Table 5).
As regards annual depositions, there are marked
anthropogenic inputs of Ca2+, NO
3- and SO42- and transition metals at PEFI as compared to CUNHA, but Al III comes from soil dust sources at CUNHA. The estimated depositions for the transition metals are a fraction of the actual ones because in this work only their cation form is considered. The NH4+ fluxes are equivalent in the two areas during the rainy period; however, equivalent depositions do not mean equivalent sources. During the wettest period larger (a)
(a)
(b)
quantities of all species are deposited than in the driest one because during the wettest months, higher rainfall results in higher depositions at both sites. These results are higher than those from other Brazilian cities (Forti et al., 2001) (Table 6). Depositions at CUNHA are similar to those in a town in the same region on the sea border (Caraguatatuba); values are higher that those found in the Amazon forest for nitrate and sulphate. However, the amount of nitrate at PEFI is by far the largest of all cities.
Throughfall net depositions differ in the two areas, reflecting not only the polluted atmosphere at PEFI and the relatively clean one at CUNHA but also differences in the vegetation and in the nutritional status of that vegetation; these values are shown in Table 7. NH4+ and NO3 are both absorbed in a dry period but less NO3 is absorbed in the wet one, when NH4+ is removed from the vegetation.
The deposition rates for Na+, K+, Mg2+ and Ca2+ at CUNHA are similar for the two periods studied. NH4+ is absorbed in both, in larger amounts in the wettest period and NO3 is absorbed in the driest period. In the wettest period, NO3 is deposited mainly in rainfall. More Cl and SO
42 are deposited in the dry period, mainly in throughfall: the main source of these species is the sea and they are deposited as gas or particles on the vegetation from which they are subsequently washed by the rain.
The concentrations for the transition metals may be underestimated because they refer only to their free metallic ions form rather than to the total amount and transition
Table 6. Nitrate and sulphate deposition values (in kg ha1yr1) for
other Brazilian regions
Areas near sea shore NO3 SO42
Highly-Moderately industrialised (more then a million inhabitants)
Porto Alegre 6.82 178
Florianópolis 4.96 268
Cubatão/Mogi 48.4 310
Fortaleza 4.96 13.5
Niteroi/RJ 8.06 22.6
Urban (less then 500 million inhabitants)
Caraguatatuba 8.06 21.1 Natal 0.62 3.36 Rural Cubatão/Paranapiacaba 5.58 44.2 Piracicaba* 9.92 12.0 Amazon Forest Central** 4.96 20.1 Northeastern 4.34 14.9
Source: Forti et al. 2001 * more them 150 km from sea ** about 1000 km from sea
Table 5. Annual (kg.ha-1.yr-1) and seasonal deposition (kg.ha-1: four wettest and driest months) through the rainwater (CH) and throughfall
(TR) for PEFI and CUNHA areas.
PEFI CUNHA
Year Driest Wettest Year Driest Wettest
CH TR CH TR CH TR CH TR CH TR CH TR kg ha-1y-1 kg ha-1 kg ha-1 y-1 kg ha-1 H+ 0.59 0.06 0.02 0.01 0.32 0.03 0.08 0.01 0.01 0.00 0.04 0.00 Na+ 4.49 8.82 1.89 3.63 2.45 4.75 3.56 12.4 0.96 3.56 1.20 5.26 K+ 5.40 53.1 1.26 21.4 4.65 30.4 6.26 110 0.31 35.2 3.80 42.0 Mg2+ 1.34 5.55 0.45 2.23 0.76 2.75 1.04 5.86 0.09 1.23 0.62 2.87 Ca2+ 7.41 16.7 2.55 7.72 3.94 6.89 1.41 10.6 0.16 2.03 0.81 4.84 NH4+ 13.6 13.4 1.85 2.93 9.48 8.19 12.7 6.56 0.53 1.22 10.4 3.41 Cl- 12.1 28.7 4.79 14.3 7.29 12.5 9.53 61.3 1.29 20.2 2.92 22.6 NO3- 50.8 44.3 18.1 18.4 28.0 17.6 9.23 9.09 2.01 3.09 3.44 3.23 SO42- 28.6 58.1 7.33 24.4 18.9 28.2 7.43 30.1 1.22 11.0 3.56 10.7 Al III 0.06 0.05 0.01 0.01 0.02 0.02 1.47 0.20 0.14 0.15 1.01 0.05 Fe III 0.19 0.09 0.04 0.03 0.11 0.04 0.04 0.06 0.01 0.02 0.03 0.03 Cu II 0.07 0.07 0.02 0.03 0.04 0.03 0.07 0.03 0.01 0.01 0.06 0.02 Zn II 1.79 0.67 0.46 0.22 0.60 0.26 0.29 0.27 0.08 0.10 0.15 0.08 Mn II 0.13 0.67 0.05 0.29 0.06 0.22 0.04 0.23 0.01 0.16 0.02 0.04
metals in colloidal and complexed form can be important. Therefore, their estimated deposition rates may well represent only a fraction of the real input to the areas. The natural source of Al III is the soil, though in PEFI, the Al III anthropogenic contribution is important and Al III may be solubilised from the dust deposited over the canopy. As a function of changes in the pH of the solution, deposition values may indicate that precipitation of Al III may be occurring. The same is probably true for Fe III, while Zn II and Mn II are important micronutrients and therefore active species within the canopy. The deposition values indicate that the vegetation is absorbing Zn II and that Mn II is being leached from the vegetation. Cu II is found in trace amounts. Studies of the chemical composition of urban particulate matter showed that trace metals such as Cu, Mn and Zn are present in readily water-soluble and available forms (Fernandéz-Espinosa et al., 2002; Voutsa and Samara, 2002). Kyotani and Iwatsuki (2002) pointed out that most of these elements are present as sulphates, nitrates and chlorides; this explains why they are leached easily from vegetation by rain and throughfall after dry deposition and/or rain events. Knowledge of these transition metals in rainfall and throughfall is rare and detailed studies are necessary to understand their functioning in these solutions.
The removal of active elements in the biogeochemical cycles as K, Mn and N reflects leaching or consumption processes by the foliar surfaces. K+ is easily leached from the vegetation and its flux at CUNHA is twice that calculated for PEFI. Arcova and Cicco (1987) also observed high K
fluxes in this region. In other tropical forest regions such as the preserved forests of Panama (Golley et al., 1978), in São Paulo State, (Meguro et al., 1979), and in the Cardoso Island Atlantic forest (Varjabedian, 1994), amongst others, high potassium fluxes in throughfall have been found. According to Lopes (2000), the high humidity environment of these tropical forests favours K internal recycling as well as its leaching from the arboreal vegetation and its associated epiphytic flora. The lower fluxes of K+ observed at PEFI can be attributed to a deficiency of that nutrient in the vegetation, which can be related to a lack of K+ in the soil. Fluxes of Mg2+ in PEFI are larger than in CUNHA, reflecting a larger availability in the vegetation; its leaching from the vegetation has been associated with low concentrations in the soil solution and in the drainage waters so that Mg is recycled quickly by the vegetation (Nihlgärd et al., 1994). Mg2+ is an important nutrient and is usually leached from the vegetation together with K+. Although an anthropogenic source of Mg certainly exists at PEFI, its flux is the same as that at CUNHA, suggesting that the vegetation at PEFI is also deficient in Mg. The smaller fluxes of K+ and Mg2+ at PEFI may well be a consequence of the high deposition rates of anions that take with them the basic cations. One of the effects related strongly with soil acidification is the leaching of nutrients such as potassium, calcium, magnesium and ammonium (Lopes, 2000).
In CUNHA, deposition rates are low. NH4+ absorption occurred mainly during the rainy period, at which season the transfer of NO3 to throughfall was low. In PEFI, deposition rates are high with no substantial transference of both ions to throughfall. NH4+ is absorbed in the dry season and transferred at low rates during the rainy season, whereas NO3 is absorbed at high rates over the whole year. Annual figures of 1.5% and 12% of NO3- absorption were registered for CUNHA and PEFI, respectively.
Such differences in deposition, absorption, and transference of NH4+ and NO3 probably reflect the composition and functioning of the natural plant communities in the contrasting areas. In the heavily polluted industrial area of Cubatão (SP, Brazil), NH3/NH4+ was the predominant form of nitrogen in wet deposition, as well as a probable nitrogen source for vegetation; the study by Steward et al., (2002) of nitrogen isotope signatures of vegetation in the area indicated the presence of species that used deposited NH3/NH4+ as their main source of nitrogen, as well as species with a high potential for using NO2 or NO3 as nitrogen sources. Moreover, the vegetative succession must be taken into account as PEFI is a disturbed area. Recent results for an Atlantic Forest succession in southeastern Brazil (Aidar et al., 2003) indicated a continuum of species with different nitrogen use strategies
Table 7. Net throughfall deposition (kg.ha-1.yr-1) for the whole
period and the driest and wettest ones (kg.ha-1).
PEFI CUNHA
Total Driest Wettest Total Driest Wettest
kg ha-1yr-1 kg ha-1 kg.ha-1yr-1 kg ha-1 H+ -0.53 -0.01 -0.29 -0.07 -0.01 -0.04 Na+ 4.33 1.74 2.30 8.84 2.60 4.06 K+ 47.7 20.1 25.8 104 34.9 38.2 Mg2+ 4.21 1.78 1.99 4.82 1.14 2.25 Ca2+ 9.29 5.17 2.95 9.19 1.87 4.03 NH4+ -0.20 1.08 -1.29 -6.14 0.69 -6.99 Cl- 16.6 9.51 5.21 51.8 18.9 19.7 NO3- -6.50 0.30 -10.4 -0.14 1.08 -0.21 SO42- 29.5 17.1 9.30 22.7 9.78 7.14 Al III -0.01 0.00 0.00 -1.27 0.01 -0.96 Fe III -0.10 -0.01 -0.07 0.02 0.01 0.00 Cu II 0.00 0.01 -0.01 -0.04 0.00 -0.04 Zn II -1.12 -0.24 -0.34 -0.02 0.02 -0.07 Mn II 0.54 0.24 0.16 0.19 0.15 0.02
across the forest. Representing the extremes, the pioneer species had high leaf nitrogen contents and a high capacity for leaf nitrate assimilation, and responded to the increase in soil nitrogen availability, whereas late secondary species had low leaf nitrogen contents, low leaf nitrate assimilation capacity and little capacity to respond to soil nitrogen availability among other characteristics. Therefore, nitrogen transference through the canopy is closely linked to the nitrogen use strategies of different species and may be indicative of anthropogenic sources of nitrogen as well as of the vegetation structure and functioning. PEFI vegetation is a mosaic, with degraded and recovering areas having different successional species and just a few dominant ones (Pivello and Peccinini, 2002). Consequently, the area is expected to have a high capacity for nitrogen use.
Ca2+ is more vulnerable to the leaching processes during senescence as it is mostly present in the structural parts of the vegetation. However, such periods were not identified in this work. Some of the Ca2+ fluxes at PEFI certainly originated in building construction and in dust resuspended by vehicular traffic.
The presence in the throughfall solution of less active elements in the biogeochemical cycle, such as Cl and S, for which the leaching and consumption are irrelevant, originated from direct deposition over the canopy. These chemicals have a natural source in marine aerosols and in the condensation nuclei in clouds and are incorporated by the throughfall through the washout of the vegetation. At CUNHA, one important source of SO42 is the marine aerosol, while at PEFI anthropogenic sources are dominant over the natural ones.
Fluxes of transition metals are generally low even at PEFI and this is certainly because they have been underestimated here. Significant fluxes were found for Zn II and for Mn II, essential metals (micronutrients) for the vegetation; retention of Zn II by the vegetation indicates that it is being fixed. For Mn II, removal rates from the vegetation at PEFI are 80% while at CUNHA they range from 82% on average to 94% during the wettest period.
Conclusions
The characteristics of deposition of the major species and transition metals in contrasting Atlantic Forest areas differ. In an area of remnant forest in an urban environment with high atmospheric pollution, the deposition of solutes from rain is much higher than that far from major urban centres. The analysis of net throughfall fluxes provides evidence for differences in the nutritional status of the vegetation in the two areas. These differences can be attributed to the action of pollutants on the mass of vegetation as well as on
the soils which are affected by high inputs of nitrate and sulphate that lower values of pH, so inducing acid substances in the soil. In addition to the direct effect on the canopy, the local vegetation will become degraded because of a decrease in the nutrient supply and/or a nutritional disequilibrium As reported by Lopes (2000) for the Atlantic Forest in the Cubatão area, the degradation of vegetation results in a loss of nutrients because, together with the soil organisms, they are important in nutrient storage and recycling and in maintaining the closed internal cycles and preventing losses by leaching.
Acknowledgements
This work has been supported by the State of São Paulo Research Foundation (FAPESP) Process FAPESP 99/05204-4. The authors thank technicians Veralucia C. de Lima (IAG/ USP) and João B. A. dos Santos (IF/SMA) whose field activities made this work possible, as well as the anonymous reviewers for suggesting revisions to this paper.
References
Aidar, M.P.M., Schmidt, S., Moss, G., Stewart, G.R. and Joly, C.A., 2003. Nitrogen use strategies of neotropical rainforest trees in threatened Atlantic Forest. Plant Cell Environ., 26, 389399. Almeida, F.F.M., 1974. Fundamentos geológicos do relevo
paulista. Serie: Teses-Monografias do Inst. Geogr. Univ. S Paulo, São Paulo, 14, 599.
Arcova, F.C.S. and de Cicco, V., 1987. Fluxo de nutrientes através da precipitação, precipitação interna e escoamento pelo tronco em floresta natural secundária no Parque Estadual da Serra do Mar - Núcleo Cunha - SP. Boletim Técnico do I.F., São Paulo,
41, 3758.
Arcova, F.C.S., de Cicco, V. and Shimomichi, P.Y., 1993. Qualidade da água e dinâmica dos nutrientes em bacia hidrográfica recoberta por floresta de Mata Atlântica. Rev. Inst. Flor. São Paulo, 5, 121.
Bicudo, D.C., Forti, M.C. and Bicudo, C.E., 2002. Parque Estadual das Fontes do Ipiranga (PEFI) Unidade de Conservação Ameaçada pela Urbanização de São Paulo, Edited by State Secretary of the Environment (Secretaria estadual do Meio Ambiente), 351pp.
Fernandes, A.J., Reis, L.A.M. and Carvalho, A., 2002. Caracterização do Meio Físico. In: Parque Estadual das Fontes do Ipiranga (PEFI): uma unidade de conservação ameaçada pela urbanização de São Paulo, D.C. Bicudo, M.C. Forti and C.E.M.Bicudo (Eds.) Secretaria do Meio Ambiente do Estado de São Paulo, Brazil. 4962.
Fernandéz-Espinosa, A.J., Rodriguéz, M.T., Rosa, J.B. and Sánchez, J.C.J., 2002. A chemical speciation of trace metals for fine urban particles. Atmos. Environ., 36, 773780.
Forti, M.C., Melfi, A.J., and Amorim, P.R.N., 1997. Hidroquímica das águas de drenagem de uma pequena bacia hidrográfica no nordeste da Amazônia: efeitos de sazonalidade (Estado do Amapá, BR). Geochim. Bras., 11, 325.
Forti, M.C., Boulet, R., Melfi, A.J. and Neal, C., 2000a. Hydrochemistry of a small catchment in Northeastern Amazonia: a comparison between natural with deforested parts of the
catchment (Serra do Navio, Amapá State, Brazil). Water Air Soil Pollut., 118, 263279.
Forti, M.C., Melfi, A.J., Astolfo, R. and Fostier, A.-H., 2000b. Rainfall chemistry composition in two ecosystems in the northeastern Brazilian Amazon (Amapá State). J. Geophys. Res.,
105D, 2889528905.
Forti, M.C., Carvalho, A., Melfi, A.J. and Montes, C.R., 2001. Deposition patterns of SO42-, NO3- and H+ in the Brazilian
Territory. Water Air Soil Pollut., 130, 11211126.
Golley, F.B., McGinnis, J.T., Clements, R.G. Child, G.I. and Duever, M.J., 1978. Ciclagem de minerais em um ecossistema de floresta tropical úmida. Editora da Universidade de São Paulo (EDUSP), São Paulo, Brazil. 265pp.
Jackson, D.A., 1993. Stopping rules in principal components analysis: a comparison of heuristical and statistical approaches. Ecology, 74, 22042214.
Johnson, R.A. and Wichern, D.W., 1988. Applied multivariate statistical analysis. Prentice-Hall, Englewood Cliffs, New Jersey, USA.
Kyotani, T. and Iwatsuki, M., 2002. Characterization of soluble and insoluble components in PM2.5 and PM10 fractions of
airborne particulate matter in Kofu city, Japan. Atmos. Environ.,
36, 639649.
Lopes, M.I.M.S., 2000. Fluxo de água, balanço químico e alterações no solo Floresta Atlântica atingida pela poluição aérea de Cubatão, SP, Brasil. PhD. Thesis, University of São Paulo State, Brazil. 188 pp.
Meguro, M., Vinueza, G.N. and Delitti, W.B.C., 1979. Ciclagem de nutrientes na mata mesófila secundária São Paulo. II: o papel da precipitação na importação de potássio e fósforo. Boletim de Botânica, Universidade de São Paulo, Brazil. 7, 6167.
McCune, B. and Mefford, M.J., 1999. PC-ORD for Windows. Multivariate analysis of ecological data, version 4.10. MjM Software Design, Oregon, USA. 47 pp.
Nihlgärd, B.J., Swank, W.T. and Mitchell, M.J., 1994. Biological processes and catchment studies in: Biogeochemistry of small catchment. A tool for research, B.Moldan and J.Cerny (Eds.). SCOPE 51, Wiley, Chichester, UK. 133161,
Pivello, V.R. and Peccinini, A.A., 2002. A vegetação do PEFI, In: Parque Estadual das Fontes do Ipiranga (PEFI): uma unidade de conservação ameaçada pela urbanização de São Paulo, D.C. Bicudo, M.C. Forti and C.E.M.Bicudo (Eds.). Secretaria do Meio Ambiente do Estado de São Paulo, Brazil. 7593. Robson, A.J. and Neal, C., 1997. Regional water quality of river
Tweed. Sci. Total Environ., 194/194, 173192.
Santos, M.P. and Funari, F.L., 2002. Clima Local, In: Parque Estadual das Fontes do Ipiranga (PEFI): uma unidade de conservação ameaçada pela urbanização de São Paulo, D.C.Bicudo, M.C.Forti and C.E.M.Bicudo, (Eds.) Secretaria do Meio Ambiente do Estado de São Paulo, Brazil. 2948. Shepherd, G.J. 1996. Fitopac 1: manual do usuário. Departamento
de Botânica, UNICAMP. Campinas, Brazil. 95pp.
Steward, G.R., Aidar, M.P.M., Joly, C.A. and Schmidt, S., 2002. Impact of point source pollution on nitrogen isotope signatures (15N) of vegetation in SE Brazil. Oecologia, 131, 468472.
Varjabedian, R., 1994. Aspectos comparativos da ciclagem de nutrientes minerais em Mata Atlântica de encosta e em mata sobre restinga, no Parque Estadual da Ilha do Cardoso, SP. Master Thesis, University of São Paulo State, Brazil. 177pp. Voutsa, D. and Samara, C., 2002. Labile and bioaccessible fractions
of heavy metals in the airborne particulate matter from urban and industrial areas. Atmos. Environ., 36, 35833590.