HAL Id: hal-00304985
https://hal.archives-ouvertes.fr/hal-00304985
Submitted on 1 Jan 2004HAL is a multi-disciplinary open access archive for the deposit and dissemination of sci-entific research documents, whether they are pub-lished or not. The documents may come from teaching and research institutions in France or abroad, or from public or private research centers.
L’archive ouverte pluridisciplinaire HAL, est destinée au dépôt et à la diffusion de documents scientifiques de niveau recherche, publiés ou non, émanant des établissements d’enseignement et de recherche français ou étrangers, des laboratoires publics ou privés.
hydrometric networks and the identification of
representative catchments
C. L. R. Laize
To cite this version:
C. L. R. Laize. Integration of spatial datasets to support the review of hydrometric networks and the identification of representative catchments. Hydrology and Earth System Sciences Discussions, European Geosciences Union, 2004, 8 (6), pp.1103-1117. �hal-00304985�
Integration of spatial datasets to support the review of
hydrometric networks and the identification of representative
catchments
C.L.R. Laize
Centre for Ecology and Hydrology, Wallingford, Oxfordshire OX10 8BB, UK E-mail: clai@ceh.ac.uk
Abstract
The rapidly growing demand for river flow data has increased pressure on hydrometric monitoring programmes to match a wide range of application-focused information needs, in particular, the identification of representative catchments. This paper investigates a novel methodology based on a Geographical Information System to support cost-effective hydrometric network management and information delivery. Raster datasets are integrated as matrices describing the relationship between variables within any given area. Matrices are then compared to index how representative catchments are of a specified reference area. Using south-east Scotland as the reference area, four applications illustrate the methodologys potential to address a variety of issues (e.g. network rationalisation, selection of impact catchments, identification of new gauging sites). The method is implemented using elevation and land-use datasets.
Keywords: spatial information, Geographical Information System, hydrometry, network management, network rationalisation, representative
catchment, regionalisation
Introduction
The World Meteorological Organization (WMO, 1994) recommends that hydrometric networks should be reviewed periodically to take into account the reduction in hydrological uncertainty brought about by the data added since the last network analysis and any changes related to budget, data uses and users, etc. Consequently, there is an ongoing need for decision support tools for network appraisals to ensure that both operational and strategic information needs are addressed in a cost-effective manner. Whilst there are many approaches to network design e.g. based on statistical analysis of time-series which could be used to review existing networks, this paper focuses on a specific WMO recommendation: networks should include at least one catchment representative of each region where hydrological similarity is presumed (Toebes and Ouryvaev, 1970). Representative catchments are a good approach to regionalisation studies (WMO, 1972). This paper describes and discusses a novel methodology that indexes how representative a gauged catchment is of any particular
reference area whether of a geographical entity (group of hydrometric areas, ecological habitat, etc.) or of a statistical construct identifying catchments with similar characteristics. Reference areas are preferred to strict hydrological regions because, in practice, network management takes place within a complex socio-economic environment that does not comply necessarily with the hydrology (e.g. administrative divisions). The method develops a mechanism based on information derived from the integration of spatial datasets; the utility of the approach is demonstrated in relation to strategic information needs in the UK. The Representative Catchment Index (RCI) method capitalises on the digital spatial datasets available at the Centre for Ecology and Hydrology (CEH), Wallingford; it targets scientific and non-scientific users and is designed to be simple and easily interpreted.
The RCI implemented in this paper integrates elevation and land-use datasets and was tested on the British hydrometric network. The United Kingdom has a dense hydrometric network reflecting the diversity of its geography
which is matched by few countries in the world. Around 1350 gauging stations are currently operational
approximately one per 200 km2 (Marsh and Lees, 2003).
These stations service the information needs of a rapidly expanding community of users of river flow data. However, the expansion of the hydrometric networks has increased pressure on the resources available to sustain the monitoring programmes. Using south-east Scotland as a case study, four applications of the method are described to illustrate its flexibility as a decision support tool addressing a variety of user needs. The first application focuses on reviews of existing local hydrometric networks. The second application uses the same study area but considers it in the context of the wider British gauging station network. The third application partitions the original study area into lowland and upland categories and the final application demonstrates the capability of the method to identify potentially valuable new gauging sites.
Representative Catchment Index:
method of derivation
Procedures for designing representative catchment networks are described in the literature: Australia (WMO, 1972); New Zealand, Brazil, ex-USSR (Toebes and Ouryvaev, 1970); UK (Boorman et al., 1991). They all assume that representative catchments are typical of a given hydrological region in terms of a number of spatial characteristics (e.g. topography, geology, precipitation). For a given characteristic, a broad class is assigned to each area. The combination of the area classes is the basis for comparison between catchments and hydrological regions; a representative catchment has the same combination of classes as the region. These studies pre-date the widespread availability of digital spatial datasets and Geographical Information Systems (GIS) and have some shortcomings: they do not capture the spatial variability within the areas of interest, nor do they allow catchments to be ranked (two catchments with the same classes are considered equally representative).
With the development of GIS, it has become easier to manipulate spatial datasets. Many analytical methodologies, although not focusing on network design or review, demonstrate the value of computational derivation of spatial information from raster datasets; for example, the catchment descriptors used in the Flood Estimation Handbook (Bayliss, 1999) and Low Flows 2000 (implementation of the procedure described by Gustard et al., 1992). A comprehensive review of the Northern Ireland hydrometric network (Black et al., 1994) capitalised on digital spatial information to estimate how representative individual
gauging stations are of Northern Ireland as a whole. The assessment was based on spatial characteristics derived from raster datasets; in particular, breakdowns of the Hydrology Of Soil Types (HOST) (Lilly et al., 1998) and hypsometric curves derived from elevation. In both cases the catchment descriptor underlying the spatial information is a table listing all attribute values and their respective occurrence, allowing for the calculation of their proportion (from which hypsometric curves and breakdowns can be computed) within the selected area. Unlike the previous studies, this approach captures the spatial variability within the catchments. However, the review of the Northern Ireland hydrometric network still analyses each spatial dataset independently before synthesising the results in the final assessment.
The RCI method differs by integrating the spatial datasets at an early stage in the appraisal; areas are described by the relationship between their spatial characteristics. The rationale is that two areas could have, for instance, the same topography and the same land-use breakdowns but a different distribution of land throughout the range of elevations. With the RCI approach, catchments are considered representative of the reference area if they are similar not only in their individual spatial characteristics but also in the relationship of these. Appendix A details the integration of the datasets, the generation of matrices, and the calculation of the RCI. Any area of interest (Fig. A1) is described by matrices in this example, bi-dimensional storing the proportion of any given combination of characteristics within the area (Table A2).
The RCI is calculated from a cell-by-cell comparison of the catchment and reference matrices. As long as a catchment matrix fits within the intervals of the reference matrix, a score can be calculated, even if the catchment is geographically distant from the reference area. The resultant score allows for the ranking of catchments relative to each other.
Representative Catchment Index:
implementation with two datasets
To capture catchment hydrological behaviour fully would require more than two spatial characteristics. However, a two-dataset implementation of the method was investigated since it was expected to be very informative whilst using a minimum number of datasets, given the characteristics of the UK environment. Firstly, elevation and rainfall are well correlated because of the countrys physiography and maritime climate; highland areas are located mainly in the West and most of the rainfall originates from Atlantic frontal systems. Secondly, most of the UK, and Scotland inparticular, lies on impermeable geology; therefore geologically-driven catchment responses are relatively homogenous across most of the country. Lastly, to preserve the simplicity and flexibility of the method, datasets that are self-explanatory and more likely to be available worldwide, for example from maps or remote sensing, were preferred to those that require scientific knowledge or are specific to a methodology. Hence, elevation and land cover were chosen.
The ability to use information from several individual datasets is a very valuable feature of the RCI but it is also designed to retain the capacity to analyse individual datasets; for example, to select catchments within particular elevation thresholds or to generate land-use classifications.
ANALYSIS MASKS
The RCI method requires boundaries of the areas of interest to be used as analysis masks. All operations on spatial datasets are thus constrained to the area within the analysis masks. Catchment boundaries were derived automatically from the CEH Wallingford Integrated Hydrological Digital Terrain Model (IHDTM) (Morris and Flavin, 1990). The regional boundaries of the reference area were digitised from maps.
ELEVATION AND LAND-USE DATASETS
Elevation data are derived from the IHDTM which is based
on a 50 m grid interval (i.e. each cell represents a 50 × 50 m2
square) with 0.1 m vertical resolution. It has been designed to be hydrologically consistent; given a user-supplied catchment outlet location, a grid of flow directions toward the outlet can be generated, from which the catchment boundaries can be calculated. Land-use data are based on a 50 m grid derived from the satellite-generated Land Cover Map 2000 (Fuller et al., 2002) and has 27 land-cover categories (Table B1).
PRE-PROCESSING OF DATASETS
Firstly, the datasets were resampled as 200 m grids to reduce the computational burden (file size and processing time) since testing showed that the loss of information is minor at catchment scale. The IHDTM vertical resolution was also reduced from 0.1 to 1 m.
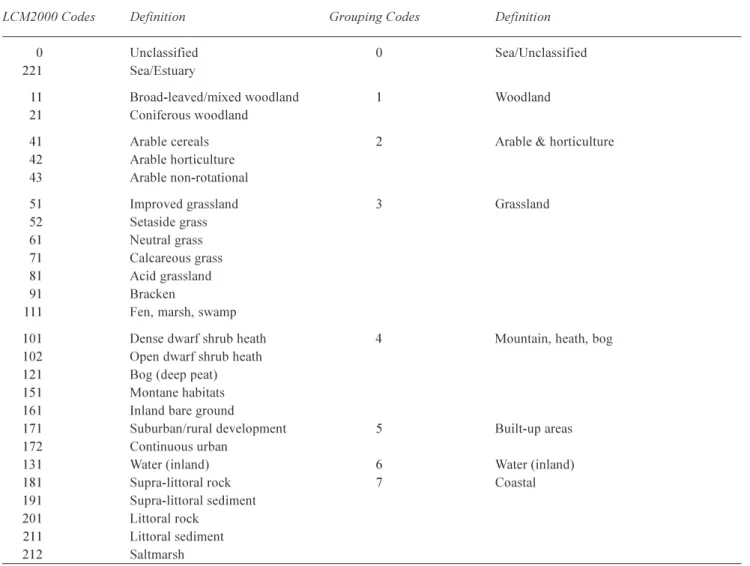
Secondly, datasets were reclassified, with new values assigned to the raster pixels according to user objectives. Reclassification is performed because different studies may focus on different aspects of the data and thus require different settings. The final RCI scores are, therefore, specific to these settings. For example, the original
LCM2000 classification is based on remote sensing (spectral classes) and ecological (broad habitats) considerations. For this study, the 27 land-cover categories have been grouped into eight broader classes (e.g. six distinct categories of grasslands were merged) that have more hydrological significance (Table B1).
Case study: south-east Scotland
To demonstrate the applicability of the method four examples are given, each of which applies to south-east Scotland, used as the reference area. The results are not intended to be used at this stage of the method development to finalise decisions regarding the evolution of the hydrometric network. The aim is to illustrate some of the issues to be addressed in achieving an optimal network design.
For the purposes of this study, south-east Scotland comprises the majority of hydrometric areas 13 to 21; hydrometric areas are groupings of river catchments having outlets to the sea and topographical similarity. The area is
delineated in Fig. 1. The total area is around 17957 km2 and
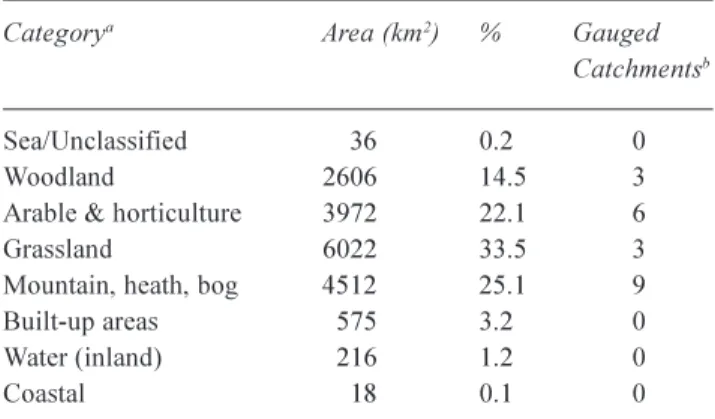
elevation ranges from 0 to 1192 m, although 90% of the area lies between 28 and 669 m; the weighted average elevation is 264 m. Land use is predominantly grassland, mountain and arable (Table 1). In the context of this study, the hydrometric network includes 102 gauging stations. (This study is based on a reduced British network, including 1021 stations selected from the Hydrometric Register and have verified IHDTM-derived boundaries.)
Table 1. Land-use classification for south-east Scotland.
Categorya Area (km2) % Gauged
Catchmentsb Sea/Unclassified 36 0.2 0 Woodland 2606 14.5 3 Arable & horticulture 3972 22.1 6 Grassland 6022 33.5 3 Mountain, heath, bog 4512 25.1 9 Built-up areas 575 3.2 0 Water (inland) 216 1.2 0
Coastal 18 0.1 0
a cf. Appendix B
b Number of gauged catchments including at least 60% of the corresponding
" ) " ) ! ( ! ( " ) !( " ) " ) ! (
X
W
" ) ! ( " ) " ) " ) ! ( ! ( ")") ! ( " ) " ) !( " ) ! (!( " ) ") " ) " ) " ) ! ( ! ( " ) ! ( " ) " ) " ) " ) ! ( " ) ! (") " ) ! ( " ) " ) " ) !( " ) ! ( ! ( " ) " ) " ) ! ( " ) ") " ) ! ( " ) ! (X
W
" ) " ) ! ( " ) " )!( ! ( " ) ! ( " )!( " ) ! ( " ) " ) " ) " )")") " ) " ) " ) ") " )X
W
" ) ! ( ! ( " )!( ! ( " ) " ) ! ( " ) " )X
W
" ) ! ( ! ( " ) ! ( ! ( " )!( " ) !(X
W
" ) ! ( ! ( " ) " )X
W
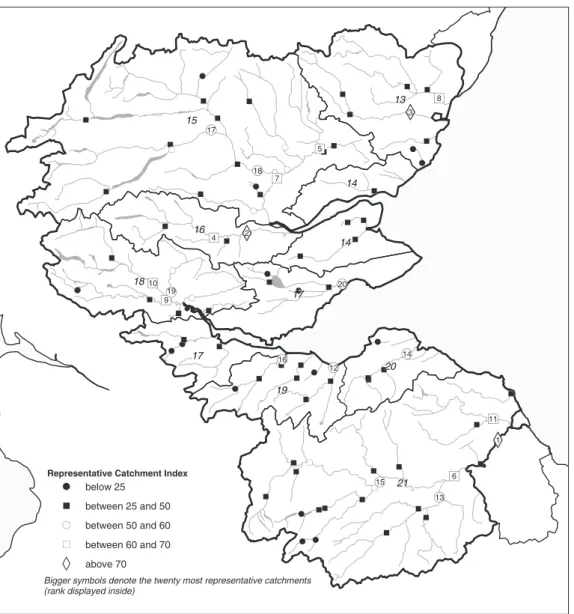
! ( " ) 19 19 20 20 13 13 14 14 14 14 17 17 17 17 16 16 18 18 21 21 15 15 4 3 8 5 7 2 9 6 1 16 17 18 20 10 19 12 14 11 15 13Representative Catchment Index
Bigger symbols denote the twenty most representative catchments (rank displayed inside)
! ( below 25 " ) between 25 and 50 ! ( between 50 and 60 " ) between 60 and 70
X
W
above 70Fig. 1. Location map of south-east Scotland stations with indication of their RCI score; hydrometric areas are delineated by the thin black lines
(identification number displayed in italics); the reference area is represented by the thick black line; rivers and lochs are grey.
APPLICATION 1: LOCAL HYDROMETRIC NETWORK REVIEW
In this scenario, the south-east Scotland network is considered as a discrete entity including only the gauging stations located within the reference area. Figure 1 shows the location and the categorised RCI score for each station. Detailed scores for the most and least representative catchments are given in Table 2. Out of 102 catchments, three scored above 70, eight between 60 and 70, 18 between 50 and 60, 55 between 25 and 50 and 18 below 25.
As expected, larger catchments tend to score higher, because they are sampling a much larger proportion of the reference area (e.g. 21009, 21021, and 15006 each sampling
around 2025% of the 17957 km2); it is, however, a general
tendency from which representativeness cannot be predicted. Catchments 13008 or 15010, for example, are an order of
magnitude smaller than the larger catchments thus sampling only around 23% of the reference area yet their score is at least as high. These catchments could act as compact surrogates for the whole reference area, offering users a cost-effective monitoring option; for example, expensive field surveys can be minimised.
The least representative catchments in Table 2 scored lower not only because they are smaller but also because they differ greatly from the reference area, often due to a single land use. For example, 19010 and 17012 have, respectively, the first and second largest proportion of built-up areas of the local network with 28.7% and 27.4% compared to 3.2% for south-east Scotland as a whole. Moreover, the land use causing low RCI scores is often dominant; e.g. 13017 has the largest proportion of arable lands with 83.7%. Nonetheless, catchments with low RCI
scores may be of high strategic value for the network precisely because they are unrepresentative of the reference area. For example, 21026, 18021 and 18020 have the highest proportion of woodland in the south-east Scotland network with 81.9%, 71.4%, and 68.2% respectively; they are, therefore, important for the understanding of the impact of afforestation on river flow regimes.
APPLICATION 2: EXTENDED SCOPE OF THE CATCHMENT SELECTION
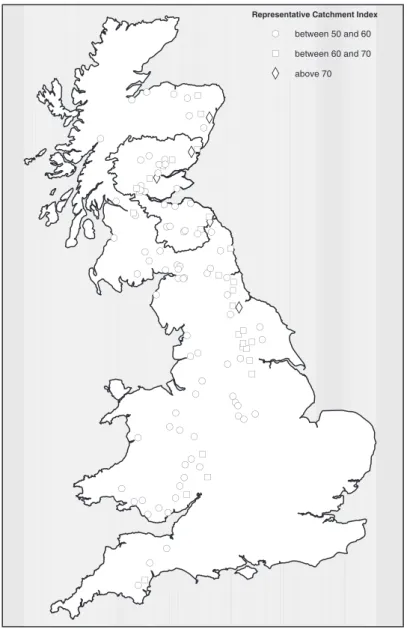
The comparison between catchment and reference areas is based upon their elevationland-use matrices. As long as the catchment matrix fits within the elevation and land-use ranges of the reference area matrix, RCI scores can be derived even if the catchment lies outside the reference area. As datasets are available nationwide in the UK, 1021 gauged catchments of the reduced British network (see above) were tested against south-east Scotland area as defined previously. Out of 1021 catchments, 367 score below 25, 537 between 25 and 50. Figure 2 shows the 117 remaining stations that score more than 50: 83 between 50 and 60, 29 between 60 and 70, and 5 above 70. Table 3 shows details for the 20
most representative catchments. Eight of them are within the reference area, three from another part of Scotland, eight from England and one from Wales. A comparison of the flow-duration curves and base flows of these 20 catchments showed that they have rather similar hydrological behaviour. In this case, two spatial characteristics might be enough to identify catchments representative of south-east Scotland, both within and outside the reference area. This example underlines the contribution that catchments throughout the UK can make to locally or regionally focussed applications. However, for general applications, the relative hydrological consistency between stations has to be confirmed.
APPLICATION 3: REFERENCE AREA DEFINITION REFERRING TO ELEVATION
The most appropriate reference area for a gauging station network appraisal study may not be a simple aggregation of hydrometric areas. Indeed, south-east Scotland encompasses areas with very different characteristics (population density, accessibility, climate, habitat, landscape, etc.); defining the reference area as a lowland or highland region may therefore be more relevant. In this regard, the
Table 2. Selection from the 102 catchments of south-east Scotland showing the 10 most and 10 least representative
of south-east Scotland; in descending order of Representative Catchment Index (RCI).
Station Number Station Name River Catchment Area (km2) R CI
Highest 10
21009 Norham Tweed 4390.0 76.2
16004 Forteviot Bridge Earn 782.2 75.7 13008 Brechin South Esk 488.0 71.1 16001 Kinkell Bridge Earn 590.5 69.9 15010 Wester Cardean Isla 366.5 68.0
21021 Sprouston Tweed 3330.0 67.1
15006 Ballathie Tay 4587.1 65.8
13007 Logie Mill North Esk 732.0 64.6 18011 Craigforth Forth 1036.0 62.6 18003 Bridge of Teith Teith 517.7 62.1 Lowest 10
19020 Whitburn Almond 30.3 15.8
19010 Liberton Braid Burn 16.2 15.6 20002 Luffness West Peffer Burn 26.2 13.6 17016 Whinnyhall Lochty Burn 14.0 13.1 13017 Colliston Colliston Burn 8.4 12.9 17018 Damleys Cottage Greens Burn 10.5 12.0 21026 Deephope Tima Water 31.0 11.8 17012 Castlecary Red Burn 22.0 10.5
18021 Elrig Loch Ard Burn 1.5 1.8
! ( ! ( ! ( ! ( ! ( ! ( " ) ! ( ! ( ! ( !( " ) ! ( ! ( ! (!( ! ( ! ( ! ( ! ( ! ( ! ( ! ( ! ( ! (") ! ( ! ( ! ( ! ( ! ( ! ( ! (!( ! ( ! ( ! ( ! ( ! ( !( !( !(")
X
W
" ) ! ( ! ( !( ! ( " ) ! ( ! ( " ) ! (")") " )")!( ! ( " )")X
W
" ) ! (") " ) ! ( " ) ! (!( " ) ! ( ! ( ! ( ! (") ! ( !( ! (!( ! ( ! (!(!( " ) ! ( ! (X
W
" ) ! ( ! (!( !(!( ") ! ( ! ( ! ( " )!( " )X
W
!( ! (!(")!( ! ( ! ( ")X
W
") ! ( " )Representative Catchment Index
! ( between 50 and 60 " ) between 60 and 70
X
W
above 70Fig. 2. Location and indication of RCI of a Britain-wide selection of stations (1021 catchments) tested against south-east Scotland (black
delineation); only stations with RCI above 50 are featured (117 catchments). Water Framework Directive (WFD, Annex II, 1 Surface
Waters; European Commission, 2000) suggests that water bodies (rivers and lakes) could be classified according to altitude, as lowland (below 200 m), mid-altitude (between 200 and 800 m) and high (above 800 m). Since none of the 1021 catchments is above 800 m, the mid-altitude and high types have been merged. Application 3 examines the existing network in south-east Scotland within the context of these broad altitudinal divisions.
South-east Scotland was divided into two parts: the portion of south-east Scotland above 200 m and that below 200 m (Table 4). It is noteworthy that gauging station density is much lower above 200 m.
In south-east Scotland above 200 m, the RCI selected 73 catchments, with 12 of the 20 most representative being
outside the reference area. These are quite evenly located across the uplands of Britain and have similar hydrological behaviour (Fig. 3). As expected, selected catchments that scored poorly in the context of south-east Scotland as a whole performed much better after elevation filtering (Table 5); the RCI is up to twice as high (three times for some lower scoring catchments not shown here).
Unlike catchments above 200 m, which are generally impermeable, flow regimes in catchments below 200 m reflect a variety of geological characteristics (a mixture of permeable and impermeable rock types); using elevation and land use only is inappropriate in these circumstances. Either the geographical extent should be constrained to areas of relative hydrological homogeneity, or the RCI should incorporate additional characteristics (e.g. geology, climate).
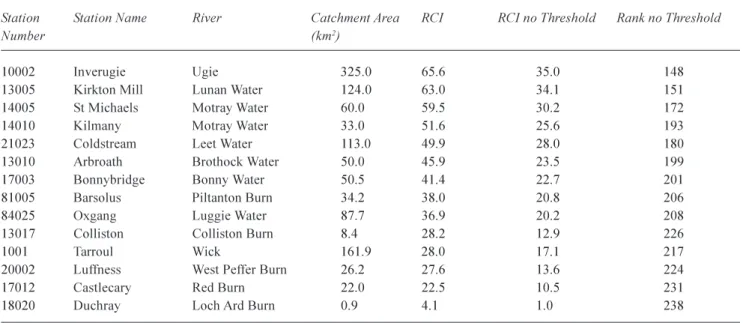
retained out of 1021. Only 14 stations are below 200 m (Fig. 4). Four stations are outside south-east Scotland (including the most representative one, 10001; Table 6).
Application 3 highlights the limitation of using only two datasets to capture the relationship between physical characteristics and hydrological behaviour. However, provided that these reservations are addressed, and given a nationwide and extensive selection of catchments, the method can quickly give a shortlist of stations that are representative of a given reference areas spatial characteristics. In terms of an overall network management strategy, it is extremely valuable to be able to assess stations within a national perspective if data are available as in the UK rather than just locally. Indeed, the strategic value of a gauging station depends both on how well it relates to the region in which it is located and to the country as a whole. This is particularly true if the reference area definition emphasises typology rather than geography (for example, referring to the WFD, small lowland calcareous catchments).
APPLICATION 4: IDENTIFYING NEW POTENTIAL SITES
The previous applications demonstrated the value of the RCI method for assessing the performance of existing gauging
Table 4. RCI method applied to 1021 gauging stations tested
against south-east Scotland above and below 200 m.
SE Scotland SE Scotland below 200 m. above 200 m.
Area (km2) 8096 9861
Number of catchments
Total 311 73
Inside Reference area 10 13 Outside Reference area
Scotland 4 22 England 295 17 Wales 2 21 RCI range 0-25 63 27 25-50 193 29 50-60 45 12 60-70 10 5 Above 70 0 0
Table 3. The 20 catchments most representative of south-east Scotland (from the selection of 1021 NRFA
gauging stations); in descending order of Representative Catchment Index (RCI).
Station Number Station Name River Catchment Area (km2) R CI
21009 Norham Tweed 4390.0 76.2
16004 Forteviot Bridge Earn 782.2 75.7
11001 Parkhill Don 1273.0 72.6
13008 Brechin South Esk 488.0 71.1
25009 Low Moor Tees 1264.0 70.9
16001 Kinkell Bridge Earn 590.5 69.9 24009 Chester le Street Wear 1008.3 68.9 27007 Westwick Lock Ure 914.6 68.8
27009 Skelton Ouse 3315.0 68.4
11002 Haughton Don 787.0 68.2
15010 Wester Cardean Isla 366.5 68.0
22001 Morwick Coquet 569.8 67.2
21021 Sprouston Tweed 3330.0 67.1 27089 Tadcaster Wharfe 818.0 66.7
15006 Ballathie Tay 4587.1 65.8
24001 Sunderland Bridge Wear 657.8 65.6
9002 Muiresk Deveron 954.9 65.1
54032 Saxons Lode Severn 6850.0 65.0
55023 Redbrook Wye 4010.0 64.7
13007 Logie Mill North Esk 732.0 64.6
Here, for lowland applications of the RCI, the selection of gauging stations was limited to Scotland where there are no major outcrops of permeable rock types; 238 stations were
! (!( ! ( " ) ! ( " ) " ) ! ( ! ( !( ! (!(!(!( " )") ! ( ! ( ! (!( !(!( ! ( ! ( ! ( ! ( " ) " )
X
W
")X
W
") " ) " ) ! ( ! ( " ) " )") ! ( " ) " ) ! ( ! ( ! ( " ) ! (!( " ) ! ( ! ( ! (!(!(!(!( " ) " ) " ) ! ( ! ( " )")") " )") " ) " ) " ) " ) ") " ) " ) ! ( " ) " )X
W
")X
W
" ) ")")") " ) " ) " )")") " )7 ") ") 8 9 11 18 12 16 14 17 10 20 13 6 4 1 2Representative Catchment Index
Bigger symbols denote the twenty most representative catchments (rank displayed inside)
! ( below 25 " ) between 25 and 50 ! ( between 50 and 60 " ) between 60 and 70
X
W
above 70elevation below 200 metres elevation above 200 metres
Fig. 3. Location and indication of RCI scores of a British selection of stations (73 catchments) tested against south-east Scotland above 200 m
Table 5. The twenty catchments most representative of south-east Scotland above 200 m in descending order of Representative Catchment
Index (RCI); RCI and rank (out of 1021) from testing without elevation threshold displayed for comparison.
Station Station Name River Catchment RCI Rank RCI no Rank no
Number Area (km2) Threshold Threshold
8010 Grantown Spey 1748.8 68.1 1 44.7 194 8005 Boat of Garten Spey 1267.8 64.6 2 42.5 237 8004 Delnashaugh Avon 542.8 63.5 3 42.2 248 8009 Balnaan Bridge Dulnain 272.2 61.7 4 39.5 309 8002 Kinrara Spey 1011.7 61.6 5 41.4 268 15038 Bridge of Gaur Gaur 247 59.4 6 38.3 330 21018 Lyne Station Lyne Water 175 59.2 7 38.4 329 23002 Eddys Bridge Derwent 118 57.8 8 35.7 377
8011 Minmore Livet 104 57.4 9 35.4 387
13012 Gella Bridge South Esk 130 55.9 10 37.6 339 21020 Gordon Arms Yarrow Water 155 54.8 11 35.7 378 7001 Shenachie Findhorn 415.6 54.4 12 36.2 364 21014 Kingledores Tweed 139 54.1 13 35.6 384 28001 Yorkshire Bridge Derwent 126 53.6 14 34.0 420 21019 Cademuir Manor Water 61.6 52.3 15 32.1 475 15014 Kindrogan Ardle 103 51.0 16 32.2 469 21034 Craig Douglas Yarrow Water 116 50.2 17 32.5 461 57015 Merthyr Tydfil Taff 104.1 49.2 18 33.5 437 89002 Victoria Bridge Linne nam Beathach 50.5 48.8 19 29.9 521 58006 Pontneddfechan Mellte 65.8 48.7 20 30.7 503 " ) " ) " ) " ) " ) " ) ! ( ! (!( " ) " )") ! (
elevation below 200 metres elevation above 200 metres
Representative Catchment Index
! ( below 25 " ) between 25 and 50 ! ( between 50 and 60 " ) between 60 and 70 X W above 70
Fig. 4. Location and indication of RCI of a Scottish-wide selection of stations (14 catchments) tested against south-east Scotland below 200 m
Table 6. The fourteen Scottish catchments suitable for comparison with south-east Scotland below 200 m in descending order of
Representative Catchment Index (RCI); RCI and rank (out of 238) from testing without elevation threshold displayed for comparison.
Station Station Name River Catchment Area RCI RCI no Threshold Rank no Threshold
Number (km2)
10002 Inverugie Ugie 325.0 65.6 35.0 148 13005 Kirkton Mill Lunan Water 124.0 63.0 34.1 151 14005 St Michaels Motray Water 60.0 59.5 30.2 172 14010 Kilmany Motray Water 33.0 51.6 25.6 193 21023 Coldstream Leet Water 113.0 49.9 28.0 180 13010 Arbroath Brothock Water 50.0 45.9 23.5 199 17003 Bonnybridge Bonny Water 50.5 41.4 22.7 201 81005 Barsolus Piltanton Burn 34.2 38.0 20.8 206 84025 Oxgang Luggie Water 87.7 36.9 20.2 208 13017 Colliston Colliston Burn 8.4 28.2 12.9 226
1001 Tarroul Wick 161.9 28.0 17.1 217
20002 Luffness West Peffer Burn 26.2 27.6 13.6 224 17012 Castlecary Red Burn 22.0 22.5 10.5 231 18020 Duchray Loch Ard Burn 0.9 4.1 1.0 238
stations and reviewing the network. In particular, the method can help to identify monitoring deficiencies (e.g. not enough stations sufficiently representative of a given reference area) Application 4 illustrates how the method can improve network utility by supporting the selection of new gauging sites.
It has been shown that the local network of south-east Scotland (102 stations) includes only 13 stations located
above 200 m monitoring 1500 km2 of the reference area
above that threshold (9861 km2). None of these stations has
a catchment area in the 6575 km2 range. In this application,
it is assumed that, on the one hand, an additional station addressing this deficiency would improve the capability to estimate flow conditions in ungauged catchments, on the other hand, to increase cost-effectiveness, it would be valuable if the new station was the most representative of the monitored region. Application 4 focuses on the
identification of potential new catchments of around 70 km2.
Around 4 million catchments with areas greater than 0.5
km2 can be derived from the whole UK IHDTM. They were
shortlisted to retain only sites that comply with the aforementioned specifications. An initial selection of potential monitoring sites was performed, based on the DTM raster and the digital boundary of south-east Scotland. Catchments wholly above 200 m and within the reference area boundary were retained. The selection was then refined according to catchment size; sites with an area between 65
and 75 km2 were kept. Setting a relatively broad area range
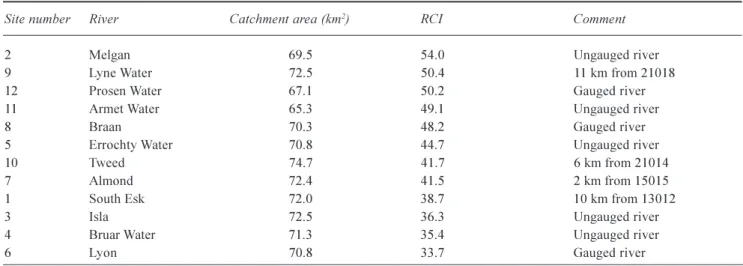
is necessary to shortlist a reasonable number of catchments. The shortlist included 12 ungauged catchments (Fig. 5). The
candidate sites were then tested against the reference area south-east Scotland above 200 m using the RCI method as for the gauged catchments (Table 7).
Finalising the site selection for a new gauging station should rely on synthesising a range of information available on each candidate site. After removing those sites which are close to an existing gauging station on the same stream (Table 7), five candidates remain: 2, 3, 4, 5, and 11. At this stage, the RCI can finalise the choice. Reviewing the RCI and area for the 73 catchments above 200 m from Application 3, the maximum value for catchments with an
area below 100 km2 was around 52. Relative to their
catchment type, the candidate ungauged sites have high RCI scores. Site 2 is the most representative with a RCI of 54.0
and is also the closest to the target area (69.5 km2); 11 and 5
are second and third with RCIs of 49.1 and 44.7, respectively. However, site 3 is an interesting case: it is at approximately the same location as a flood warning level station. If upgrading this station is cheaper than building a new one, site 3 may be an appropriate second or third choice.
Discussion
Analysing spatial characteristics is at the core of representative catchment network design and review. The UK benefits from a wide choice of spatial datasets having a nationwide coverage. Although, in principle, the method could be applied to other countries, some results in this paper depend on the availability of such datasets. Also, the datasets themselves may introduce a bias because of the way they
# # # # ## ## # # # # # ! ( ! ( ! ( ! ( ! ( ! ( ! (!( ! ( ! ( ! ( ! ( 13012 15014 15039 15038 15015 21019 21018 21020 21034 21030 21017 21026 21014 9 8 7 6 5 4 3 2 1 12 11 10
(Elevation shown for south−east Scotland only) !
( ungauged site gauging station elevation below 200 metres elevation above 200 metres #
Table 7. Ungauged sites within south-east Scotland, above 200 m, and ordered by descending RCI score; gauged river denotes the
presence of downstream stations below 200 m; when available, distances are indicative and denote the presence of stations above 200 m.
Site number River Catchment area (km2) RCI Comment
2 Melgan 69.5 54.0 Ungauged river
9 Lyne Water 72.5 50.4 11 km from 21018 12 Prosen Water 67.1 50.2 Gauged river 11 Armet Water 65.3 49.1 Ungauged river
8 Braan 70.3 48.2 Gauged river
5 Errochty Water 70.8 44.7 Ungauged river
10 Tweed 74.7 41.7 6 km from 21014
7 Almond 72.4 41.5 2 km from 15015
1 South Esk 72.0 38.7 10 km from 13012
3 Isla 72.5 36.3 Ungauged river
4 Bruar Water 71.3 35.4 Ungauged river
6 Lyon 70.8 33.7 Gauged river
Fig. 5. Location map of gauged and ungauged catchments fitting the reference area specifications: within south-east Scotland (thick black
have been created (e.g. grid scale, typology). The exploitation of single spatial datasets has proved very valuable in developing many methodologies and remains very helpful for network assessment; for example, in Application 3, it was inferred from the elevation alone that no station from the selection was above 800 m. The RCI explores the greater potential of integrating multiple datasets to address a wide range of applications.
Here, the validity of the approach has been illustrated in this paper with elevation and land cover datasets but any raster dataset could be processed likewise. Providing the computational burden remains manageable, the methodology could be implemented using tri-dimensional matrices, thus integrating three datasets instead of two. Geology would be a useful addition because it could address the shortcoming of the RCI identified with British lowland areas (cf. Application 3); moreover, it is one of the criteria used in the WFD water body typology. Although no hierarchy between elevation and land-use is currently considered within the RCI, extending it to additional datasets might require the introduction of a weighting factor to take into account the relative influence of the characteristics on hydrological response.
Two additional developments could be investigated. First, catchment matrices outside the reference matrixs range of values are currently filtered out to reduce processing time; a tolerance could be introduced to keep in matrices whose significant part is within the range of values (e.g. 90%). Second, consider the following theoretical case: a reference area is 100% Woodland between 100 and 120 m, catchment A is 100% Woodland between 120 and 140 m, and catchment B is 100% Grassland between 100 and 120 m. Given Eqns. (A1) and (A2) in Appendix A , both catchments would score zero. Yet, because elevation is a continuous dataset, it is sensible to say that catchment A is closer to the reference area than catchment B. A weighting mechanism could increase the score of catchments whose matrix patterns are close relative to continuous characteristicsthis would not apply to categorical datasets such as land use.
Catchment size influences the RCI scoringsee Application 1 and 4because larger catchments are more likely to encompass the full elevation range of the reference area than smaller ones. However, should the reference area be a much flatter region (e.g. plain or plateau), then even relatively small catchments might capture the narrower range and thus score well. Size is therefore difficult to internalise in the RCI. Yet it is an important global descriptor, especially in relation to scaling issues, which are not discussed in this paper.
When implementing the RCI method, users have to define the reference area, select the catchments to be tested and set
the dataset reclassification; these choices reflect users objectives (e.g. impact of land use on flow regime) and the information derived from the method (score and ranking of catchments) are, therefore, relative to a particular case. The choice of the reference area and of the candidate catchments is linked directly to the scope and purpose of the study. In this regard, the flexibility of the method has been demonstrated in the series of applications featured. The catchment selection scope ranges from local to national; the reference area can be defined simply (geographical boundary only) or in a more complex way (using elevation filters). Reclassification is also project dependent. The grouping of land-cover categories used in this study was appropriate in hydrological terms but other users might merge classes differently to suit their purpose. For example, a water quality specialist might need to distinguish between deciduous and coniferous woodlands, as they have a different influence on the chemistry of streamwater.
Since the applications were focused on individual stations, the areas compared with south-east Scotland were all catchments. However, these areas could be anything as required by users objectives. For instance, were the focus on network design, estimating the representativeness of individual catchments would be less relevant than estimating that of the total gauged area. Instead of individual catchments, the RCI would be applied on aggregated drainage areas, each of them representing a set of ungauged catchments. Bearing in mind that network design relies on various other approaches (e.g. statistics) and factors (e.g. logistics), the RCI score of the aggregated areas would be an additional element in the selection process.
Conclusions
The RCI facilitates the ordering of stations according to an objective and indicative hierarchy, and to assess the relative utility of gauging stations in relation to a range of applications. By highlighting strengths, weaknesses and deficiencies of the monitoring network, the RCI can be used as a support tool in re-allocating resources and increasing overall network utility. In particular, the RCI can address the need to examine the wider network if data are available nationwide when assessing the strategic value of gauged catchments within a reference area. On the one hand, when users have a huge number of stations to consider as in Applications 1 to 3, the RCI can be used for shortlisting: the hierarchical order highlights the most representative stations, from which users would then check further as many as suitable for their purpose. On the other hand, the RCI can be used to finalise decisions when a shortlist is already available; e.g. in Application 4, the RCI was used to select
the best candidate ungauged site amongst the last five remaining.
Whichever approach is required, the RCI should be used as part of a decision support system which would incorporate global descriptors (e.g. size) and others relating to, for instance, the hydrometric capabilities of the potential sites (degree of artificial influence in the flow pattern, ability to contain all flows, etc.) and the logistics involved in maintaining a sensibly continuous flow record (accessibility, health and safety issues). For example, as part of a strategic review of the UK gauging network, the National River Flow Archive (NRFA) is selecting benchmark and impact gauged catchments, which aim at identifying hydrological trends and artificial influences, respectively (Bradford and Marsh, 2003). A provisional selection of benchmark catchments around 120 has been based on hydrometric information (e.g. absence of artificial influences, sound data quality, good length and continuity of record). Spatial information derived from the RCI method will be used to refine and finalise the selection of benchmark catchments and, crucially, to aid the interpretation of any emerging changes in runoff patterns. By contrast, the designation of impact catchments relies much more directly on spatial characteristics (in particular, land use); thus, in this case, the RCI would have more weight in the decision procedure.
Acknowledgements
The funding for this study was provided through the Natural Environment Research Council and through ongoing support for the National River Flow Archive by the Department of the Environment, Food and Rural Affairs (DEFRA). Martin Lees and Terry Marsh provided guidance and support. This paper benefited from helpful discussion with colleagues. Some of the features in the maps are based on Ordnance Survey data, Crown Copyright, GD03012G.
References
Bayliss, A., 1999. Flood Estimation Handbook Volume 5
Catchment descriptors. Institute of Hydrology, Wallingford, UK.
Black, A.R., Lees, M.L., Marsh, T.J. and Dixon, J.M., 1994. A
review of the Northern Ireland hydrometric network. Report to
the Department of the Environment (NI). Institute of Hydrology, Wallingford, UK.
Boorman, D.B., Clayton, M., Gannon, B. and Houghton-Carr, H., 1991. Representative basin catalogue for Great Britain. Institute of Hydrology, Wallingford, UK.
Bradford, R.B. and Marsh, T.J., 2003. Defining a network of benchmark catchments for the UK. Proc. Inst. Civil Eng.- Water
Mar., 156, 109216.
European Commission, 2000. Directive 2000/60/EC, Establishing a framework for Community action in the field of water policy.
Official Journal of the European Communities L327, 172.
Fuller, R.M., Smith, G.M., Sanderson, J.M., Hill, R.A. and Thomson, A.G. 2002. The UK Land Cover Map 2000: construction of a parcel-based vector map from satellite images.
Cartogr. J., 39, 1525.
Gustard, A., Bullock, A. and Dixon, J.M., 1992. Low Flow
Estimation in the United Kingdom. Report No. 108, Institute of
Hydrology, Wallingford, UK.
Lilly, A., Boorman, D.B. and Hollis, J.M., 1998. The development of a hydrological classification of UK soils and the inherent scale changes. Nutr. Cycl. Agroecosyst., 50, 299302. Marsh, T.J. and Lees, M.L. (Eds.), 2003. Hydrometric Register
and Statistics 1996-2000. Centre for Ecology and Hydrology,
Wallingford, UK.
Morris, D.G. and Flavin, R.W., 1990. A Digital Terrain Model
For Hydrology, In: Proc. 4th International Symposium on Spatial
Data Handling, K. Brassel, K. and H.J.Kishimoto, (Eds.),
23-27 July, University of Zurich, Switzerland, 1, 250262. Toebes, C. and Ouryvaev, V., (Eds.), 1970. Representative and
experimental basins. Studies and reports in hydrology 4, Unesco,
Paris, France.
World Meteorological Organization, 1972. Casebook on
hydrological network design practice. WMO-No. 324.
World Meteorological Organization, 1994. Guide to hydrological
practices. Fifth edition, WMO-No. 168.
Appendix A
This example is based on simplified generated datasets for the purpose of illustration. Given two theoretical raster datasets (R1 and R2), the RCI is applied to synthetic catchment and reference area (Fig. A1).
Integration of the spatial datasets
EXTRACTION AND RESAMPLING
The boundaries of the area of interest are used as an analysis mask, i.e. all operations are constrained to the points located
within this area. For each location within the mask, the R1 value and the related R2 value are extracted (Table A1).
Matrix generation and reclassification
Bi-dimensional matrices with R1 as the abscissa and R2 as the ordinate are generated for the areas of interest. Each time a given combination of R1 and R2 occurs, the corresponding matrix cell is incremented by 1 (at this stage, the total of all matrix cell values is equal to the total number of pixels within the mask); for instance the combination
Raster 1 Raster 2 1 1 1 1 1 1 2 2 10 10 10 10 12 12 13 13 1 1 1 1 1 2 2 2 10 10 10 10 11 12 12 13 1 1 1 1 2 2 2 2 10 10 10 11 11 12 12 13 1 1 1 1 2 2 2 2 10 10 11 11 11 11 13 14 1 3 3 3 4 2 2 3 10 11 11 11 12 13 13 14 3 1 3 3 4 4 2 4 11 11 11 12 12 13 14 14 3 1 1 3 3 3 4 4 10 11 12 12 12 13 14 14 3 3 3 3 3 3 3 3 11 11 12 12 12 12 14 15
Fig. A1. Theoretical rasters R1 and R2; the reference area is represented by the square (64 pixels); the catchment is delineated by the broken
black line and the figures are in bold (47 pixels).
Table A2. Matrices of the reference area and of the catchment
showing the proportion of any combination of R1 (abcissa) and R2 (ordinate) attribute values within an area.
Reference Catchment 1 2 3 4 1 2 3 4 10 14/64 0 1/64 0 11/47 0 0 0 11 6/64 3/64 7/64 0 4/47 3/47 1/47 0 12 3/64 4/64 7/64 2/64 3/47 4/47 3/47 2/47 13 0 7/64 1/64 1/64 0 7/47 0 1/47 14 0 2/64 2/64 3/64 0 2/47 2/47 3/47 15 0 0 1/64 0 0 0 1/47 0
Table A1. Intermediate processing output (sample; first line of
rasters); each row relates to a single pixel in the area of interest; the origin of the coordinates is the top-left corner of each raster (1,1). X Y R 1 R 2 1 1 1 10 2 1 1 10 3 1 1 10 4 1 1 10 5 1 1 12 6 1 1 12 7 1 2 13 8 1 2 13
(1,10) occurs 14 times in the reference area,11 times in the catchment (Table A2). Then the matrix is normalised; each matrix cell content is divided by the total number of pixels in the raster within the mask (64 for the reference area, 47 for the catchment). Hence, the matrix contains the proportion of any given (R1, R2) combination relative to the area (total of cells equals 1).
Calculation of the Representative
Catchment Index
On a cell-by-cell basis, the program sums the absolute value of the difference between reference and catchment matrices as expressed in the equation below:
D = Si,j(
C
Vi,j(catchment) Vi,j (reference)C
) (A1)where Vi,j (M) is the value of cell (i,j) in matrix M.
As the matrices are normalised, a difference of n points in one cell means a difference of n points in another cell (or a total difference of n points in several other cells), i.e. a
total difference of 2 × n points. The value of D ranges from 0 (identical matrices) to 2 (completely different matrices). For convenience, the final score is expressed as a percentage:
RCI = (1 0.5 × D) × 100 (A2)
The RCI score ranges from 0 to 100 representing how well both matrices match: if both matrices are completely different, the catchment scores 0 (D = 2), if they are identical, it scores 100 (D = 0).
From Eqns. (A1) and (A2), the theoretical catchment RCI is 82.6.
Appendix B
Table B1. Original LCM2000 land-use categories and groups used in this project.
LCM2000 Codes Definition Grouping Codes Definition
0 Unclassified 0 Sea/Unclassified 221 Sea/Estuary
11 Broad-leaved/mixed woodland 1 Woodland 21 Coniferous woodland
41 Arable cereals 2 Arable & horticulture 42 Arable horticulture
43 Arable non-rotational
51 Improved grassland 3 Grassland 52 Setaside grass
61 Neutral grass 71 Calcareous grass 81 Acid grassland 91 Bracken
111 Fen, marsh, swamp
101 Dense dwarf shrub heath 4 Mountain, heath, bog 102 Open dwarf shrub heath
121 Bog (deep peat) 151 Montane habitats 161 Inland bare ground
171 Suburban/rural development 5 Built-up areas 172 Continuous urban
131 Water (inland) 6 Water (inland) 181 Supra-littoral rock 7 Coastal 191 Supra-littoral sediment
201 Littoral rock 211 Littoral sediment 212 Saltmarsh