HAL Id: hal-02476537
https://hal.archives-ouvertes.fr/hal-02476537
Submitted on 12 Feb 2020HAL is a multi-disciplinary open access
archive for the deposit and dissemination of sci-entific research documents, whether they are pub-lished or not. The documents may come from teaching and research institutions in France or abroad, or from public or private research centers.
L’archive ouverte pluridisciplinaire HAL, est destinée au dépôt et à la diffusion de documents scientifiques de niveau recherche, publiés ou non, émanant des établissements d’enseignement et de recherche français ou étrangers, des laboratoires publics ou privés.
structural style? Distinctive stress magnitudes during
Sevier thin-skinned and Laramide thick-skinned
layer-parallel shortening in the Bighorn Basin (USA)
revealed by stylolite and calcite twinning
paleopiezometry
Nicolas Beaudoin, Olivier Lacombe, Marie-eléonore David, Daniel Koehn
To cite this version:
Nicolas Beaudoin, Olivier Lacombe, Marie-eléonore David, Daniel Koehn. Does stress transmission in forelands depend on structural style? Distinctive stress magnitudes during Sevier thin-skinned and Laramide thick-skinned layer-parallel shortening in the Bighorn Basin (USA) revealed by stylolite and calcite twinning paleopiezometry. Terra Nova, Wiley-Blackwell, In press, �10.1111/ter.12451�. �hal-02476537�
Does stress transmission in forelands depend on structural
1
style ? Distinctive stress magnitudes during Sevier
thin-2
skinned and Laramide thick-skinned layer-parallel shortening
3
in the Bighorn Basin (USA) revealed by stylolite and calcite
4
twinning paleopiezometry.
5 6
Nicolas Beaudoin1, Olivier Lacombe2, Marie-Eléonore David2, Daniel Koehn3. 7
1 Université de Pau et des Pays de l'Adour, E2S UPPA, CNRS, TOTAL, LFCR, Pau, France
8
2 Sorbonne Université, CNRS-INSU, Institut des Sciences de la Terre de Paris, ISTeP UMR
9
7193, F-75005 Paris, France
10
3 GeoZentrum Nordbayern, University Erlangen-Nuremberg, Schlossgarten 5, 91054,
11 Erlangen, Germany 12 13 ABSTRACT 14
The Sheep Mountain – Little Sheep Mountain Anticlines, Bighorn Basin (USA) formed as
15
basement-cored Laramide structures in the formerly undeformed foreland of the thin-skinned
16
Sevier orogen. We take advantage of the well constrained microstructural network there to
17
reconstruct differential stress magnitudes that prevailed during both Sevier and Laramide
18
Layer-Parallel Shortening (LPS), before the onset of large-scale folding. Differential stress
19
magnitudes determined from tectonic stylolites are compared and combined to previous stress
20
estimates from calcite twinning paleopiezometry in the same formations. During stress loading
21
related to LPS, differential stress magnitudes transmitted from the distant Sevier thin-skinned
22
orogen into the sedimentary cover of the Bighorn basin (11-43 MPa) are higher than the
23
differential stress magnitudes accompanying the early stage of LPS related to the thick-skinned
Laramide deformation (2-19 MPa). This study illustrates that the tectonic style of an orogen
25
affects the transmission of early orogenicstress into the stable continental interior.
26
27
INTRODUCTION 28
Providing quantitative estimates of the evolution of past stress magnitudes over time is a
29
challenging task, albeit important to understand the long-term mechanical and
30
paleohydrological behaviour of the upper crust. While strain mostly distribute at plate
31
boundaries, there is a significant intraplate stress transmission thousands of kilometers away
32
from the source of the stress that leads to the development of mesostructures such as fractures
33
or stylolites before and/or beyond macrostructures such as folds and thrusts (Lacombe and
34
Mouthereau, 1999; Tavani et al., 2015; Weil and Yonkee, 2012). The use of calcite twinning
35
paleopiezometry documented an overall cratonward decrease in orogenic stress, with a drop of
36
differential stress (σd = σ1-σ3) values in the first hundred kilometers from the orogen 37
hinterland/foreland boundary (>100 MPa to 20 MPa; Beaudoin and Lacombe, 2018). The
38
reason of this stress transmission pattern, and its dependence on the orogenic tectonic style are
39
still debated (Van der Pluijm et al., 1997; Lacombe, 2010). In order to tackle this issue, we
40
combined existing stress data from calcite twinning paleopiezometry (Amrouch et al., 2010)
41
with original σd values obtained from stylolite roughness paleopiezometry (Ebner et al., 2010b; 42
Schmittbuhl et al., 2004) from the sedimentary cover of the Sheep Mountain-Little Sheep
43
Mountain anticlines (Bighorn Basin, Wyoming, USA; Fig. 1) where the network of systematic
44
veins/mesoscale faults and paleostress reconstructions document two stages of layer-parallel
45
shortening (LPS), related to thin-skinned (i.e., basement remaining undeformed) then to
thick-46
skinned (i.e., involving the basement) tectonics.
47 48
GEOLOGICAL SETTING 49
The Bighorn Basin belongs to the thick-skinned Laramide Province of the Rocky
50
Mountains (Fig. 1C) that formed by latest Cretaceous until Paleogene times in response to the
51
flat-slab subduction of the Farallon plate (Yonkee and Weil, 2015). Micro/meso-structural
52
studies combined with absolute dating of vein cements (Amrouch et al., 2010; Beaudoin et al.,
53
2012; Beaudoin et al., 2014; Beaudoin et al., 2018; Bellahsen et al., 2006a; Craddock and van
54
der Pluijm, 1999; Neely and Erslev, 2009; Varga, 1993; Weil and Yonkee, 2012; Yonkee and
55
Weil, 2010) show that the sedimentary strata of the Bighorn Basin recorded (1) pre-Laramide
56
LPS, related to compressive stress likely transmitted from the distant thin-skinned Sevier
57
orogen at the time the basin was still part of the Sevier undeformed foreland (vein set S, 1
58
striking WNW-ESE prior to folding, 81-72 Ma, Fig. 2A); (2) Laramide LPS (vein set L-1, 1
59
striking NE-SW prior to folding, 72-50 Ma, Fig. 2A); (3) Laramide thrust-related,
basement-60
cored folding with veins developed at fold hinges (vein Set L-2, 50-35 Ma, Fig. 2A). Field
61
observations also document the occurrence of bed perpendicular tectonic stylolites with peaks
62
oriented (1) ~WNW-ESE and (2) NE-SW after unfolding (Fig. 2B, 2C, Amrouch et al., 2010;
63
2011). The orientations of the stylolite peaks, commonly considered as reliable markers of the
64
orientation of the tectonic stress (eg, Koehn et al., 2007; Tavani et al., 2015; Weil and Yonkee,
65
2012), together with their kinematic compatibility and chronological relationships with the
66
veins of set S and L-1, respectively (Fig. 2C), and with the conjugate reverse and strike-slip
67
mesoscale faults that also developed during Laramide LPS (Amrouch et al., 2011; Amrouch et
68
al., 2010) unambiguously support that these tectonic stylolites witness the successive horizontal
69
compressive stress related to the Sevier and Laramide events, respectively.
70 71
STYLOLITE ROUGHNESS INVERSION FOR STRESS 72
Stylolites are serrated surfaces (Fig. 2B) that develop by chemical dissolution under
73
stress (Alvarez et al., 1978; Fletcher and Pollard, 1981; Koehn et al., 2007; Toussaint et al.,
2018). The growth and the morphology of a stylolite are rate-dependent (e.g., Stockdale, 1922);
75
they are governed by the kinetics of dissolution and the distribution of heterogeneities, and are
76
affected by the amount of clay enhancing the dissolution (Renard et al., 2001). Once dissolution
77
starts, there is a thermodynamic competition between (1) a destabilizing (roughening) force due
78
to pinning particles on the stylolite surface that resist dissolution, and (2) stabilizing
79
(smoothening) forces, long-range elastic forces and local surface tension that tend to flatten the
80
stylolite surface by preferentially dissolving areas of local roughness (Schmittbuhl et al., 2004).
81
While the topography of the stylolite during its growth is sensitive to both strain rate and stress
82
(Koehn et al., 2012), the final topography of a stylolite is a saturation state that is reached over
83
a short period of time, ca. 200 years (Schmittbuhl et al., 2004) at the end of dissolution due to
84
local drop in solubility (Rolland et al., 2012). Hence the final roughness, i.e. the difference in
85
height between two points along the stylolite plane, reflects the ambient stress at the time
86
pressure-dissolution stopped, and is dependent on neither strain rate nor lithology (Ebner et al.,
87
2009).
88
The stress inversion technique relies upon a fractal analysis of high-resolution 2D scans
89
(12800 dpi) of the final roughness on the stylolite surface. In most cases, the 1D topography of
90
a stylolite is best described by a self-affine scaling invariance (Schmittbuhl et al., 2004), i.e. the
91
rough shape is invariant under a range of scales. A classic way to determine the self-affinity of
92
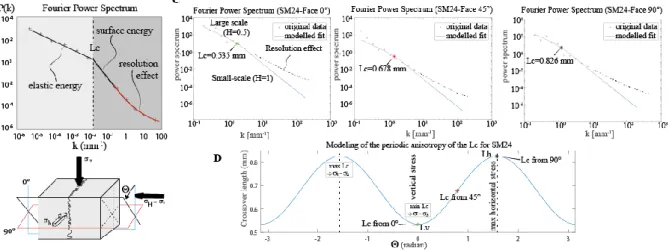
a signal is to analyze it with a Fourier power spectrum, that relates the wave number k (mm-1) 93
to the squared Fourier transform modulus P(k) as 𝑃(𝑘) ∝ 𝑘2𝐻+1, where H is the roughness (or
94
Hurst) exponent (Barabási and Stanley, 1995). In the case of stylolites, such analysis typically
95
exhibits 2 power laws (Fig. 3A): a large-scale (usually > 1mm) law with a specific roughness
96
exponent of 1.1 which reflects the elastic energy dominated regime; and a small-scale law with
97
a specific roughness exponent of 0.5 which reflects the surface energy dominated regime. A
98
third part of the data forms a flat tail at the lowest scales that reflects a resolution effect related
to image treatment (Fig. 3A). The scale of observation at which the self-affine invariance
100
switches from one power law to the other one, defined as the crossover length Lc, is directly 101
linked to the absolute magnitude of the mean and differential stresses (σm and σd, respectively) 102
that prevailed at the end of the life of a stylolite as 𝐿𝑐 = 𝛾𝐸
𝛽𝜎𝑚𝜎𝑑, with E the Young’s modulus 103
(Pa), γ the solid-fluid interfacial energy (J.m-2), and β a dimensionless constant β= ν(1-2ν)/π 104
with ν being the Poisson’s ratio (Schmittbuhl et al., 2004).
105
The evolution of the topography and related Lc on tectonic stylolite surfaces exhibits a 106
periodic anisotropy of the Lc (Ebner et al., 2010b) that can be reconstructed from a minimum 107
of three cuts normal to the surface if one knows the mechanical/chemical parameters of the
108
dissolved rock (Fig. 3B; Beaudoin et al., 2016). If the reconstructed anisotropy returns minima
109
and maxima aligned with the vertical and horizontal directions (Fig. 3D), then it provides access
110
to the horizontal crossover length Lh and to the vertical crossover length Lv, which yield the 111
magnitudes of the horizontal maximum (H) and minimum (h) stresses as 𝐿ℎ
𝐿𝑣 = 𝜎𝐻−𝜎𝑣 𝜎𝐻−𝜎ℎ,
112
provided the vertical stress v (i.e., the weight of overburden) is known (Ebner et al., 2010b). 113
114
SAMPLING STRATEGY AND RESULTS 115
Because stylolite occurrence depends on lithology (Marshak and Engelder, 1985) and
116
to limit the variability of rock type and mechanical properties of samples, Sevier and
Laramide-117
related tectonic stylolites were collected at different structural locations solely in the partly
118
dolomitized, grainstone facies of the Mississippian Madison Formation and of the Permian
119
Phosphoria Formation (Barbier et al., 2012; Fig. 1A).
120
Three peak-parallel cuts were done for each stylolite with an angle between each cut
121
(Table 1), and each roughness signal was inverted using the Fourier power spectrum
122
(Fig.3C)(Ebner et al., 2010a; Renard, 2004). The Lc anisotropy was reconstructed from the three 123
values of Lc (Fig.3D) (Beaudoin et al., 2016). Successful inversion comprises 13 tectonic 124
stylolites (Table 1, Figs. S1, S2, S3) sampled in the Madison Formation (n=10) and in the
125
Phosphoria Formation (n=3).
126
To determine σd values, we considered a range of depths of deformation obtained by 127
comparing published basin models (Beaudoin et al., 2014b; May et al., 2013) with the range of
128
absolute U-Pb ages of the systematic veins S and L-1 related to Sevier and Laramide LPS
129
(Beaudoin et al., 2018). This reveals that the Madison Formation was buried at depths of
1500-130
2450 m and 2450-2800m at the time of Sevier and Laramide LPS, respectively (and we consider
131
an average of 300 m less for the Phosphoria Fm.). We also use Poisson ratio and Young modulus
132
obtained from mechanical tests on the Phosphoria and Madison Formations from Sheep
133
Mountain (Amrouch et al., 2011, Table 1) and the classic solid-fluid interfacial energy value
134
for dolomite (0.24 J.m-2, Wright et al., 2001). The Lc is estimated assuming a linear-by-parts fit 135
of the Fourier spectra modelled by a least square algorithm (Ebner et al., 2009). Such analytical
136
solution returns the Lc within a 23% uncertainty (Rolland et al., 2014), that can be considered 137
as the maximum methodological uncertainty as other parameters are known. Note that an extra
138
source of uncertainties can be found in the modelling of the periodic anisotropy from 3 cuts
139
(Beaudoin et al., 2016).
140
Laramide-related σd values (n=8) range from 2±0.5 MPa to 19±4.4 MPa (n=7) while 141
Sevier-related σd values (n=5) range from 11±2.2 MPa to 24±4.8 MPa (n=6). 142
143
DISCUSSION AND CONCLUSIONS 144
σd estimates from inversion of the roughness of tectonic stylolites were compared with 145
published σd estimates from calcite twinning paleopiezometry in the same formations (Fig. 4) 146
(Amrouch et al., 2010). We discarded the published σd values from calcite twinning 147
paleopiezometry interpreted as reflecting local stress perturbations at the tip of the upward
propagating Laramide thrust (Amrouch et al., 2010; Bellahsen et al., 2006b) rather than the
149
regional stress field of interest.
150
To account for the fact σd values inferred from tectonic stylolites are systematically
151
lower than those inferred from calcite twinning when considering each deformation event (i.e.
152
Sevier or Laramide)(Fig.4), we propose that stylolite development mostly predates vein
153
formation and calcite twinning strain in a stress build-up model. This sequence could be the
154
reason why the local stress perturbation above the tip of the basement fault is not recorded by
155
the tectonic stylolites.We propose that during stress build-up in the flat-lying strata,
pressure-156
solution initiated with low σd along planar solubility heterogeneities in rocks (such as elongated 157
pores) and halted rapidly, presumably by clogging around the dissolution planes (Toussaint et
158
al., 2018). Stylolites would have therefore dissipated the earliest part of the stress build-up
159
before saturating. Then, because increasing stress would not have been accommodated fully by
160
pressure-solution, stress would have accumulated enough to trigger vein development and
161
calcite twinning, until newly-formed mesoscale faulting ultimately took place if the required σd 162
was reached.
163
Integration of both paleopiezometers highlights that most σd values related to Sevier 164
LPS (11±2.2 to 43±9 MPa) are notably higher than σd values (2±0.5 to 19±4 MPa) related to 165
Laramide LPS. The results document for the first time a systematic difference in σd magnitudes 166
sustained by flat-lying strata at the same place in relation to the evolving deformation style over
167
time. The σd values derived from both paleopiezometers reflect the σd prevailing at the burial 168
depth at which the strata underwent LPS. Because the depth of deformation of strata was larger
169
during the Laramide LPS than during the Sevier LPS (∆depth~ 650m on average, Table 1) and 170
since σd increases with depth (Lacombe, 2007; Beaudoin and Lacombe, 2018), the 171
normalization to a similar depth simply increases the difference between σd values associated 172
with the Sevier and the Laramide LPS, thus confirming that this difference in σd values reflects 173
a significant trend.
174
We propose that the stress recorded in the Bighorn Basin was first efficiently transmitted
175
from the distant Sevier thin-skinned orogen into the stable foreland through a shallow stress
176
guide, i.e., the sedimentary cover (Fig. 4), reaching values compatible with the σd values derived 177
from calcite twins for the Sevier foreland elsewhere (20-40 MPa, van der Pluijm et al., 1997).
178
We further propose that the low Laramide σd reconstructed in the cover rocks represents only a 179
fraction of the source stress transmitted forelandward through a deep (crustal or lithospheric)
180
stress guide (Fig. 4) (Erslev, 1993). We speculate that most of the stress was dissipated at depth
181
while triggering the inversion of inherited basement normal faults (Lacombe and Bellahsen,
182
2016; Marshak et al., 2000). and so as it was transmitted upward into the attached cover during
183
the early stage of Laramide LPS, ~20 Ma after the onset of exhumation of Laramide basement
184
arches (Beaudoin et al., 2019), the Laramide LPS-related σd remained much lower compared to 185
former Sevier σd values. It was only at the time of later generalized Laramide large-scale 186
basement-cored folding that σd strongly increased to reach their maximum values in the cover 187
rocks (Amrouch et al., 2011).
188
This study therefore illustrates that the tectonic style of an orogen affects the magnitude
189
of the σd transmitted toward the stable continental interior and therefore challenges previous 190
models of cratonward decrease of σd regardless of the structural style of the orogen. Beyond 191
regional implications, this study further establishes tectonic stylolite roughness inversion as a
192
reliable and powerful paleopiezometer to constrain stress build-up in poorly deformed strata of
193
stable orogenic forelands, which places it as a useful complement of calcite twinning
194 paleopiezometry. 195 196 ACKNOWLEDGMENTS 197
This work was funded by Sorbonne Université (research agreement C14313) and by the
198
European Union Seventh Framework Programme for research, technological development and
199
demonstration (grant agreement n°316889). NB is funded through the ISITE program E2S,
200
supported by ANR PIA and Région Nouvelle-Aquitaine. Authors thank Stephen Marshak,
201
Adolf Yonkee, Atilla Aydin and two anonymous reviewers for their constructive comments that
202
greatly improved the manuscript, as well as the science editor Jean Braun.
203
REFERENCES 204
Alvarez, W., Engelder, T., and Geiser, P. A., 1978. Classification of solution cleavage in pelagic
205
limestones: Geology, v. 6, no. 5, p. 263-266.
206
Amrouch, K., Beaudoin, N., Lacombe, O., Bellahsen, N., and Daniel, J.-M., 2011. Paleostress
207
magnitudes in folded sedimentary rocks: Geophysical Research Letters, v. 38, no. 17,
208
L17301.
209
Amrouch, K., Lacombe, O., Bellahsen, N., Daniel, J.-M., and Callot, J.-P., 2010. Stress and
210
strain patterns, kinematics and deformation mechanisms in a basement-cored anticline:
211
Sheep Mountain Anticline, Wyoming: Tectonics, v. 29, no. 1, TC1005.
212
Barabási, A. and Stanley, H. 1995. In: Fractal Concepts in Surface Growth, Barabási, A. and
213
Stanley, H. (eds), Cambridge University Press, Cambridge, 366 pp.
214
Barbier, M., Hamon, Y., Callot, J.-P., Floquet, M., Daniel, J.-M., 2012. Sedimentary and
215
diagenetic controls on the multiscale fracturing pattern of a carbonate reservoir: The
216
Madison Formation (Sheep Mountain, Wyoming, USA). Marine and Petroleum
217
Geology 29, 50-67.
218
Beaudoin, N., Bellahsen, N., Lacombe, O., Emmanuel, L., and Pironon, J., 2014a. Crustal-scale
219
fluid flow during the tectonic evolution of the Bighorn Basin (Wyoming, USA): Basin
220
Research, v. 26, no. 3, p. 403-435.
221
Beaudoin, N., Koehn, D., Lacombe, O., Lecouty, A., Billi, A., Aharonov, E., and Parlangeau,
222
C., 2016. Fingerprinting stress: Stylolite and calcite twinning paleopiezometry revealing
223
the complexity of progressive stress patterns during folding-The case of the Monte Nero
224
anticline in the Apennines, Italy: Tectonics, v. 35, no. 7, p. 1687-1712.
225
Beaudoin, N., and Lacombe, O., 2018. Recent and future trends in paleopiezometry in the
226
diagenetic domain: Insights into the tectonic paleostress and burial depth history of
fold-227
and-thrust belts and sedimentary basins: Journal of Structural Geology, v. 114, p.
357-228
365.
229
Beaudoin, N., Lacombe, O., Bellahsen, N., Amrouch, K., and Daniel, J.-M., 2014b. Evolution
230
of pore-fluid pressure during folding and basin contraction in overpressured reservoirs:
231
Insights from the Madison–Phosphoria carbonate formations in the Bighorn Basin
232
(Wyoming, USA): Marine and Petroleum Geology, v. 55, p. 214-229.
233
Beaudoin, N., Lacombe, O., Roberts, N. M. W., and Koehn, D., 2018. U-Pb dating of calcite
234
veins reveals complex stress evolution and thrust sequence in the Bighorn Basin,
235
Wyoming, USA: Geology, v. 46, no. 11, p. 1015-1018.
236
Beaudoin, N., Lacombe, O., Roberts, N. M. W., and Koehn, D., 2019. U-Pb dating of calcite
237
veins reveals complex stress evolution and thrust sequence in the Bighorn Basin,
238
Wyoming, USA: REPLY: Geology,e481, https://doi.org/10.1130/G46606Y.1.
Beaudoin, N., Leprêtre, R., Bellahsen, N., Lacombe, O., Amrouch, K., Callot, J.-P., Emmanuel,
240
L., and Daniel, J.-M., 2012. Structural and microstructural evolution of the Rattlesnake
241
Mountain Anticline (Wyoming, USA): New insights into the Sevier and Laramide
242
orogenic stress build-up in the Bighorn Basin: Tectonophysics, v. 576-577, p. 20-45.
243
Bellahsen, N., Fiore, P., and Pollard, D. D., 2006a. The role of fractures in the structural
244
interpretation of Sheep Mountain Anticline, Wyoming: Journal of Structural Geology,
245
v. 28, no. 5, p. 850-867.
246
Bellahsen, N., Fiore, P. E., and Pollard, D. D., 2006b. From spatial variation of fracture patterns
247
to fold kinematics: A geomechanical approach: Geophysical Research Letters, v. 33,
248
no. 2.
249
Craddock, J. P., and van der Pluijm, B. A., 1999. Sevier–Laramide deformation of the
250
continental interior from calcite twinning analysis, west-central North America:
251
Tectonophysics, v. 305, p. 275-286.
252
Ebner, M., Koehn, D., Toussaint, R., Renard, F., and Schmittbuhl, J., 2009. Stress sensitivity
253
of stylolite morphology: Earth and Planetary Science Letters, v. 277, no. 3-4, p.
394-254
398.
255
Ebner, M., Piazolo, S., Renard, F., and Koehn, D., 2010a. Stylolite interfaces and surrounding
256
matrix material: Nature and role of heterogeneities in roughness and microstructural
257
development: Journal of Structural Geology, v. 32, no. 8, p. 1070-1084.
258
Ebner, M., Toussaint, R., Schmittbuhl, J., Koehn, D., and Bons, P., 2010b. Anisotropic scaling
259
of tectonic stylolites: A fossilized signature of the stress field?: Journal of Geophysical
260
Research, v. 115, no. B6, p. B06403.
261
Erslev, E. A., 1993. Thrusts, back-thrusts, and detachment of Rocky Mountain foreland arches:
262
Geological Society of America Special Paper, v. 280, p. 339-358.
263
Fletcher, R. C., and Pollard, D. D., 1981. Anticrack model for pressure solution surfaces:
264
Geology, v. 9, p. 419-424.
265
Koehn, D., Ebner, M., Renard, F., Toussaint, R., and Passchier, C. W., 2012. Modelling of
266
stylolite geometries and stress scaling: Earth and Planetary Science Letters, v. 341-344,
267
p. 104-113.
268
Koehn, D., Renard, F., Toussaint, R., and Passchier, C., 2007. Growth of stylolite teeth patterns
269
depending on normal stress and finite compaction: Earth and Planetary Science Letters,
270
v. 257, no. 3-4, p. 582-595.
271
Lacombe, O., 2007. Comparison of paleostress magnitudes from calcite twins with
272
contemporary stress magnitudes and frictional sliding criteria in the continental crust:
273
Mechanical implications: Journal of Structural Geology, v. 29, no. 1, p. 86-99.
274
Lacombe, O., 2010. Calcite Twins, a Tool for Tectonic Studies in Thrust Belts and Stable
275
Orogenic Forelands: Oil & Gas Science and Technology – Revue d’IFP Energies
276
nouvelles, v. 65, no. 6, p. 809-838.
277
Lacombe, O., and Bellahsen, N., 2016. Thick-skinned tectonics and basement-involved fold–
278
thrust belts: insights from selected Cenozoic orogens: Geological Magazine, v. 153, no.
279
5-6, p. 763-810.
280
Lacombe, O. and Mouthereau, F., 1999. What is the real front of orogens ? The Pyrenean
281
orogen as a case study. C. R. Acad. Sc., t. 329, II, 889-896
282
Marshak, S., and Engelder, T., 1985. Development of cleavage in limestones of a fold-thrust
283
belt in eastern New York: Journal of Structural Geology, v. 7, no. 3-4, p. 345-359.
284
Marshak, S., Karlstrom, K., and Timmons, J. M., 2000. Inversion of Proterozoic extensional
285
faults: An explanation for the pattern of Laramide and Ancestral Rockies intracratonic
286
deformation, United States: Geology, v. 28, no. 8, p. 735-738.
287
May, S. R., Gray, G. G., Summa, L. L., Stewart, N. R., Gehrels, G. E., and Pecha, M. E., 2013.
288
Detrital zircon geochronology from the Bighorn Basin, Wyoming, USA: Implications
for tectonostratigraphic evolution and paleogeography: Geological Society of America
290
Bulletin, v. 125, no. 9-10, p. 1403-1422.
291
Neely, T. G., and Erslev, E. A., 2009. The interplay of fold mechanisms and basement
292
weaknesses at the transition between Laramide basement-involved arches, north-central
293
Wyoming, USA: Journal of Structural Geology, v. 31, no. 9, p. 1012-1027.
294
Renard, F., 2004. Three-dimensional roughness of stylolites in limestones: Journal of
295
Geophysical Research, v. 109, no. B3, p. B03209.
296
Renard, F., Dysthe, D., Feder, J., Bjørlykke, K., and Jamtveit, B., 2001. Enhanced pressure
297
solution creep rates induced by clay particles: Experimental evidence in salt aggregates:
298
Geophysical Research Letters, v. 28, no. 7, p. 1295-1298.
299
Rolland, A., Toussaint, R., Baud, P., Conil, N., and Landrein, P., 2014. Morphological analysis
300
of stylolites for paleostress estimation in limestones: International Journal of Rock
301
Mechanics and Mining Sciences, v. 67, p. 212-225.
302
Rolland, A., Toussaint, R., Baud, P., Schmittbuhl, J., Conil, N., Koehn, D., Renard, F., and
303
Gratier, J.-P., 2012. Modeling the growth of stylolites in sedimentary rocks: Journal of
304
Geophysical Research: Solid Earth, v. 117, no. B6, p. B06403.
305
Schmittbuhl, J., Renard, F., Gratier, J. P., and Toussaint, R., 2004. Roughness of stylolites:
306
implications of 3D high resolution topography measurements: Phys Rev Lett, v. 93, no.
307
23, p. 238501.
308
Stockdale, P. B., 1922. Stylolites: their nature and origin-PhD: Indiana University, 97 p.
309
Tavani,. S., Storti, S., Lacombe, O., Corradetti, A., Muñoz, J. A., and Mazzoli, S., 2015. A
310
review of deformation pattern templates in foreland basin systems and fold-and-thrust
311
belts: Implications for the state of stress in frontal regions of thrust wedges.
Earth-312
Sciences Reviews, 141, 82-104.
313
Toussaint, R., Aharonov, E., Koehn, D., Gratier, J. P., Ebner, M., Baud, P., Rolland, A., and
314
Renard, F., 2018. Stylolites: A review: Journal of Structural Geology, v. 114, p.
163-315
195.
316
van der Pluijm, B. A., Craddock, J. P., Graham, B. R., and Harris, J. H., 1997. Paleostress in
317
Cratonic North America: Implications for Deformation of Continental Interiors:
318
Science, v. 277, p. 794-796.
319
Varga, R. J., 1993. Rocky Mountain foreland uplifts: Products of a rotating stress field or strain
320
partitioning?: Geology, v. 21, no. 12, p. 1115-1119.
321
Weil, A. B., and Yonkee, W. A., 2012. Layer-parallel shortening across the Sevier fold-thrust
322
belt and Laramide foreland of Wyoming: spatial and temporal evolution of a complex
323
geodynamic system: Earth and Planetary Science Letters, v. 357-358, p. 405-420.
324
Wright, K., Cygan, R.T., Slater, B., 2001. Structure of the (1014) surfaces of calcite, dolomite
325
and magnesite under wet and dry conditions. Physical Chemistry Chemical Physics 3,
326
839-844.
327
Yonkee, W. A., and Weil, A. B., 2015. Tectonic evolution of the Sevier and Laramide belts
328
within the North American Cordillera orogenic system: Earth-Science Reviews, v. 150,
329
p. 531-593.
330
Yonkee, W. A. and Weil, A. B., 2010. Reconstructing the kinematic evolution of curved
331
mountain belts: Internal strain patterns in the Wyoming salient, Sevier thrust belt, USA:
332
Geological Society of America Bulletin, v. 122(1-2), p.24-49.
333 334
FIGURE: 335
336
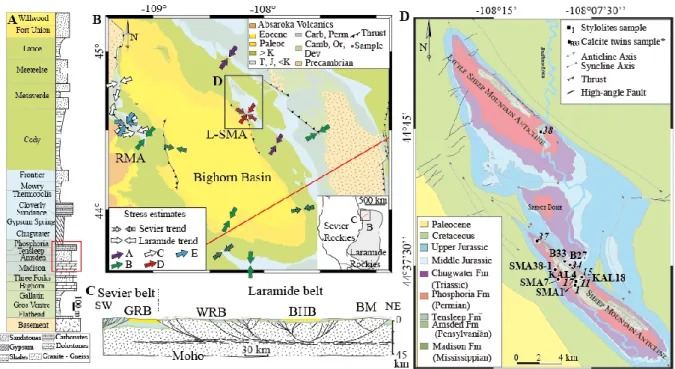
Figure 1: A- Stratigraphic column of the Bighorn Basin, modified after Neely and Erslev
337
(2009). Red frames correspond to the studied formations, colors are related to the age of the
338
formations following the key presented in B. B- Geological map of the Bighorn Basin
339
(Wyoming, USA), the insert shows the location of the area with regard to simplified tectonic
340
provinces, it also shows the location of the map B as a black frame and of the cross-section C
341
as a red line. The reconstructed orientations of the horizontal maximum principal stress are
342
reported as plain arrows for the Laramide event, and as crossed arrows for the Sevier event.
343
Orientations are from: A: Varga (1993), B: Craddock and Van der Pluijm (1999), C: Neely and
344
Erslev (2009), D: Amrouch et al. (2010), E: Beaudoin et al. (2012). C - cross section modified
345
after Marshak et al. (2000). D- Simplified geological maps of the Little Sheep Mountain –
346
Sheep Mountain anticline. Location of sampling sites for tectonic stylolite paleopiezometry and
347
for calcite twinning paleopiezometry are reported as numbered squares and labelled circles,
348
respectively (* from Amrouch et al., 2010).
350
Figure 2: A- Schematic diagrams reporting the compressional trend, mode I veins (sets S, L-1,
351
L-2), and stylolites developed during the Sevier LPS (1), the Laramide LPS (2), and the
352
Laramide folding (3). The pre-existing structures are reported in black, the developing ones in
353
red. For the sake of clarity, we omitted the Triassic-Paleogene overlying strata. P: Precambrian
354
basement, C: Cambrian, O: Ordovician, D: Devonian, Ca-P: Carboniferous and Permian. B-
355
sketch of microstructural observations proposing a possible sequence between tectonic
356
stylolites with peaks oriented (1) WNW-ESE and (2) NE-SW and between veins oriented (3)
357
NE-SW and (4) NW-SE, based on observed abutment and reopening relationships and
358
supported by the general Sevier-Laramide sequence of deformation. C- On the right-hand side,
359
microphotograph of the thin section on which sequence B was built. On the left-hand side, field
360
photographs of tectonic and bedding parallel stylolites in the Madison Formation at Sheep
361
Mountain Anticline.
363
Figure 3: A – Ideal example of Fourier power spectrum applied to 1D profile of stylolite
364
roughness, showing the different expected power laws and where the crossover length sits. B –
365
Sketch of the cuttings through a tectonic stylolite in order to access the stylolite-plane
366
anisotropy (after Beaudoin et al., 2016). C – Example of treatment for 3 cuts on the sample
367
SM24, crossover lengths Lc are reported as coloured crosses within 23% uncertainty. D- 368
Reconstructed periodic anisotropy of the Lc for the Sample SM24, using the Lc and angles 369
presented in C. Similar dataset are presented for all samples as Figs. S1-S2-S3.
370
371
Figure 4: Location of samples (according to their longitude in decimal degrees) vs differential
372
stress magnitudes (σ₁-σ₃, MPa) obtained from inversion of tectonic stylolite roughness
373
(squares) and calcite twinning (circles). Green data points represent the Laramide-related σd, 374
and the blue data points represent the Sevier-related σd. Error bars on squares account for the 375
overall uncertainty for each method. Double arrows and dashed lines represent the range of σd 376
exclusive to Laramide layer-parallel shortening (green) and to Sevier layer-parallel shortening
377
(blue), considering uncertainties. Insert is a conceptual model of stress transmission through
378
shallow and deep stress guides that accounts for the difference in σd magnitudes sustained by 379
sedimentary cover rocks during thin-skinned Sevier and thick-skinned Laramide LPS.
380
Compressive stress related to Sevier (1) and Laramide (2) layer-parallel shortening is reported
381
as blue and green convergent arrows, respectively, with larger size reflecting qualitatively
382
higher σd. LPS – Layer Parallel Shortening 383
384
Name GPS Longitude Latitude Formation Bedding Lv Lh σ1 σ2 σ3
0 0.968 1500 nan 35 nan 50 0.504 2450 62 58 38 0,17 90 0.163 0 0.643 1500 52 44 35 0,47 90 0.471 2450 69 63 58 0,55 140 0.287 0 0.394 2450 67 62 58 0,56 15 0.368 2800 74 70 66 0,5 90 0.619 0 0.231 2450 78 73 58 0,25 90 0.666 2800 84 80 66 0,22 75 0.535 0 0.401 1500 48 42 35 0,46 60 0.649 2450 67 63 58 0,44 90 0.829 0 0.725 1500 52 49 35 0,18 45 0.294 2450 70 67 58 0,25 90 1.025 0 0.424 1500 52 49 35 0,18 90 0.59 2450 70 67 58 0,25 125 0.537 0 0.397 1250 50 40 29 0,48 60 0.591 2250 67 60 53 0,5 90 0.726 0 0.3 2450 73 66 58 0,47 90 0.493 2800 79 74 66 0,38 120 0.515 0 1.996 2450 60 59 58 0,5 45 2.451 2800 68 67 66 0,5 90 4 0 0.535 2300 66 57 54 0,75 45 0.678 2600 72 65 61 0,64 90 0.826 0 0.902 2300 60 57 54 0,5 51 1.448 2600 66 63 61 0,6 90 1.826 0 1.294 2450 61 58 53 0,38 55 0.735 2800 67 66 61 0,17 90 0.458 1
: orientation after correction from local bedding attitude; *Crossover length Lc given within 23% of uncertainty; **Range of depth consiedered based on burial model (see text for details)
Vertical principal stress is reported in bold, horizontal principal stresses are calculated considering for the Phosphoria (E=41 Gpa, ν=0.25, µ=0.24 J/m²) and for the Madison (E=29 Gpa, ν=0.2;µ=0.24 J/m²)
SM-S18 11 -108.13253 44.615 Madison N040 0.22 0.52 14 4.36 Madison 0.15 0.74 N045 Madison N110 0.38 0.84 horizontal 068-16S 120-64N 120-64N 125-36W 145-47E 113-17S Madison 1.294 0.458 Phosphoria Madison 0.42 N045 N113 N045 0.37 0.78 Phosphoria 0.902 1.826 Madison 0.27 1,56 N140 0.59 0.535 0.826 N045 Madison 1.62 Madison 0.36 0.64 Madison 0.968 0.163 Madison 0.28 0.57 horizontal horizontal horizontal Teeth Orientation1 Anisotropy of Lc* Depth ** (m) Little Sheep Mountain Anticline
Average Differential Stress (MPa) Lc from FPS *
(mm)
Angle of cut (°) Main principal stress magnitude (MPa) Sample name and location
SM-S24 SM-S22-2 SM-S32 SM-S22-1 LSM-S6 SM-S22-3 SM-S31 38 38 38 1 17 34 SM-S10 15 37 15 15 37 38 LSM-S11 LSM-S13 LSM-S16 SM-S1 5,5 14,5 -108.19825 -108.13253 -108.13253 -108.19825 -108.13253 -108.19008 -108.19008 44.741 44.741 44.741 -108.14711 -108.14007 -108.13924 -108.19008 44.741 44.606 44.611 44.622 -108.19008 44.615 44.649 44.615 120-76S 125-36W 125-59E Stress Ratio TABLE 1 Location of samples and results of inversion of tectonic stylolite roughness for stress in the Little Sheep Mountain – Sheep Mountain anticlines, USA.
44.615 44.649 Phosphoria 24 8,5 14 19 11 N130 N120 N042 N105 N045 7 17,5 Sheep Mountain Anticline
2
11,5 14,5
Table 1: Location of samples and results of inversion of tectonic stylolite roughness for stress in the Little Sheep Mountain – Sheep Mountain
385
anticlines, USA.
386
387
Figure S1: Results of stylolite roughness inversion, per sample in the Little Sheep Mountain anticline. A- Crossover lengths Lc are reported as 388
crosses within 23% uncertainty for the three cuts, B- Reconstructed periodic anisotropy for the corresponding samples, red squares are Lc, dotted
389
line represents the vertical plane with respect to the orientation of the stylolite before strata tilting.
390
391
Figure S2: Results of stylolite roughness inversion, per sample in the Sheep Mountain anticline. Crossover lengths Lc are reported as crosses within 392
23% uncertainty for the three cuts, B- Reconstructed periodic anisotropy for the corresponding samples, red squares are Lc, dotted line represents 393
the vertical plane with respect to orientation of the stylolite before strata tilting.
394
395
Figure S3: Results of stylolite roughness inversion, per sample in the Sheep Mountain anticline. Reconstructed periodic anisotropy for the
396
corresponding samples presented on Figure S2, red squares are Lc, dotted line represents the vertical plane with respect to orientation of the stylolite 397
before strata tilting.