HAL Id: hal-00301687
https://hal.archives-ouvertes.fr/hal-00301687
Submitted on 10 Aug 2005HAL is a multi-disciplinary open access
archive for the deposit and dissemination of sci-entific research documents, whether they are pub-lished or not. The documents may come from teaching and research institutions in France or abroad, or from public or private research centers.
L’archive ouverte pluridisciplinaire HAL, est destinée au dépôt et à la diffusion de documents scientifiques de niveau recherche, publiés ou non, émanant des établissements d’enseignement et de recherche français ou étrangers, des laboratoires publics ou privés.
Seasonal and diurnal characteristics of water soluble
inorganic compounds in the gas and aerosol phase in the
Zurich area
R. Fisseha, J. Dommen, L. Gutzwiller, E. Weingartner, M. Gysel, C.
Emmenegger, M. Kalberer, Urs Baltensperger
To cite this version:
R. Fisseha, J. Dommen, L. Gutzwiller, E. Weingartner, M. Gysel, et al.. Seasonal and diurnal char-acteristics of water soluble inorganic compounds in the gas and aerosol phase in the Zurich area. Atmospheric Chemistry and Physics Discussions, European Geosciences Union, 2005, 5 (4), pp.5809-5839. �hal-00301687�
ACPD
5, 5809–5839, 2005 Water soluble inorganic compounds in the Zurich area R. Fisseha et al. Title Page Abstract Introduction Conclusions References Tables Figures J I J I Back CloseFull Screen / Esc
Print Version Interactive Discussion
EGU
Atmos. Chem. Phys. Discuss., 5, 5809–5839, 2005 www.atmos-chem-phys.org/acpd/5/5809/
SRef-ID: 1680-7375/acpd/2005-5-5809 European Geosciences Union
Atmospheric Chemistry and Physics Discussions
Seasonal and diurnal characteristics of
water soluble inorganic compounds in the
gas and aerosol phase in the Zurich area
R. Fisseha1, J. Dommen1, L. Gutzwiller2, E. Weingartner1, M. Gysel1,3, C. Emmenegger4, M. Kalberer4, and U. Baltensperger3
1
Paul Scherrer Institut (PSI), 5232 Villigen, Switzerland 2
Bundesamt f ¨ur Energie BFE, 3003 Bern, Switzerland 3
School of Earth, Atmospheric and Environmental Sciences, The University of Manchester, P.O. Box 88, Manchester M60 1QD, UK
4
Laboratory of Organic Chemistry, ETH H ¨onggerberg, 8093 Zurich, Switzerland Received: 2 May 2005 – Accepted: 27 June 2005 – Published: 10 August 2005 Correspondence to: U. Baltensperger (urs.baltensperger@psi.ch)
ACPD
5, 5809–5839, 2005 Water soluble inorganic compounds in the Zurich area R. Fisseha et al. Title Page Abstract Introduction Conclusions References Tables Figures J I J I Back CloseFull Screen / Esc
Print Version Interactive Discussion
EGU Abstract
Gas and aerosol samples were taken using a wet effluent diffusion denuder/aerosol collector (WEDD/AC) coupled to ion chromatography (IC) in the city of Zurich, Switzer-land from August to September 2002 and in March 2003. Major water soluble inorganic ions; nitrate, sulfate, and nitrite were analyzed online with a time resolution of two hours
5
for the gas and aerosol phase. The fraction of water soluble inorganic anions in PM10 varied from 15% in August to about 38% in March. Seasonal and diurnal variations of nitrate in the gas and aerosol phase were observed with more than 50% of the total ni-trate in the gas phase during August and more than 80% of nini-trate in the aerosol phase during March exceeding the concentration of sulfate by a factor of 2. Aerosol sulfate,
10
on the other hand, did not show significant variability with season. However, in the gas phase, the SO2 concentration was 6.5 times higher in winter than in summer. Nitrous acid (HONO) also showed a diurnal variation in both the gas and aerosol phase with the lowest concentration (0.2–0.6 µg/m3) in the afternoon. The primary pollutants, NO, CO and SO2mixing ratios were often at their highest between 04:00–10:00 local time
15
due to the build up of fresh vehicle emission under a nocturnal inversion.
1. Introduction
Air pollutants can cause adverse health effects (Gilli et al., 1988; Maynard, 2004; Pyne, 2002), loss of visibility through light scattering (Lee and Sequeira, 2002) and have the potential to cause other environmental damages (Morales et al., 1998). The effects
20
of atmospheric aerosols depend on their size and chemical composition (Seinfeld and Pandis, 1998). Water soluble components comprise most of the aerosol fraction (Har-rison et al., 2004; Querol et al., 2004). The two major inorganic water soluble com-pounds which play a key role in aerosol properties are sulfate and nitrate.
Non-sea salt sulfate is often the most dominant secondary inorganic aerosol
com-25
ACPD
5, 5809–5839, 2005 Water soluble inorganic compounds in the Zurich area R. Fisseha et al. Title Page Abstract Introduction Conclusions References Tables Figures J I J I Back CloseFull Screen / Esc
Print Version Interactive Discussion
EGU
(SO2) either in the gas phase or in water droplets (Finlayson-Pitts and Pitts, 2000). Most of the SO2 emissions globally result from fossil fuel burning. For this reason, most of the aerosol produced from the oxidation of SO2 is considered to be anthro-pogenic (Seinfeld and Pandis, 1998). In an increasing number of cases, nitrate is the most abundant component in fine particles (Magliano et al., 1999; Schaap et al., 2004).
5
Nitrate may exist in the accumulation mode (mainly as ammonium nitrate), but may also exist in coarse particles due to deposition of nitric acid (HNO3) on alkaline mineral or salt particles (Bassett and Seinfeld, 1984; Murphy and Thomson, 1997; Gard et al., 1998; Henning et al., 2003).
Sulfur and nitrogen containing aerosols are of interest to atmospheric studies due to
10
their influence on radiative transfer and cloud formation, and hence on global climate (Charlson et al., 1992). Several authors reported the radiative and cloud formation effect of sulfate aerosol. However, until recently nitrate has not been considered in assessments of the radiative effects of aerosols. Van Dorland et al. (1997) suggested that radiative forcing due to ammonium nitrate is about one tenth of the sulfate
forc-15
ing. However, the importance of aerosol nitrate could increase substantially over the next century. Observations and model results show that in regions of elevated NOx and NH3 emissions, such as Europe, and parts of North America, NH4NO3 aerosol concentrations may be quite high and actually exceed those of sulfate (Schaap et al., 2002; Christoforou et al., 2000; Wieprecht et al., 2004).
20
The composition of PM10 across Europe has been subject of a number of studies (Putaud et al., 2004; Turnbull et al., 2000; Querol et al., 2001; Pakkanen et al., 2001). In Switzerland, water soluble particulate inorganic compounds represent more than one-quarter of the average annual fine mass at both urban and rural sites (Hueglin et al., 2005). At urban sites in Switzerland, nitrate and sulfate account for ∼14% and
25
15%, respectively, of the annual-average fine particle mass (PM10). However, there is still a gap in measurements of gas phase precursors of these aerosol particulates, particularly nitric acid.
ACPD
5, 5809–5839, 2005 Water soluble inorganic compounds in the Zurich area R. Fisseha et al. Title Page Abstract Introduction Conclusions References Tables Figures J I J I Back CloseFull Screen / Esc
Print Version Interactive Discussion
EGU
Zurich in summer 2002 and winter 2003. The study involves on-line quasi-continuous chemical characterization of particulate and gas-phase inorganic anions using a wet effluent diffusion denuder/aerosol collector (WEDD/AC) coupled to an ion chromato-graph. This method is particularly of interest to nitrate measurements as it minimizes the artifact compared to filter sampling which often has artifacts due to vaporization
5
(Schaap et al., 2004). In addition, the high time resolution of the online measurement helps to understand the diurnal variations of the gas and aerosol phase of the com-pounds which can be used for modeling.
2. Experimental
2.1. Sampling site
10
The city of Zurich is located in the north-eastern part of Switzerland. In 2003, Zurich city had a population of about 340 000 and covered a total area of about 88 km2. The sampling was made at the Kaserne, an open space of ∼1000 m2which is situated in the city center very close to the main train station (Zurich HB). The site is also used as air monitoring station by the Swiss national air pollution monitoring network (NABEL)
15
and characterized as urban background site (Putaud et al., 2004; Hueglin et al., 2005). The sampling for this study was performed in a measuring van, located close to the NABEL station. Both the measuring van as well as the NABEL station were operated by the Swiss Federal Laboratories for Materials Testing and Research (EMPA). Two sampling campaigns were made, the first one from 8 August to 30 September, 2002
20
and the second from 3 to 30 March, 2003. 2.2. Methods
Sampling for chemical analysis was performed with a wet effluent diffusion de-nuder/aerosol collector (WEDD/AC) which contains a flattened glass tube denuder with a dimension of 350 mm × 3 mm × 30 mm (L × H × W) and an aerosol mixing chamber
ACPD
5, 5809–5839, 2005 Water soluble inorganic compounds in the Zurich area R. Fisseha et al. Title Page Abstract Introduction Conclusions References Tables Figures J I J I Back CloseFull Screen / Esc
Print Version Interactive Discussion
EGU
as described in Simon and Dasgupta (1993) and Zellweger et al. (1999). The inner surface of the denuder was coated with sodium silicate (Na2Si4O3) and continuously wetted with ultra pure water (18 MΩ·cm, Millipore Milli-Q) at a flow rate of 1.5 ml/min using an Ismatec peristaltic pump in counter flow to the air. At the end of the denuder, the effluent was pumped to a trace concentrator column.
5
The particle collection system is based on the growth of particles under supersat-urated conditions. In a mixing chamber (volume 250 ml) heated water vapor (100◦C, flow rate 0.6 ml/min) was mixed with the air stream. The air is pumped further to a maze impactor, which is cooled down to 2◦C. The water vapor condenses on aerosol particles and grows to droplets, which impact on the maze. The particle containing
liq-10
uid was collected and concentrated on a trace concentrator column before analysis by ion chromatography (IC). A more detailed description is found in Simon and Dasgupta (1995). Air samples were taken at a flow rate of 4 l/min through the WEDD/AC for 1 h, and the resulting effluents from both the denuder and aerosol collector were analyzed alternately using a Dionex ion chromatography system summarized in Table 1.
Alter-15
nating analysis of the denuder and the particle collection system results in an overall temporal resolution of 2 h.
For the total carbon content, aerosol samples were collected on quartz fibre filters (150 mm diameter, Schleicher & Schuell) with a high-volume sampler and a PM10 inlet at a flow rate of 0.5 m3/min. Filters were sub-sampled by cutting out circles with a
20
diameter of 14 mm. An automated C/N analyzer (EA-1108, Carlo Erba) was used for the determination of total carbon (TC).
Aerosol size distributions were determined with a scanning mobility particle sizer (SMPS) (TSI Model 3071A) from 3 to 30 of March. The SMPS determined the size and number of the aerosols for mobility diameters between 14 and 740 nm. The time
25
resolution of the SMPS analysis was approximately 5 min, from which 1-h averages were calculated. In addition, meteorological parameters, ozone, NO, NO2, CO, SO2 and PM10 were routinely determined at this station throughout the year. Data were provided by EMPA. Table 2 shows the methods and instruments used for the
measure-ACPD
5, 5809–5839, 2005 Water soluble inorganic compounds in the Zurich area R. Fisseha et al. Title Page Abstract Introduction Conclusions References Tables Figures J I J I Back CloseFull Screen / Esc
Print Version Interactive Discussion
EGU
ments of the above mentioned gaseous species and PM10. 2.3. Experimental uncertainties
The limits of detection for all the inorganic anions determined by IC were in the range 0.2–3.5 ng, which corresponds to air concentrations of about 1–20 ng/m3 for a sam-pling time of 1 h. In general, the concentrations of the ions determined by IC were
5
sufficiently above the limit of detection. In some cases, when the concentrations of HNO3 was small (<0.2 µg/m3) the co-elution of the nitrate peak with carbonate made the quantification difficult. In these cases, the concentration of the HNO3and aerosol nitrate could be overestimated by about 50%.
3. Results and discussion
10
SO2 values from the WEDD/AC were compared to the NABEL data obtained by UV florescence at the same site (Fig. 1). In general the two methods showed good agree-ment (r2=0.71), however, the UV florescence data seem to be overestimated by about 30%.
3.1. PM composition
15
A complete mass closure of PM10 in Switzerland is given by Hueglin et al. (2005). Figure 2 shows the chemical composition of PM10 measured at Zurich Kaserne in this study over the three months sampling period. In this plot TC (total carbon) refers to the sum of organic and elemental carbon. Sulfate was assumed to be present as am-monium sulfate, and particulate nitrate as amam-monium nitrate. Chloride was assumed
20
to be in the form of sodium chloride, and the mass of organic carbon was converted to a mass of organic compounds using a factor of 1.4 for urban background based on Harrison et al. (2003). It is expected that this conversion factor experiences a seasonal dependence caused by changes in the relative contributions of primary and secondary
ACPD
5, 5809–5839, 2005 Water soluble inorganic compounds in the Zurich area R. Fisseha et al. Title Page Abstract Introduction Conclusions References Tables Figures J I J I Back CloseFull Screen / Esc
Print Version Interactive Discussion
EGU
organic compounds. Due to the absence of data to support the use of a seasonally varying ratio, a constant factor throughout the year was assumed. The designation “unknown” applies to the difference between mass concentration determined by the beta gauge and the sum of the species concentrations identified by chemical analysis. Silicates and calcium containing mineral dust, trace elements and water are among the
5
materials not measured by the methods used in this study.
The composition of PM10 varied considerably from season to season. Carbona-ceous aerosols represented the highest fraction (33% in August, 45% in September and 22% in March) except for March where the nitrate contribution was slightly higher. The seasonal average fraction of water soluble inorganic compounds varied from about
10
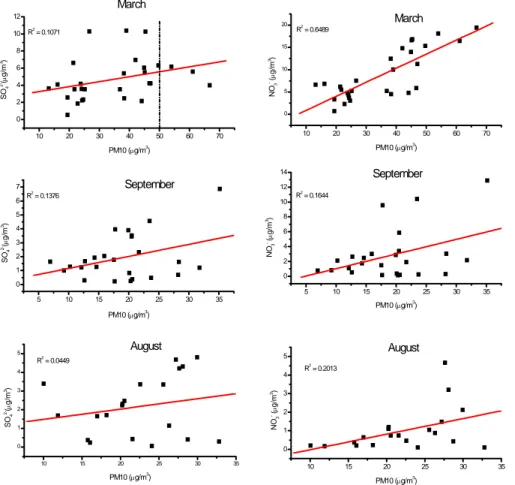
15% in August to about 38% in March, with intermediate fractions in September. The percentage of nitrate in PM10 increased from summer to winter, showing a correlation with PM10 in March (Fig. 3). A similar observation was also reported by Querol et al. (2001). On the other hand, sulfate did not show a significant change in the contri-bution to the total PM10. The maximum contricontri-bution of sulfate was observed during
15
March (13%) and the minimum in August (10%), and no correlation with PM10 is seen (Fig. 3).
The current Swiss limit value for airborne particulate matter comprises both an annual mean concentration (20 µg/m3) and a daily concentration of 50 µg/m3 which should not be exceeded more than once per year. This daily concentration limit was
20
not exceeded during August and September. However, in March the concentration of PM10 was above the limit for at least three days (Fig. 3). In March, PM10 accumu-lation was associated with a lower height of the mixing layer, higher emissions due to room heating, and a higher particulate nitrate formation due to lower temperature as discussed below.
ACPD
5, 5809–5839, 2005 Water soluble inorganic compounds in the Zurich area R. Fisseha et al. Title Page Abstract Introduction Conclusions References Tables Figures J I J I Back CloseFull Screen / Esc
Print Version Interactive Discussion
EGU
3.2. HNO3and aerosol nitrate 3.2.1. Diurnal variations
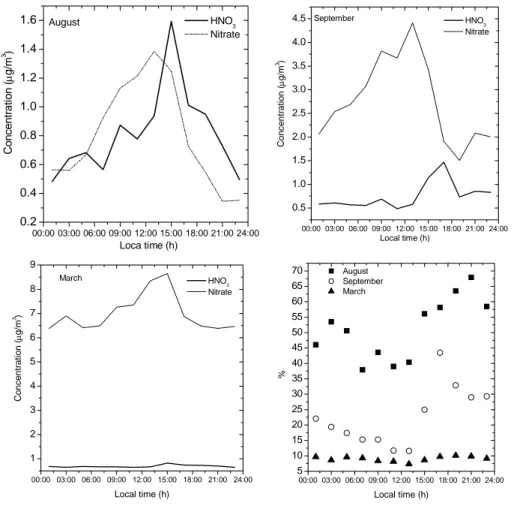
The diurnal variations of particulate ammonium nitrate and gaseous HNO3 are shown in Fig. 4. In August, the two compounds were found to be about equally abundant. The average observed concentration of nitric acid for August was 0.9 µg/m3 reaching
5
a maximum of 1.6 µg/m3in the afternoon when solar radiation was strongest and tem-peratures were highest. The aerosol nitrate peaked slightly earlier. Both components show a decrease in the afternoon due to dry deposition of HNO3 and an increase in early morning probably due to heterogeneous formation of nitrate. The maximum par-ticulate nitrate concentration thus occurred in Zurich at 12:00 local time, which is four
10
hours later than in Pittsburgh (Wittig et al., 2004). This time lag is explained by the temperature dependent partitioning of ammonium nitrate between the gas and aerosol phase. To get a rough estimate of the ammonium nitrate partitioning during the max-imum temperature, the expression given by Stelson and Seinfeld (1982) for the equi-librium constant (Kp) of the reaction between HNO3 and NH3 to form NH4NO3, was
15
taken
HNO3+ NH3↔ NH4NO3
The equilibrium constant, Kp, of this reaction is given as the product of the partial pressures of NH3and HNO3by
Kp= pNH3pHNO3. (1)
20
If Kp[ppb2]<pNH3*pHNO3, the system is supersaturated with ammonia and nitric acid, and a fraction of them will be transferred to the aerosol phase to establish equilibrium. Kp is temperature dependent and can also be expressed as (Seinfeld and Pandis, 1998)
ln Kp= 84 − (24220/T) − 6.1 ln(T/298) , (2)
ACPD
5, 5809–5839, 2005 Water soluble inorganic compounds in the Zurich area R. Fisseha et al. Title Page Abstract Introduction Conclusions References Tables Figures J I J I Back CloseFull Screen / Esc
Print Version Interactive Discussion
EGU
where T is the temperature in Kelvin and for a total pressure of 1 atm.
Kp was calculated from Eq. (2) at T=22◦C and fitted in Eq. (1) together with the mea-sured HNO3concentration (0.6 ppb). Based on this equation, 11.8 ppb of ammonia is required to reach equilibrium. If the concentration of ammonia or nitric acid exceeds this value, the equilibrium shifts towards the right resulting in formation of ammonium
5
nitrate. The calculated ammonia was compared with measurement values given by Emmenegger et al. (2004) for a tunnel entrance in Zurich city. The measured concen-tration at the tunnel entrance was much higher (36 ppb) compared to the calculated value, which implies that the formation of nitrate in Zurich city is very likely due to high ammonia concentrations.
10
3.2.2. Seasonal variations
A strong seasonal pattern of the NH4NO3 and nitric acid was observed. The highest contribution of NH4NO3 to total nitrate was found in March and the lowest in August. The contribution of nitrate to the PM 10 was also 5 times higher in March than in August. The total nitrate concentration (sum of nitrate and nitric acid) was also
sub-15
stantially higher in winter than in summer. Since photochemistry is less efficient during winter, the increase in total nitrate concentrations in winter is explained by efficient heterogeneous formation of nitrate on deliquesced aerosol particles and a longer life-time of nitrate in winter than in summer. The concentration of nitrate in winter also showed a good correlation with submicron particles (PM0.74, see Fig. 5) (r2=0.52)
de-20
termined from the integrated SMPS spectra assuming spherical particles with a density of 1.5 g/cm3(ammonium nitrate and sulfate have densities of 1.725 and 1.77 g/cm3, re-spectively, which is reduced to some extent by carbonaceous compounds and water). This confirms that nitrate contributes substantially to PM0.74 in winter (Fig. 5).
ACPD
5, 5809–5839, 2005 Water soluble inorganic compounds in the Zurich area R. Fisseha et al. Title Page Abstract Introduction Conclusions References Tables Figures J I J I Back CloseFull Screen / Esc
Print Version Interactive Discussion
EGU
3.2.3. Comparison with model results
The gas-particle partitioning of nitrate during March 2003 was further investigated using the Aerosol Inorganics Model II (AIM-II; http://www.hpc1.uea.ac.uk/∼e770/aim.
html; Clegg et al., 1998; Wexler and Clegg, 2002). The AIM-II describes the H+–NH+4–SO2−4 –NO−3–H2O system including solid phases and partitioning of NH3,
5
HNO3and H2SO4to the gas phase. The AIM determines the aerosol equilibrium state for a given amount of the above species by minimization of the Gibbs free energy of the system without simplifying assumptions. In this study sulfate, total nitrate, temperature and relative humidity measurements were available, and the aerosol was assumed to be fully neutralized with ammonia, that is [NH+4]=[NO−3]+2[SO2−4 ] in the model
in-10
put. The aerosol was further assumed to be present as an aqueous solution, i.e. the formation of solids was turned off in the model calculations presented here. Model predictions including the solid phases were also made but predictions were similar to those for the aqueous aerosol.
The time series of the measured and modeled fraction of total nitrate in the particle
15
phase along with the total nitrate, temperature and relative humidity is shown in Fig. 6. Low fractions of particulate nitrate were observed when the total nitrate loading was low, e.g. evening of 6 March, morning of 10 March, and 12 March, whereas high frac-tions of particulate nitrate coincided with high total nitrate loadings, e.g. from 19 March to 27 March. This reflects that NH3and HNO3start to partition to the particle phase in
20
significant amounts only if their gas phase saturation concentration is exceeded. The dominating effect of varying total nitrate loadings is possibly one reason that no clear influence of the diurnal variations of temperature and relative humidity was observed, whereas diurnal cycles of ammonia concentrations might also be important. The model prediction captures the major trends of the nitrate partitioning reasonably well.
How-25
ever, the predicted particulate nitrate fraction is often lower than measured, and di ffer-ences are typically larger during daytime. A main cause of that is probably that the atmospheric abundance of total ammonia is larger than the concentrations used in the
ACPD
5, 5809–5839, 2005 Water soluble inorganic compounds in the Zurich area R. Fisseha et al. Title Page Abstract Introduction Conclusions References Tables Figures J I J I Back CloseFull Screen / Esc
Print Version Interactive Discussion
EGU
model calculations thus driving more nitrate into the particle phase than predicted. To-tal ammonia concentrations used in the model runs ranged from 1 to 7 µg/m3, whereas ambient concentrations reported in Switzerland range from 3–7 µg/m3at the rural site Payerne (EMEP station CH02) and up to about 25 µg/m3 (gas phase ammonia only) at a tunnel entrance in Zurich (Emmenegger et al., 2004). Furthermore, the tunnel
5
entrance measurements showed a clear diurnal cycle with higher ammonia concentra-tions during daytime. This indicates that excess ammonia expected to be present in Zurich shifts the nitrate partitioning to the particle phase. Unfortunately, the AIM does not allow modelling with excess ammonia, that is [NH+4]>[NO−3]+2[SO2−4 ], which would provide an idea of the level of gas phase ammonia concentrations needed to explain
10
the observed nitrate partitioning. It has also to be mentioned that part of the difference between observation and model calculation might arise from positive artifacts in par-ticulate nitrate measurements due to organic nitrates or due to a disequilibrium state during the night caused by nitric acid production in aqueous particles through hydroly-sis of N2O5.
15
3.3. Nitrous acid (HONO)
HONO was measured in both campaigns in both the gas and the aerosol phase. It is well known that artifact HONO is formed from NO2 if an alkaline solution is used as scrubber solution (Spinder et al., 2003), however, with MQ water as a scrubber solution, artifact HONO from NO2 is negligible (Simon and Dasgupta, 1995; Acker et
20
al., 2004). In the gas phase, a diurnal variation of HONO is observed with an in-creasing concentration at night (Fig. 7). During the day the concentration of HONO decreased significantly reaching a minimum between 0.2–0.6 µg/m3. These values were comparable to the one reported by Kleffmann and Gavriloaiei (2005). Forma-tion of HONO during night time has been observed in urban areas (Acker et al., 2004)
25
and is attributed to heterogeneous reactions of NO2 on various surfaces. This het-erogeneous formation and accumulation processes during the night lead to maximum values in the morning hours before photolysis causes a significant decrease. A similar
ACPD
5, 5809–5839, 2005 Water soluble inorganic compounds in the Zurich area R. Fisseha et al. Title Page Abstract Introduction Conclusions References Tables Figures J I J I Back CloseFull Screen / Esc
Print Version Interactive Discussion
EGU
trend was also observed for particulate nitrite, however with a less persistent increase during the night. The ratio of aerosol phase nitrite to total nitrite varied from 25% in August to 41% in September. Gaseous HONO concentrations were positively corre-lated with NO2, with an average HONO/NO2 ratio of 2x10⁻² (Fig. 8). This value is significantly higher than the primary ratio from vehicles of 8.6x10⁻³ as reported by
5
Kurtenbach et al. (2001) indicating that heterogeneous formation processes such as the ones reported by Gutzwiller et al. (2002) contribute substantially to the total HONO concentration in Zurich.
3.4. Sulfate and sulfur dioxide
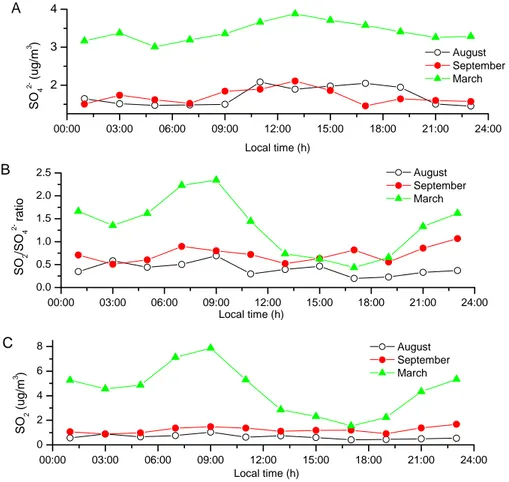
Figure 9 shows the diurnal variations of the measured particulate SO4−2
concentra-10
tions, the gas phase SO2concentration, and the ratios between these two. The diurnal variation of SO2was most pronounced in March. This is due to increased early morning emissions into a planetary boundary layer with a low mixing height. Other combustion products such as CO and NO also show similar variations over the day (Fig. 10). The strong seasonal variation of SO2 concentrations with highest values in March is
ex-15
plained by higher emissions due to room heating, lower mixing height of the planetary boundary layer, and less efficient oxidation to sulfate. Similar observations are also reported by Ruuskanen et al. (2003) and Altshuller (1984).
The average concentration of sulfate during the whole measurement period was 2.3 µg/m3. The highest concentration of sulfate was observed during March (Table 3),
20
however, the sulfate contribution to PM10 stayed virtually constant (see above). The sulfate values shown here are lower than those reported by Hueglin et al. (2005) for the same site. This is explained by a general decrease in the SO2 emission over the last years as shown by the NABEL data from Zurich (Fig. 11). The ratio of SO2to SO4 was higher in winter than in summer (Fig. 9), due to lower concentrations of reactive
25
species (OH, HO2or RO2, O3) (Dudkin et al., 2002). The same reason also explains the diurnal variation rather showing a maximum during the day (Fig. 9).
ACPD
5, 5809–5839, 2005 Water soluble inorganic compounds in the Zurich area R. Fisseha et al. Title Page Abstract Introduction Conclusions References Tables Figures J I J I Back CloseFull Screen / Esc
Print Version Interactive Discussion
EGU
4. Conclusions
Water soluble inorganic anions comprise on average more than one quarter of the total PM10. Nitrate contributes a larger fraction to PM10 in winter than in other seasons due to lower temperature. The value of nitrate also exceeds the one of sulfate during winter. The variations of nitrate were strongest, which is attributed to the temperature
5
dependency of nitrate aerosol partitioning. In August with high ambient temperatures the nitric acid concentration was highest, and due to a higher deposition rate of HNO3 than particulate nitrate, the total nitrate concentration in August was lower compared to March. The data showed marked seasonal and diurnal variations for gaseous HNO3, HONO, SO2, and their corresponding particulate phase except for sulfate.
10
Acknowledgements. This work is supported by the Swiss National Science Foundation. We
thank C. Hueglin, EMPA for providing the NABEL data.
References
Acker, K., Spindler, G., and Bruggemann, E.: Nitrous and nitric acid measurements during the INTERCOMP2000 campaign in Melpitz, Atmos. Environ., 38, 6497–6505, 2004.
15
Altshuller, A. P.: Atmospheric particle sulfur and sulfur dioxide relationships at urban and nonur-ban locations, Atmos. Environ., 18, 1421–1431, 1984.
Bassett, M. E. and Seinfeld, J. H.: Atmospheric equilibrium model of sulfate and nitrate aerosols, II. Particle size analysis, Atmos. Environ., 18, 1163–1170, 1984.
Charlson, R. J., Schwartz, S. E., Hales, J. M., Cess, R. D., Coakley, J. A., Hansen, J. E., and 20
Hofmann, D. J.: Climate forcing by anthropogenic aerosols, Science, 255, 423–430, 1992. Christoforou, C. S., Salmon, L. G., Hannigan, M. P., Solomon, P. A., and Cass, G. R.: Trends
in fine particle concentration and chemical composition in Southern California, J. Air Waste Manage. Assoc., 50, 43–53, 2000.
Clegg, S. L., Brimblecombe, P., and Wexler, A. S.: Thermodynamic model of the system H+–
25
NH+4–SO2−4 –NO−3–H2O at tropospheric temperatures, J. Phys. Chem. A, 102, 2137–2154,
ACPD
5, 5809–5839, 2005 Water soluble inorganic compounds in the Zurich area R. Fisseha et al. Title Page Abstract Introduction Conclusions References Tables Figures J I J I Back CloseFull Screen / Esc
Print Version Interactive Discussion
EGU Dudkin, V. A., Rukhin, V. B., and Chizhov, Y. L.: Photochemical oxidation of sulfur dioxide in air
in the presence of ozone. Theoretical Foundations of Chemical Engineering, 36, 172–175, 2002.
Emmenegger, L., Mohn, J., Sigrist, M., Marinov, D., Steinemann, U., Zumsteg, F., and Meier, M.: Measurement of ammonia emissions using various techniques in a comparative tunnel 5
study, Int. J. Environ. Pollut., 22, 326–341, 2004.
Finlayson-Pitts, B. J., and Pitts Jr., J. N.: Chemistry of the Upper and Lower Atmosphere, Academic Press, San Diego, pp. 298–301, 2000.
Gard, E. E, Kleeman, M. J., Gross, D. S., Hughes, L. S., Allen, J. O., Morrical, B. D., Fergenson, D. P., Dienes, T., Galli, M. E., Johnson, R. J., Cass, G. R., and Prather, K. A.: Direct obser-10
vation of heterogeneous chemistry in the atmosphere, Science, 279, 1184–1187, 1998. Gilli, G., Bono, R., Calleri, M., Corrao, G., and Scursatone, V.: Air pollution and health: a
descriptive study among populations of the urban area of Turin, Atmos. Environ., 22, 193– 194. 1988.
Gutzwiller, L., Arens, F., Baltensperger, U., Gaggeler, H. W., and Ammann, M.: Significance of 15
semivolatile diesel exhaust organics for secondary HONO formation, Environ. Sci. Technol., 36, 677–682, 2002.
Harrison, R. M., Jones, A. M., and Lawrence, R. G.: A pragmatic mass closure model for airborne particulate matter at urban background and roadside sites, Atmos. Environ., 37, 4927–4933, 2003.
20
Harrison, R. M., Jones, A. M., and Lawrence, R. G.: Major component composition of PM10 and PM2.5 from roadside and urban background sites, Atmos. Environ., 38, 4531–4538, 2004.
Henning, S., Weingartner, E., Schwikowski, M., G ¨aggeler, H. W., Gehrig, R., Hinz, K. P., Trim-born, A., Spengler, B., and Baltensperger, U.: Seasonal variation of water-soluble ions of 25
the aerosol at the high-alpine site Jungfraujoch (3580 m asl), J. Geophys. Res., 108, Art. No. 4030, doi:10.1029/2002JD002439, 2003.
Hueglin, C., Gehrig, R., Baltensperger, U., Gysel, M., Monn, C., and Vonmont, H.: Chemical characterization of PM2.5, PM10 and coarse particles at urban, near-city and rural sites in Switzerland, Atmos. Environ., 39, 637–651, 2005.
30
Kleffmann, J. and Gavriloaiei, T.: Daytime formation of nitrous acid: A major source of OH radicals in a forest, Geophys. Res. Lett., 32, doi:10.1029/2005GL022524, 2005.
ACPD
5, 5809–5839, 2005 Water soluble inorganic compounds in the Zurich area R. Fisseha et al. Title Page Abstract Introduction Conclusions References Tables Figures J I J I Back CloseFull Screen / Esc
Print Version Interactive Discussion
EGU P., Ackermann, R., Geyer, A., and Platt, U.: Investigations of emissions and heterogeneous
formation of HONO in a road traffic tunnel, Atmos. Environ., 35, 3385–3394, 2001.
Lee, Y. L. and Sequeira, R.: Water-soluble aerosol and visibility degradation in Hong Kong during autumn and early winter 1998, Environ. Pollut., 116, 225–233, 2002.
Magliano, K. L., Hughes, V. M., Chinkin, L. R., Coe, D. L., Haste, T. L., Kumar, N., and Lur-5
mann, F. W.: Spatial and temporal variations in PM10 and PM2.5 source contributions and comparison to emissions during the 1995 integrated monitoring study, Atmos. Environ., 33, 4757–4773, 1999.
Maynard, R.: Key airborne pollutants – the impact on health, Sci. Tot. Environ., 334–335, 9–13, 2004.
10
Morales, J. A., Bifano, C., and Escalona, A.: Atmospheric deposition of SO4-S and (NH4 +
NO3)-N at two rural sites in the Western Maracaibo Lake Basin, Venezuela, Atmos. Environ.,
32, 3051–3058, 1998.
Murphy, D. M. and Thomson, D. S.: Chemical composition of single aerosol particles at Idaho Hill: Negative ion measurements, J. Geophys. Res., 102, 6353–6368, 1997.
15
Pakkanen, T. A., Loukkola, K., Korhonen, C. H., Aurela, M., Makela, T., Hillamo, R. E., Aarnio, P., Koskentalo, T., Kousa, A., and Maenhaut, W.: Sources and chemical composition of atmospheric fine and coarse particles in the Helsinki area, Atmos. Environ., 35, 5381–5391, 2001.
Putaud, J. P., Raes, F., Van Dingenen, R., Bruggemann, E., Facchini, M. C., Decesari, S., 20
Fuzzi, S., Gehrig, R., Huglin, C., Laj, P., Lorbeer, G., Maenhaut, W., Mihalopoulos, N., Mul-ller, K., Querol, X., Rodriguez, S., Schneider, J., Spindler, G., ten Brink, H., Torseth, K., and Wiedensohler, A.: A European aerosol phenomenology, 2: chemical characteristics of particulate matter at kerbside, urban, rural and background sites in Europe, Atmos. Environ., 38, 2579–2595, 2004.
25
Pyne, S.: Small particles add up to big disease risk, Science, 295, 1994, 2002.
Querol, X., Alastuey, A., Rodriguez, S., Plana, F., Ruiz, C. R., Cots, N., Massagu ´e, G., and Puig, O.: PM10 and PM2.5 source apportionment in the Barcelona Metropolitan Area, Catalonia, Spain, Atmos. Environ., 35, 6047–6419, 2001.
Querol, X., Alastuey, A., Ruiz, C. R., Artinano, B., Hansson, H. C., Harrison, R. M., Buringh, 30
E., ten Brink, H. M., Lutz, M., Bruckmann, P., Straehl, P., and Schneider, J.: Speciation and origin of PM10 and PM2.5 in selected European cities, Atmos. Environ., 38, 6547–6555, 2004.
ACPD
5, 5809–5839, 2005 Water soluble inorganic compounds in the Zurich area R. Fisseha et al. Title Page Abstract Introduction Conclusions References Tables Figures J I J I Back CloseFull Screen / Esc
Print Version Interactive Discussion
EGU Ruuskanen, T. M., Reissell, A., Keronen, P., Aalto, P. P., Laakso, L., Gronholm, T., Hari, P.,
and Kulmala, M.: Atmospheric trace gas and aerosol particle concentration measurements in Eastern Lapland, Finland 1992–2001, Boreal Environ. Res., 8, 335–349, 2003.
Schaap, M., Spindler, G., Schulz, M., Acker, K., Maenhaut, W., Berner, A., Wieprecht, W., Streit, N., Mueller, K., Br ¨uggemann, E., Putaud, J.-P., Puxbaum, H., Baltensperger, U., and 5
ten Brink, H. M.: Artifacts in the sampling of nitrate studied in the “INTERCOMP” campaigns of EUROTRAC-AEROSOL, Atmos. Environ., 38, 6497–6505, 2004.
Schaap, M., M ¨uller, K., and ten Brink, H. M.: Constructing the European aerosol nitrate con-centration field from quality analysed data, Atmos. Environ., 36, 1323–1335, 2002.
Seinfeld, J. H. and Pandis, S.: Atmospheric Chemistry and Physics, John Wiley & Sons, Inc., 10
New York, 1998.
Simon, P., and Dasgupta, P.: Wet effluent denuder coupled liquid/ion chromatography systems: annular and parallel plate design, Anal. Chem., 65, 1134–1139, 1993.
Simon, P. and Dasgupta, P.: Continuous automated measurement of the soluble fraction of atmospheric particulate matter, Anal. Chem., 34, 71–78, 1995.
15
Spindler, G., Hesper, J., Bruggemann, E., Dubois, R., Muller, T., and Herrmann, H.: Wet
an-nular denuder measurements of nitrous acid: laboratory study of the artifact reaction of NO2
with S(IV) in aqueous solution and comparison with field measurements, Atmos. Environ., 37, 2643–2662, 2003.
Stelson, A. W. and Seinfeld, J. H.: Relative humidity and temperature dependence of the am-20
monium nitrate dissociation constant, Atmos. Environ., 16, 983–992, 1982.
Stockwell, W. R., Watson, J. G., Robinson, N. F., Steiner, W., and Sylte, W. W.: The ammonium nitrate particle equivalent of NOx emissions for wintertime conditions in Central California’s San Joaquin Valley, Atmos. Environ., 34, 4711–4717, 2000.
Turnbull, A. B. and Harrison, R. M.: Major component contributions to PM10 composition in the 25
UK atmosphere, Atmos. Environ., 34, 3129–3137, 2000.
Van Dorland, R., Dentener, F. J., and Lelieveld, J.: Radiative forcing due to tropospheric ozone and sulfate aerosols, J. Geophys. Res., 102, 28 079–21 100, 1997.
Wexler, A. S. and Clegg, S. L.: Atmospheric aerosol models for systems including the
ions H+, NH+4, Na+, SO2−4 , NO−3,Cl−, Br−, and H2O, J. Geophys. Res., 107, 4207,
30
doi:10.1029/2001JD000451, 2002.
Wieprecht, W., Acker, K., Muller, K., Spindler, G., Bruggemann, E., Maenhaut, W., Chi, X. G., Hitzenberger, R., Bauer, H., and ten Brink, H.: INTERCOMP2000: ionic constitution and
ACPD
5, 5809–5839, 2005 Water soluble inorganic compounds in the Zurich area R. Fisseha et al. Title Page Abstract Introduction Conclusions References Tables Figures J I J I Back CloseFull Screen / Esc
Print Version Interactive Discussion
EGU comparison of filter and impactor, Atmos. Environ., 38, 6477–6486, 2004.
Wittig, A. E., Takahama, S., Khlystov, A. Y., Pandis, S. N., Hering, S., Kirby, B., and Davidson, C.: Semi-continuous PM2.5 inorganic composition measurements during the Pittsburgh air quality study, Atmos. Environ., 38, 3201–3213, 2004.
Zellweger, C., Ammann, M., Hofer, P., and Baltensperger, U.: NOyspeciation with a combined
5
wet effluent diffusion denuder-aerosol collector coupled to ion chromatography, Atmos.
ACPD
5, 5809–5839, 2005 Water soluble inorganic compounds in the Zurich area R. Fisseha et al. Title Page Abstract Introduction Conclusions References Tables Figures J I J I Back CloseFull Screen / Esc
Print Version Interactive Discussion
EGU
Table 1. Summary of the Dionex ion chromatography system used for online measurement of
the anions.
Analytical column AS 17, 4mm
Guard column AG 17, 4mm
Pump IP 20
Detector CD 25 (conductivity detector)
Eluent generator EG40 eluent generator
Concentrator column TAC-LP1
Trap column ATC-1
software Peaknet 6.4
Suppressor ASRS, 4mm
ACPD
5, 5809–5839, 2005 Water soluble inorganic compounds in the Zurich area R. Fisseha et al. Title Page Abstract Introduction Conclusions References Tables Figures J I J I Back CloseFull Screen / Esc
Print Version Interactive Discussion
EGU
Table 2. Instruments used by the NABEL for gas and PM10 measurements.
Compound Method Instrument
NO/NO2 Chemiluminescence Horiba APNA 360
Ozone UV-Absorption TEI 49C
CO Infrared-Absorption Horiba APMA 360
PM10 Beta gauge Digitel DA-80H
ACPD
5, 5809–5839, 2005 Water soluble inorganic compounds in the Zurich area R. Fisseha et al. Title Page Abstract Introduction Conclusions References Tables Figures J I J I Back CloseFull Screen / Esc
Print Version Interactive Discussion
EGU
Table 3. Mean, median and standard deviations of the measured gas and aerosol compounds
and PM10. The concentrations are all in µg/m3except CO which is in mg/m3. G= gas phase
and A= aerosol phase.
August
G-NO3 G-SO2 A-NO3 A-SO4 NO2 NO O3 CO PM10
Mean 0.81 0.68 0.83 1.71 28.6 7.4 49.1 0.37 22.9
Median 0.55 0.41 0.40 1.53 25.3 3.0 46.3 0.33 22.6
StDv 0.85 0.80 1.10 1.32 15.3 11.9 34.1 0.17 9.3
September
G-NO3 G-SO2 A-NO3 A-SO4 NO2 NO O3 CO PM10
Mean 0.76 1.22 2.63 1.65 30.1 8.7 37.0 0.39 21.6
Median 0.50 0.90 1.39 1.25 28.2 4.3 30.3 0.35 20.5
StDv 0.71 1.18 3.22 1.43 13.9 15.1 26.9 0.16 10.5
March
G-NO3 G-SO2 A-NO3 A-SO4 NO2 NO O3 CO PM10
Mean 0.69 4.07 6.85 3.37 50.6 16.5 41.8 0.51 34.5
Median 0.63 2.87 4.10 2.89 44.3 5.0 40.9 0.43 30.6
ACPD
5, 5809–5839, 2005 Water soluble inorganic compounds in the Zurich area R. Fisseha et al. Title Page Abstract Introduction Conclusions References Tables Figures J I J I Back CloseFull Screen / Esc
Print Version Interactive Discussion EGU y = 1.3887x + 1.1896 R2 = 0.7107 0 5 10 15 20 25 30 35 40 45 0 5 10 15 20 25 WEDD/AC (µg/m3) U V f lu o re scen c e ( µg/m 3 )
Fig. 1. Correlation between the WEDD/AC and UV-florescence method for SO2measurement.
ACPD
5, 5809–5839, 2005 Water soluble inorganic compounds in the Zurich area R. Fisseha et al. Title Page Abstract Introduction Conclusions References Tables Figures J I J I Back CloseFull Screen / Esc
Print Version Interactive Discussion EGU 10 10 13 5 15 25 33 45 22 1.3 1.5 0.2 51 29 38 0% 10% 20% 30% 40% 50% 60% 70% 80% 90% 100%
August September March
unknown NaCl TC NH4NO3 (NH4)2SO4
Fig. 2. Chemical composition of PM10 at Zurich Kaserne for the three months. The values in
the bars indicate the percentage contributed by the component.
ACPD
5, 5809–5839, 2005 Water soluble inorganic compounds in the Zurich area R. Fisseha et al. Title Page Abstract Introduction Conclusions References Tables Figures J I J I Back CloseFull Screen / Esc
Print Version Interactive Discussion EGU 10 20 30 40 50 60 70 0 2 4 6 8 10 12 10 20 30 40 50 60 70 0 5 10 15 20 5 10 15 20 25 30 35 0 1 2 3 4 5 6 7 5 10 15 20 25 30 35 0 2 4 6 8 10 12 14 10 15 20 25 30 35 0 1 2 3 4 5 10 15 20 25 30 35 0 1 2 3 4 5 R2 = 0.1071 March SO 4 2-(µ g/ m 3) PM10 (µg/m3 ) R2 = 0.6489 March NO 3 - (µg/m 3) PM10 (µg/m3 ) R2 = 0.1376 September SO 4 2-(µ g/ m 3) PM10 (µg/m3 ) September R2 = 0.1644 NO 3 - (µg/ m 3) PM10 (µg/m3) August R2 = 0.0449 SO 4 2-(µ g/ m 3) PM10 (µg/m3 ) August R2 = 0.2013 NO 3 - ( µg/m 3) PM10 (µg/m3 )
Fig. 3. Correlations of sulfate and nitrate (calculated as ammonium sulfate and ammonium
nitrate, respectively) with PM10. The dotted line in the March sulfate graph indicates the current
ACPD
5, 5809–5839, 2005 Water soluble inorganic compounds in the Zurich area R. Fisseha et al. Title Page Abstract Introduction Conclusions References Tables Figures J I J I Back CloseFull Screen / Esc
Print Version Interactive Discussion EGU 00:00 03:00 06:00 09:00 12:00 15:00 18:00 21:00 24:00 0.2 0.4 0.6 0.8 1.0 1.2 1.4 1.6 00:00 03:00 06:00 09:00 12:00 15:00 18:00 21:00 24:00 0.5 1.0 1.5 2.0 2.5 3.0 3.5 4.0 4.5 00:00 03:00 06:00 09:00 12:00 15:00 18:00 21:00 24:00 5 10 15 20 25 30 35 40 45 50 55 60 65 70 00:00 03:00 06:00 09:00 12:00 15:00 18:00 21:00 24:00 1 2 3 4 5 6 7 8 9 August C o n c en tr ati o n ( µg/m 3) Loca time (h) HNO 3 Nitrate March September C o nc en tr at ion ( µg/ m 3) Local time (h) HNO3 Nitrate % Local time (h) August September March C o nc en tr at ion ( µg/ m 3) Local time (h) HNO3 Nitrate
Fig. 4. Average diurnal variation of nitric acid and aerosol nitrate for the three months. The
ACPD
5, 5809–5839, 2005 Water soluble inorganic compounds in the Zurich area R. Fisseha et al. Title Page Abstract Introduction Conclusions References Tables Figures J I J I Back CloseFull Screen / Esc
Print Version Interactive Discussion EGU 0 20 40 60 80 100 120 140 03.03.2003 05.03.2003 07.03.2003 09.03.2003 11.03.2003 13.03.2003 15.03.2003 17.03.2003 19.03.2003 21.03.2003 23.03.2003 25.03.2003 27.03.2003 Local time (h) P M 0. 74 ( µ g/ m 3) 0 5 10 15 20 25 30 A e ro s o l n it rat e ( µ g/ m 3) PM0.74 NO3
ACPD
5, 5809–5839, 2005 Water soluble inorganic compounds in the Zurich area R. Fisseha et al. Title Page Abstract Introduction Conclusions References Tables Figures J I J I Back CloseFull Screen / Esc
Print Version Interactive Discussion
EGU
Fig. 6. Measured and modeled partitioning of nitrate between particle and gas phase (bottom
panel). Total measured nitrate (top panel) and temperature and relative humidity (center panel) are also shown.
ACPD
5, 5809–5839, 2005 Water soluble inorganic compounds in the Zurich area R. Fisseha et al. Title Page Abstract Introduction Conclusions References Tables Figures J I J I Back CloseFull Screen / Esc
Print Version Interactive Discussion EGU Aerosol 0 0.2 0.4 0.6 0.8 1 1.2 01:00 03:00 05:00 07:00 09:00 11:00 13:00 15:00 17:00 19:00 21:00 23:00 Local time (h) Co n cen tr at io n ( µg/ m 3) August September March Gas phase 0 0.4 0.8 1.2 1.6 2 01:00 03:00 05:00 07:00 09:00 11:00 13:00 15:00 17:00 19:00 21:00 23:00 Local time (h) Co n cen tr at io n ( µg/ m 3) August September March
ACPD
5, 5809–5839, 2005 Water soluble inorganic compounds in the Zurich area R. Fisseha et al. Title Page Abstract Introduction Conclusions References Tables Figures J I J I Back CloseFull Screen / Esc
Print Version Interactive Discussion EGU R2 = 0.5885 0 20 40 60 80 100 120 140 160 0 0.5 1 1.5 2 2.5 3 3.5 4 4.5 HONO (µg/m3) NO 2 ( µ g/ m 3 )
ACPD
5, 5809–5839, 2005 Water soluble inorganic compounds in the Zurich area R. Fisseha et al. Title Page Abstract Introduction Conclusions References Tables Figures J I J I Back CloseFull Screen / Esc
Print Version Interactive Discussion EGU 00:00 03:00 06:00 09:00 12:00 15:00 18:00 21:00 24:00 2 3 4 00:00 03:00 06:00 09:00 12:00 15:00 18:00 21:00 24:00 0 2 4 6 8 00:00 03:00 06:00 09:00 12:00 15:00 18:00 21:00 24:00 0.0 0.5 1.0 1.5 2.0 2.5 SO 4 2- (u g /m 3 ) Local time (h) August September March B A SO 2 (u g /m 3 ) Local time (h) August September March C SO 2 /SO 4 2- ra ti o Local time (h) August September March
Fig. 9. (A) Diurnal variation of the average concentration of SO2−4 for the three months.
ACPD
5, 5809–5839, 2005 Water soluble inorganic compounds in the Zurich area R. Fisseha et al. Title Page Abstract Introduction Conclusions References Tables Figures J I J I Back CloseFull Screen / Esc
Print Version Interactive Discussion EGU 00:00 04:00 08:00 12:00 16:00 20:00 20 30 40 50 60 70 00:00 04:00 08:00 12:00 16:00 20:00 0 10 20 30 40 50 00:00 04:00 08:00 12:00 16:00 20:00 0 20 40 60 80 100 00:00 04:00 08:00 12:00 16:00 20:00 0.3 0.4 0.5 0.6 0.7 00:00 04:00 08:00 12:00 16:00 20:00 24:00 20 25 30 35 40 NO2 µ g/ m 3 Local tme (h) August September March NO µ g/ m 3 Local time (h) August Septmber March Ozone µ g/ m 3 Local time (h) August September March CO mg/ m 3 Local time (h) August September March PM10 µ g/ m 3 Local time (h) August September March
ACPD
5, 5809–5839, 2005 Water soluble inorganic compounds in the Zurich area R. Fisseha et al. Title Page Abstract Introduction Conclusions References Tables Figures J I J I Back CloseFull Screen / Esc
Print Version Interactive Discussion EGU Jun . 9 8 Jun . 9 9 Jun . 0 0 Jun . 0 1 Jun . 0 2 Jun . 0 3 0 10 20 30 40 50 60 C o n c e n tr a tio n in p p b