HAL Id: hal-00296081
https://hal.archives-ouvertes.fr/hal-00296081
Submitted on 24 Nov 2006
HAL is a multi-disciplinary open access
archive for the deposit and dissemination of
sci-entific research documents, whether they are
pub-lished or not. The documents may come from
teaching and research institutions in France or
abroad, or from public or private research centers.
L’archive ouverte pluridisciplinaire HAL, est
destinée au dépôt et à la diffusion de documents
scientifiques de niveau recherche, publiés ou non,
émanant des établissements d’enseignement et de
recherche français ou étrangers, des laboratoires
publics ou privés.
Methane emission from tropical savanna Trachypogon
sp. grasses
E. Sanhueza, L. Donoso
To cite this version:
E. Sanhueza, L. Donoso. Methane emission from tropical savanna Trachypogon sp. grasses.
At-mospheric Chemistry and Physics, European Geosciences Union, 2006, 6 (12), pp.5315-5319.
�hal-00296081�
www.atmos-chem-phys.net/6/5315/2006/ © Author(s) 2006. This work is licensed under a Creative Commons License.
Chemistry
and Physics
Methane emission from tropical savanna Trachypogon sp. grasses
E. Sanhueza and L. Donoso
IVIC, Atmospheric Chemistry Laboratory, Caracas, Venezuela
Received: 2 June 2006 – Published in Atmos. Chem. Phys. Discuss.: 24 July 2006
Revised: 29 September 2006 – Accepted: 17 November 2006 – Published: 24 November 2006
Abstract. Methane flux measurements from the soil-grass
system were made during the wet season in unperturbed plots and plots where standing dry and green Trachypogon
sp. grasses were clipped to just above the soil surface.
Re-sults support the surprising discovery that vegetation emits methane. The results of this work allows to infer that the savanna dry/green mixture of grasses produce methane at a rate of ∼10 ng m−2s−1, which is in agreement with early
published soil-grass system fluxes. An extrapolation of this flux to the global savanna produces an annual emission much lower than the CH4production recently suggested in the
lit-erature. On the other hand, during the wet season savanna soil consume CH4at a rate of ∼4.7 ng m−2s−1. Therefore,
the tropical savanna soil-grass system would make a modest contribution to the global budget of methane.
1 Introduction
Methane is an important greenhouse gas, whose radiative forcing (1750–1998) has been estimated to be 0.48 Wm−2,
∼20% of the total positive forcing produced by long lived gases and tropospheric ozone (Ramaswamy et al., 2001). The methane budget (sources and sinks) was believed to be relatively well known, however, recently a surprising dis-covery, based on laboratory measurements, indicated that land plants would emit methane in significant quantities, up to 30% of the present evaluated global sources (Keppler et al., 2006); however, Kirschbaum et al. (2006), using the same basic CH4 flux information produced by Keppler et
al. (2006), presented alternative extrapolations, which indi-cate much lover global plant CH4emissions. Methane
emis-sions from vegetation may explain early field results from tropical ecosystems (Crutzen et al., 2006) and recent satellite
Correspondence to: E. Sanhueza
(esanhuez@ivic.ve)
observations (Frankenberg et al., 2005). In the past, erratic and sometimes confusing results were obtained in studies of CH4 soil fluxes in the Venezuelan savanna region (Hao et
al., 1988; Scharffe et al., 1990; Sanhueza et al., 1994a). On average a net emission of methane was reported, however, quite often consumptions from individual plots were regis-tered. According to Sanhueza et al. (1994a), these results are in contrast to the general belief that non-flooded soils of temperate, subtropical, and tropical regions only act as sinks for atmospheric methane. The authors speculated that, by an unknown mechanism, the methane emitted in the Venezue-lan savannah region could be produced by biogenic activ-ity. Now, after publication of the Keppler et al. (2006) paper, showing that both living plants and plant detritus produce methane, it is clear that the soil-grass system is more com-plex than previously believed. In addition to soil processes (e.g., population of methylotrophic bacteria) other aspects (e.g., presence of living or dead plants) must be taken into consideration, to understand/explain the CH4flux
variabil-ity. In this paper we report a study of the soil-grass system in the central savanna region of Venezuela, made in 1990, which allows to infer the role of grasses in the fluxes of CH4
from the soil-grass system.
2 Field measurements
The study was performed during the 1990 wet season at the Estaci´on Biol´ogica de los Llanos, located in the central part of the Venezuelan savannah climatic region (8◦53′N;
67◦19′W). Two well defined climatic periods occur in the
area: a dry season from December to April and a rainy sea-son from May to November. The annual rainfall is 1300 mm and the annual mean temperature is 27.6◦C. Soils are acidic,
with a low rate of mineralization and poor in nutrients. They support graminea grasses (mainly Trachypogon sp. and
5316 E. Sanhueza and L. Donoso: Methane emission from savanna grasses
-15 -5 5 15
22-Oct 26-Oct 30-Oct 3-Nov 7-Nov 11-Nov 25
-15 -5 5
22-Oct 26-Oct 30-Oct 3-Nov 7-Nov 11-Nov
Cleared Undisturbed 0 2 4 6 8 10
22-Oct 26-Oct 30-Oct 3-Nov 7-Nov 11-Nov
R a in fa ll , m m M e th a n e F lu x , n g m -2 s -1
Fig. 1. Methane fluxes from undisturbed and cleared plots. Two points over 25 ng m−2s−1 from undisturbed plots in October are
not shown. The amount of rainfall is also given.
americana, Boudichia virgilioides and Byrsonima crassifo-lia). Physical and chemical properties of the soils, obtained
from soil samples of 10 cm depth, were given by Sanhueza et al. (1994b).
Fluxes from the soil-grasses system were measured us-ing the enclosed chamber technique; the stainless steel glass chamber and other details were similar to those described by Conrad and Seiler (1985). During measurements the cham-ber was covered with aluminum foil. CH4 was analyzed
by gas chromatography, using a flame ionization detector. Other experimental/analytical details are given by Scharffe et al. (1990). Gas samples were automatically supplied to the chromatograph injection valve and re-circulated back to the chamber at a flow rate of 250 mL min−1. The gas stream
passed through a cold trap at 78◦C to remove water.
A particular plot was measured for ∼60 min, during which the following samples were injected to the gas chromato-graph: one sample of ambient air, seven samples from the chamber (1 every 6 min), and two samples of calibration gas. To initiate measurements, the chamber was placed manually over the frame; after measurements were made the cham-ber was moved to another frame and the process repeated. Most experiments show that after the chamber was closed, variations (increase or decrease) in the concentration were
observed. After a relatively short period, changes in concen-trations decline and fluxes (emission or consumption) were calculated using only the fourth initial points of a particular run. Gravimetric soil moistures were measured in samples of 2 cm depth. Soil temperature at 1 cm depth was recorded continuously during flux measurements with a thermocouple.
3 Results
Methane flux measurements were made in four unperturbed plots and three plots where standing grasses were clipped to just above the soil surface and plant litter removed from the soil surface (cleared plots). In the unperturbed plots there was a representative amount of Trachypogon sp grasses, which is the most abundant natural grass in the region. Since the study was made in an area which was not burned the pre-vious dry season, dry dead standing grasses were mixed with green ones; in average 46% (dry weight) was dry grass.
Individual flux measurements are shown in Fig. 1. In the figure is also indicated the rainfall that occurred during the measurement period; average soil moistures during the rainy days (23–26 October) was ∼8% and ∼3% during the less rainy period (1–7 November). Under this soil moisture con-ditions there should not be any gas transport limitation be-tween atmospheric CH4and the soil bacteria (Striegl, 1993;
Castro et al., 1995). During both periods (rainy and less rainy) measurements were made at the same 4 unperturbed and 3 cleared plots.
In unperturbed plots (Fig. 1a) fluxes produce during the 23–26 October period were quite different than the ones ob-served during the 1–7 November period. This is not surpris-ing considersurpris-ing that the soil-grass system is quite compli-cate. CH4consumption by soils would depend on soil
mois-ture and soil temperamois-ture (Castro et al., 1995; Hanson and Hanson, 1996), on the other hand, CH4production by plants
would depend on ambient temperatures and solar irradiation (Keppler et al., 2006), and also if plant are live or dead. It seems that soil and ambient conditions during the 1–7 November period favor CH4soil consumption, whereas
con-ditions in the 23–26 October period seems to favor methane emission from the soil-grass system; e.g., clearly soil con-sumption is lower than the one observed in the November period (Fig. 1, cleared plots). CH4fluxes plotted as a
func-tion of soil temperatures are shown in Fig. 2. In general, in the undisturbed plots (Fig. 2a) methane emission was ob-served at temperatures lower than ∼30◦C, whereas
consump-tion was recorded at higher temperature. This could mean that at high temperatures live grasses decrease the production of methane (likely due to physiological stress) and/or that the bacteria activity, which consumes methane, increases. According to Hanson and Hanson (1996) different soils ex-hibit different methane oxidation responses with respect to temperature, indicating that populations of methanotrophs in nature could adapt to different temperatures; methane
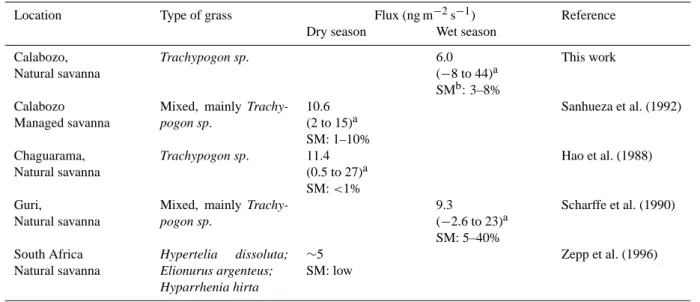
Table 1. Methane fluxes from the soil-grass system in the tropical savanna.
Location Type of grass Flux (ng m−2s−1) Reference
Dry season Wet season
Calabozo, Natural savanna Trachypogon sp. 6.0 (−8 to 44)a SMb: 3–8% This work Calabozo Managed savanna
Mixed, mainly Trachy-pogon sp. 10.6 (2 to 15)a SM: 1–10% Sanhueza et al. (1992) Chaguarama, Natural savanna Trachypogon sp. 11.4 (0.5 to 27)a SM: <1% Hao et al. (1988) Guri, Natural savanna
Mixed, mainly Trachy-pogon sp. 9.3 (−2.6 to 23)a SM: 5–40% Scharffe et al. (1990) South Africa Natural savanna Hypertelia dissoluta; Elionurus argenteus; Hyparrhenia hirta ∼5 SM: low Zepp et al. (1996)
aaverage (range);bsoil moisture
consumption in cleared soil (Fig. 2b) presents a weak posi-tive correlation with soil temperature, similarly to findings of Koschorreck and Conrad (1993) in different German soils.
In their natural environment, savanna aerated soils contin-uously change from “wet” and “dry” conditions, which in turn conditions soil and near surface temperatures. There-fore, in spite of the differences between the two periods, we average over all the data to obtain a representative value for the natural savannah grass system. In that way, the aver-aged flux for the unperturbed plots shows a net production of methane from the soil-grass system of 6.0 ng m−2s−1, and
a standard error of 2.0 ng m−2s−1 (n=34); this result is in
agreement with published data summarized in Table 1. On the other hand, as presented in Fig. 1b, the perturbed-cleared plots showed a clear consumption of CH4 with an average
of −4.7 ng m−2s−1 and a standard error of 0.9 ng m−2s−1
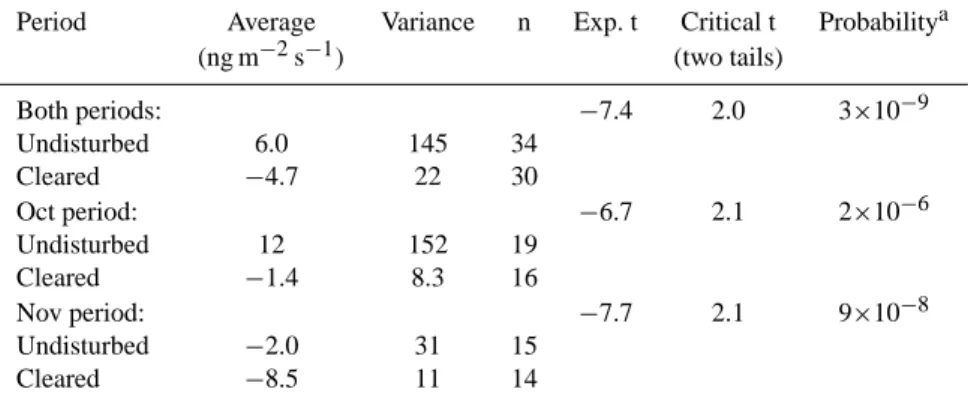
(n=30). A t-test analysis of the data indicates that the two sets (undisturbed and cleared plots) are statistically different, whether we include all the data together or the two groups separately, with an α value of 0.05 (95% significance); a summary of the statistical results is given in Table 2. During the 1–7 November period, the average flux from undisturbed plots is significantly different than the one from cleared plots, indicating that grasses emit methane compensating for soil consumption. Therefore, under regular field conditions, on average, the soil-grass system emits CH4, most likely due
to methane production from grasses, supporting the surpris-ing discovery by Keppler et al. (2006) that vegetation emits methane. Cleared savanna soils consume methane, most likely due to the activity of methylotrophic bacteria in aer-ated soils (Conrad, 1996; Hanson and Hanson, 1996).
-15 -5 5 15 25 20 25 30 35 40 45 Undisturbed -15 -5 5 20 25 30 35 40 45 Soil temperature, ºC Cleared M e th a n e F lu x e s , n g m -2 s -1
Fig. 2. Methane fluxes as a function of soil temperature in both undisturbed and cleared plots.
In the laboratory experiments described by Keppler et al. (2006), the exposition of living or dead plants to so-lar radiation induced a so-large increase of the emission of methane, which continued for a relatively long period of time (∼15 min) after the light was switched off. As men-tioned, in our field CH4-flux measurements, plants or
de-tritus present in the experimental plots were exposed to the sun light until the chamber was set in position and the fluxes were calculated using the firsts four time points (less than 15 min). However, since emissions from plants are not well
5318 E. Sanhueza and L. Donoso: Methane emission from savanna grasses
Table 2. t-Test (α=0.05) to compare undisturbed and cleared conditions measurements.
Period Average Variance n Exp. t Critical t Probabilitya
(ng m−2s−1) (two tails) Both periods: −7.4 2.0 3×10⁻⁹ Undisturbed 6.0 145 34 Cleared −4.7 22 30 Oct period: −6.7 2.1 2×10⁻⁶ Undisturbed 12 152 19 Cleared −1.4 8.3 16 Nov period: −7.7 2.1 9×10⁻⁸ Undisturbed −2.0 31 15 Cleared −8.5 11 14
aLow probabilities indicate that the two groups of data are significant different.
understood we do not know what sort of response would be found if samples were illuminated with sunlight during flux measurements.
4 Discussion
4.1 Methane consumption by savanna soils
The results from the cleared plots indicate that savanna soils consume methane under wet season conditions. The clear-ance of the savanna soil surface (grasses and litter) by burn-ing also produces a significant reduction of the methane pro-duction from the soil-grass system (Poth et al., 1995; Zepp et al., 1996). Actually, at the cerrado site in Brazil, the burned soils consume methane, whereas the unperturbed soils pro-duce CH4 (Poth et al., 1995), in good agreement with our
clearing experiment at the Calabozo site.
The consumption rate of −4.7 ng m−2s−1obtained in this
work, during the wet season, is in the range of consumptions reported by Seiler et al. (1984) in soils of a broad-leafed sa-vanna in South Africa. On the other hand, evidence under very dry conditions (Hao et al., 1988; Zepp et al., 1996) sug-gests that the consumption of atmospheric methane by sa-vanna soils would be negligible during the dry season, most likely due to an inhibition of the soil microbial processes un-der dry conditions. Extrapolating the wet season (7 months) consumption rate, to the world savanna, produces a soil sa-vanna sink of methane of ∼1.3 Tg yr−1.
4.2 Methane production by savanna grasses
Emission of methane from tropical savanna soils have been reported at sites in Venezuela (Hao et al., 1988; Scharffe et al., 1990; Sanhueza et al., 1992), Brazil (Poth et al., 1995) and South Africa (Zepp et al., 1996), which now should be interpreted as fluxes from the soil-grass system. Table 1 presents a summary of fluxes from the soil-grass system
re-ported in the literature, which are in relatively good agree-ment with the emissions rates observed in this work. The scarce data suggest that higher amounts of CH4are produced
during the dry season; in this case the production of methane should be less compensate by soil consumption.
The average fluxes obtained in this work from unper-turbed (6.0 ng m−2s−1)and cleared (−4.7 ng m−2s−1)plots
indicate that the mixture of green and dry Trachypogon sp. grasses produce methane at a rate of 10.7 ng m−2s−1, during
the wet season; fluxes from the soil-grass system measured at the Guri site (see Table 1) suggest a slightly higher pro-duction of methane (∼14 ng m−2s−1)from grasses. On the
other hand, using the fluxes obtained during the dry season at the Chaguarama and Calabozo sites (see Table 1), and as-suming negligible methane soil consumption under very dry soil conditions, a production of methane of ∼10 ng m−2s−1
from grasses is derived. Therefore, assuming similar emis-sions (∼10 ng m−2s−1)during dry and wet seasons and that
this flux is representative of the world savannas, with a to-tal area of 15×106km2, a global emission of methane from savanna grasses (green plus dry) of ∼5 Tg yr−1is estimated.
This annual emission is higher than the value given by Kep-pler et al. (2006) for tropical savanna and grassland leaf litter (mean: 1 Tg yr−1), but lower than the one for living biomass
(mean: 29.2 Tg yr−1); however, it is in the same range than
the global savanna extrapolation (2.2–6.6 Tg yr−1)reported
by Kirschbaum et al. (2006).
In conclusion, our results suggest that savanna grasses make a modest contribution to the global emission of methane (∼1%), which is in part compensated by soil consumption during the wet season. The low production of methane from tropical savanna grasses is in agreement with results obtained at temperate grasslands (Mosier et al., 1991, 1997) and tropical pastures (Keller and Reiners, 1994; Mosier and Delgado, 1997). Those studies found that the soil-grass system of these ecosystems consumes methane.
Acknowledgements. The study on tropical land use change and its effect on atmospheric trace gas fluxes, received financial support from the U.S. Environmental Protection Agency, interagency agreement DWVZ934787-01-1.
Edited by: T. R¨ockmann
References
Castro, M. S., Steudler, P. A., Melillo, J. M., Aber, J. D., and Bow-den, R. D.: Factors controlling atmospheric methane consump-tion by temperate forest soils, Global Biogeochem. Cycles, 9, 1–10, 1995.
Conrad, R. and Seiler, W.: Influence of temperature, moisture, and organic carbon on the flux of H2and CO between soil and
at-mosphere: Field studies in subtropical regions, J. Geophys. Res., 90, 5699–5709, 1985.
Conrad, R.: Soil microorganisms as controllers of atmospheric trace gases (H2, CO, CH4, OCS, N2O, and NO), Microbiol. Rev., 60,
609–640, 1996
Crutzen, P. J., Sanhueza, E., and Brenninkmeijer, C. A. M.: Methane production from mixed tropical savanna and forest veg-etation in Venezuela, Atmos. Chem. Phys. Discuss., 6, 3093– 3097, 2006,
http://www.atmos-chem-phys-discuss.net/6/3093/2006/. Frankenberg, C., Meirink, J. F., van Weele, M., Platt, U., and
Wag-ner, T.: Assessing methane emissions from global space-borne observations, Science, 308, 1010–1014, 2005.
Hao, W. M., Scharffe, D., Crutzen, P. J., and Sanhueza, E.: Produc-tion of N2O, CH4and CO2from soils in the tropical savannah
during the dry season, J. Atmos. Chem., 7, 93–105, 1988. Hanson, R. S. and Hanson, T. E.: Methanotrophic bacteria,
Micro-biol. Rev., 60, 439–471, 1996.
Keller, M. and Reiners, W. A.: Soil-atmosphere exchange of nitrous oxide, nitric oxide, and methane under secondary succession of pasture to forest in the Atlantic lowlands of Costa Rica, Global Biogeochem. Cycles, 8, 399–409, 1994.
Keppler, F., Hamilton, J. T. G., Brass, M., and Roeckmann, T.: Methane emissions from terrestrial plants under aerobic condi-tions, Nature, 439, 187–191, 2006.
Kirschbaum, M. U. F., Bruhn, D., Etheridge, D. M., Evans, J. R., Farquhar, G. D., Gifford, R. M., Paul, K. I., and Winters, A. J.: A comment on the quantitative significance of aerobic methane release by plants, Functional Plant Biology, 33, 521–530, 2006.
Koschorreck, M. and Conrad, R.: Oxidation of atmospheric methane in soil: measurements in the field, in soil cores and in soil samples, Global Biogeochem. Cycles, 7, 109–121, 1993. Mosier, A. R. and Delgado, J. A.: Methane and nitrous oxide fluxes
in grasslands in western Puerto Rico, Chemosphere, 35, 2059– 2082, 1997.
Mosier, A., Schimel, D., Valentine, D., Bronson, K., and Parton, W.: Methane and nitrous oxide fluxes in native, fertilized and cultivated grassland, Nature, 350, 330–332, 1991.
Mosier, A. R., Parton, W. J., Valentine, D. W., Ojima, D. S., Schimel, D. S., and Heinemeyer, O.: CH4and N2O fluxes in
the Colorado shortgrass steppe 2. Long-term impact of land use change, Global Biogeochem. Cycles, 11, 29–42, 1997.
Poth, M., Anderson, I. C., Miranda, H. S., Miranda, A. C., and Riggan, P. J.: The magnitude and persistence of soil NO, N2O,
CH4, and CO2 fluxes from burned tropical savanna in Brazil,
Global Biogeochem. Cycles, 9, 503–513, 1995.
Ramaswamy, V., Boucher, O., Haigh, J., Hauglustaine, D., Hay-wood, J., Myhre, G., Nakajima, T., Shi, G. Y., and Solomon, S.: Radiative forcing of climate change, in: Climate Change 2001. The Scientific Basis, Cambridge University Press, Cambridge, UK, 349–416, 2001.
Sanhueza, E., C´ardenas, L., Donoso, L., and Santana, M.: Effect of plowing on CO2, CO, CH4, N2O and NO fluxes from tropical
savannah soils, J. Geophys. Res., 99D, 16 429–16 434, 1994a. Sanhueza, E., Donoso, L., Scharffe, D., and Crutzen, J. P.: CO
fluxes from natural, managed or cultivated savannah grassland, J. Geophys. Res., 99D, 16 421–16 427, 1994b.
Scharffe, D., Donoso, L., Crutzen, P. J., and Sanhueza, E.: Soil Fluxes and atmospheric concentrations of CO and CH4in the
northern part of the Guayana shield, Venezuela, J. Gephys. Res., 95D, 22 475–22 480, 1990.
Seiler, W., Conrad, R., and Scharffe, D.: Field studies of methane emission from termite nests into the atmosphere and measure-ments of methane uptake by tropical soils, J. Atmos. Chem., 1, 171–186, 1984.
Striegl, R. G.: Diffusional limits to the consumption of atmospheric methane by soils, Chemosphere, 26, 715–720, 1993.
Zepp, R. G., Miller, W. L., Burke, R. A., Dirk, A., Parsons, B., and Scholes, M. C.: Effects of moisture and burning on soil-atmosphere exchange of trace carbon gases in a southern African savanna, J. Geophys. Res., 101, 23 699–23 706, 1996.