HAL Id: hal-02084519
https://hal.archives-ouvertes.fr/hal-02084519
Submitted on 16 May 2020
HAL is a multi-disciplinary open access
archive for the deposit and dissemination of sci-entific research documents, whether they are pub-lished or not. The documents may come from teaching and research institutions in France or abroad, or from public or private research centers.
L’archive ouverte pluridisciplinaire HAL, est destinée au dépôt et à la diffusion de documents scientifiques de niveau recherche, publiés ou non, émanant des établissements d’enseignement et de recherche français ou étrangers, des laboratoires publics ou privés.
to Mediterranean flash floods
M. Adamovic, F. Branger, Isabelle Braud, S. Kralisch
To cite this version:
M. Adamovic, F. Branger, Isabelle Braud, S. Kralisch. Development of a data-driven semi-distributed hydrological model for regional scale catchments prone to Mediterranean flash floods. Journal of Hydrology, Elsevier, 2016, Flash floods, hydro-geomorphic response and risk management, 541 (Part A), pp.173–189. �10.1016/j.jhydrol.2016.03.032�. �hal-02084519�
1
Development of a data-driven semi-distributed hydrological model for regional
1
scale catchments prone to Mediterranean flash floods
2
3
M. Adamovic1,2, F. Branger1, I. Braud1, S. Kralisch3
4
[1] Irstea, UR HHLY, Hydrology-Hydraulics Research Unit, Lyon-Villeurbanne, France 5
[2] CNRS-IRD, HydroSciences Laboratory, Place Eugene Bataillon, 34095 Montpellier, France
6
[3] Department of Geoinformatics, Hydrology and Modeling, School of Chemical and Earth 7
Sciences, Friedrich-Schiller-University, Jena, Germany 8
Correspondence to: M. Adamovic ([email protected]) 9
10
Abstract
11
Flash floods represent one of the most destructive natural hazards in the Mediterranean region. These 12
floods result from very intense and spatially heterogeneous rainfall events. Distributed hydrological 13
models are valuable tools to study these phenomena and increase our knowledge on the main 14
processes governing the generation and propagation of floods over large spatial scales. They are 15
generally built using a bottom-up approach that generalizes small-physics representations of 16
processes. However, top-down or data-driven approach is increasingly shown to provide also 17
valuable knowledge. A simplified semi-distributed continuous hydrological model, named 18
SIMPLEFLOOD, was developed, based on the simple dynamical system approach (SDSA) proposed 19
by Kirchner (WRR, 2009, 45, W02429), and applied to the Ardèche catchment in France (2388 km2). 20
This data-driven method assumes that discharge at the outlet of a given catchment can be expressed 21
as a function only of catchment storage. It leads to a 3-parameter nonlinear model according to 22
rainfall and runoff observations. This model was distributed over sub-catchments and coupled with a 23
kinematic wave based flow propagation module. The parameters were estimated by discharge 24
2
recession analyses at several gauged stations. Parameter regionalization was conducted using a 1
Factorial Analysis of Mixed Data (FAMD) and Hierarchical Classification on Principal Component 2
(HCPC) in order to find relationships between the SDSA approach and catchments characteristics. 3
Geology was found to be the main predictor of hydrological response variability and model 4
parameters were regionalized according to the dominant geology. The SIMPLEFLOOD model was 5
applied for a 12-year continuous simulation over the Ardèche catchment. Four flash flood events 6
were also selected for further analysis. The simulated hydrographs were compared with the 7
observations at 11 gauging stations with catchment size ranging from 17 to 2300 km2. The results 8
show a good performance of the model for the continuous and flash flood events occurring under wet 9
conditions, whereas the model underestimates discharge for events occurring after a long dry period. 10
The simple modelling approach provided interesting insight into the Ardèche catchment functioning 11
and offers perspective for a better simulation of flash floods, mainly under wet conditions. 12
13 14
3
1. Introduction
1
Catchments in the Mediterranean basin are prone to a large number of devastating events sometimes 2
followed with loss of life and high economic and social impact (Gaume et al., 2009). Due to its 3
geographic position with many surrounding mountains, the Mediterranean basin is usually exposed to 4
typical convective mesoscale systems leading to heavy precipitation and thus to flash floods. These 5
events occur especially during fall and winter periods as remarked by Borga and Morin (2014). In 6
addition to its specific position, the Mediterranean basin is also pointed out as one of the “hot-spots” 7
in future climate change predictions (Giorgi, 2006). This could lead eventually to more frequent and 8
more intense extreme events. The study of the water cycle in such Mediterranean conditions, as well 9
as a better understanding and modelling of processes triggering flash floods, are central research 10
topics for instance addressed in the HyMeX1 (Hydrological Cycle in the Mediterranean Experiment, 11
Drobinski et al. (2013)) program and in the FloodScale2 project (Braud et al., 2014), to which this 12
study contributes. 13
There are lots of operational models developed in order to deal with flash floods on the catchment 14
scale (up to hundreds of square kilometers). In Mediterranean context, many models such as 15
TOPMODEL (Beven, 2012) and its versions (Saulnier and Le Lay, 2009; Vincendon et al., 2010), 16
SCS based models (e.g. (Gaume et al., 2004; Sangati and Borga, 2009; Rozalis et al., 2010), 17
modeling approaches including infiltration excess and sub-surface flow such as the MARINE model 18
(Roux et al., 2011; Garambois et al., 2013), rainfall-runoff flash flood models based on Green-Ampt 19
infiltration method (Zanon et al., 2010), geomorphological approaches (Continuum model, Silvestro 20
et al., 2011; 2013), and runoff threshold methods (e.g. Gourley et al., 2014) have been used for flood 21
prediction of small to medium size basins. 22
1
www.hymex.org
4
As noted by Hapuarachchi et al. (2011) in their review of flash flood forecasting, even though there 1
are many existing models working on these scales, there is still no clear consensus which model is 2
preferable and which is not. In the regional scale catchments (some 1000 km2), models able to 3
simulate flash floods are poorly described or do not exist in the literature. 4
The approach developed in this study aims at providing increased knowledge of dominant 5
hydrological processes during flash floods in the Mediterranean context by combining data analysis 6
and distributed hydrological modeling. By better understanding dominant hydrological processes and 7
their drivers, this work could improve the models used operationally for flash flood forecasting and 8
warning, in particular in ungauged catchments, through a better integration of process knowledge in 9
model structure or parameters specification. In the context of Mediterranean flash floods caused by 10
intense and localized rainfall events, it is particularly important to take into account spatially 11
distributed rainfall (Sangati and Borga 2009; Anquetin et al., 2010; Tramblay et al. 2010; Zocatelli et 12
al., 2010). Therefore, distributed modeling approaches can be suited to flash flood simulations on 13
regional scale catchments. 14
Distributed hydrological models are generally built using a bottom-up approach (Sivapalan, 2003b; 15
Zehe et al., 2006), following the blueprint proposed by Freeze and Harlan (1969). These types of 16
models generalize small-physics representations of processes by using for example Darcy or 17
Richards’ equations (Bloschl and Sivapalan, 1995; Kirchner, 2006). Their use to describe processes at 18
larger scales leads to the calibration of “effective parameters” which are sometimes difficult to link 19
with measurable quantities (Sivapalan, 2003b). Recent methods showed that combining the use of 20
small-scale variability and regionalization techniques can be still efficient in preserving spatial 21
patterns of variability (Samaniego et al., 2010). Use of distributed hydrological models for process 22
understanding during flash floods in the Mediterranean region is more recent. Examples of such 23
studies are those of Bonnifait et al. (2009), Manus et al. (2009), Braud et al. (2010) and Vannier 24
(2013) which are based on a reductionist approach to gain insight into active hydrological processes 25
5
during floods and highlight a lack of data or parameter information. Other examples are also models 1
used to simulate landslides triggered by flash floods in the Mediterranean region (Bathurst et al. 2
2006; Frattini et al., 2009).
3
However, top-down or data-driven approach is increasingly shown to provide also valuable 4
knowledge. Klemeš (1983) was one of the first hydrologists proposing the use of this method. Top-5
down approach promotes a combination of data analysis and process conceptualization (Kirchner, 6
2009; Sivapalan, 2003b). The obtained models are simple and with a limited number of parameters 7
that can be estimated from the available data. The data-based approach proposed by Kirchner (2009) 8
is adopted in this study. It was successfully applied at several gauged stations during low vegetation 9
periods (November-March; Adamovic et al., 2015) in the Ardèche catchment, France. This data-10
driven method assumes that discharge at the outlet of a given catchment can be expressed as a 11
function of catchment storage only and determines a 3-parameter nonlinear model according to 12
rainfall and runoff and recordings. For developing distributed hydrological models, it will be essential 13
to identify links between the parameters and catchment characteristics, including physiographic and 14
hydro-climatic factors in order to regionalize the parameters since the Mediterranean catchments are 15
characterized by heterogeneous topography, vegetation and geology. 16
Catchment classification has been put forward as a useful tool to deal with high spatial, temporal and 17
process variability (McDonnell and Woods, 2004) and bring some harmony to the cacophony 18
presented in hydrology (Sivapalan, 2003a). Wagener et al. (2007) in their review of classification 19
techniques highlight how such a classification framework would contribute to understanding of how 20
catchment structure and climate region define catchment function pattern. The ultimate goal of 21
classification is to relate catchment structures to hydrologic response characteristics (Wagener et al., 22
2007) by combining catchment “form” (e.g. geologic characteristics) and climate forcing (Winter, 23
2001) and thus signatures of runoff response. Winter suggested that catchments with similar geology, 24
topography (slope) and climate regime would have similar flow paths regardless of the catchment 25
6
distance. In their review, Wagener et al. (2007) distinguished classification based on catchment 1
structure, classification based on hydro-climatic region and classification based on functional 2
response. In the last years in order to classify catchments, a significant contribution to this domain 3
has been made by using self-organizing maps (Herbst et al., 2008; Ley et al., 2011; Toth, 2013), 4
Bayesian clustering (Sawicz et al., 2011), local variance reduction method (He et al., 2011), Principal 5
Component (PCA) and Canonical Correlation Analysis (CCA) (Di Prinzio et al., 2011) and many 6
others. For instance Sawicz et al. (2011) used cluster analysis of runoff coefficients and slope of flow 7
duration curve to classify 300 catchments into 9 groups. Similarly, using four signatures (the aridity 8
index, the seasonality index, day of peak precipitation and day of peak runoff) Coopersmith et al. 9
(2012) showed that 300 catchments can be grouped into 6 classes. These works provided a glimpse of 10
the first order differences between catchments. Furthermore, Yaeger et al. (2012) in their work 11
pointed out that climate seasonality and aridity are the main controls of flow regime in the central part 12
of the flow duration curve. They argued that catchment characteristics such as soil represent dominant 13
control in the low-flow tail of the regime curve. All these works made a huge step forward in 14
distinguishing catchment characteristics as the drivers of simple hydrological process descriptions at 15
the catchment scale and will be further used in this study. 16
In this study, the SIMPLEFLOOD hydrological model is designed that provides a distributed and 17
data-driven modeling of regional scale catchments. The model is based on the simple dynamical 18
systems approach. It simulates and predicts hydrological behavior throughout the year, especially 19
during flash floods. Due to its simplicity the model is named SIMPLEFLOOD. 20
The study area is the Ardèche catchment (2388 km2), which is typical of Mediterranean catchments 21
with highly variable rainfall, steep slopes, and heterogeneous geology and pedology. It is one of the 22
studied catchments of the Cévennes-Vivarais Hydro-Meteorological Observatory (OHM-CV, 23
Boudevillain et al. (2011)). 24
7
In the present paper, focus is given on the following questions: 1/ how can the simple dynamical 1
system approach (SDSA) be translated into a distributed hydrological model concept in a 2
Mediterranean type catchment like the Ardèche with its particular conditions (size, climate, 3
geological and pedological heterogeneity)? 2/ what are the dominant predictors of hydrological 4
variability that can serve as a basis for parameter regionalization? 3/ what is the performance of such 5
a model, run without specific calibration, in reproducing observed discharge dynamics? 6
In Section 2, the model concepts and implementation is presented. The case study of the Ardèche 7
catchment and the available data are presented in Section 3. Section 4 deals with the model setup and 8
presents the methodology that is used to regionalize the parameters of the SDSA approach on 9
ungauged catchments. Finally, the simulation results for continuous simulations and selected major 10
flood events are presented in Section 5 and discussed in Section 6. 11
2. Model description
12
2.1 Simple dynamical systems approach-SDSA
13
Kirchner (2009) proposed a method for determining non-linear reservoir parameters for a simple 14
bucket model with the assumption that discharge Q can be expressed uniquely as a function of total 15
water storage S in the catchment. Many studies have been successfully conducted using this approach 16
(Teuling et al, 2010; Brauer et al., 2013, Melsen et al., 2014, Adamovic et al., 2015). They all had 17
good results in low-vegetation (i.e. when deciduous trees have lost their leaves) and wet periods. 18
The most important feature of the SDSA approach is the so called discharge sensitivity function g(Q). 19
It describes the sensitivity of discharge to changes in storage, as a function of discharge itself. This is 20
useful because discharge is directly measurable whereas whole-catchment storage is generally not, as 21
integrated approaches such as the use of gravity measurements, for instance using the GRACE 22
8
(Gravity Recovery And Climate Experiment) satellite data only provide estimates for large scale 1
catchments (Reager et al., 2009). 2
The g(Q) function is estimated during the periods when precipitation and actual evapotranspiration 3
are relatively small compared with discharge (Kirchner, 2009), obtaining the following equation, 4
which shows that under these conditions the discharge sensitivity function can be estimated from 5
discharge data alone: 6
(1)
7
where g(Q) is the sensitivity function, P is precipitation, AET is actual evapotranspiration, Q is 8
discharge, S is catchment water storage and dQ/dt is a rate of change of discharge over time (t). 9
More precisely, the sensitivity function g(Q) is estimated using discharge records from low-10
vegetation periods when vegetation and ET0 could be considered to have a smaller impact on stream 11
discharge (Adamovic et al., 2015). This is essential in order to have a robust g(Q) function where the 12
mass balance of the catchment is dominated by discharge and where the relationship is not distorted 13
by evapotranspiration. 14
This leads to the following expression in log space where an approximation using a quadratic 15
function is proposed: 16
(2)
17
where C1, C2 and C3 are parameters of a quadratic function on ln(-dQ/dt) versus ln(Q) plot (Kirchner, 18
2009). In the remaining of the paper, we will refer to those parameters as “recession parameters”, 19
although they are not estimated using all the recessions data, but only the values where P and AET 20
can be considered as negligible. 21
This method is simple enough so that it enables the derivation of a continuous rainfall-runoff 22
modelling approach, that can be applied for the whole time period and not only for the periods where 23
9
the g(Q) function has been estimated. This model is given by the following equation (Kirchner, 1 2009): 2 (3) 3
This equation is a first-order nonlinear differential equation used for discharge simulation directly 4
from P and AET time series. Discharge is computed using fourth-order Runge-Kutta integration, 5
iterating on an hourly time-step where a single value of measured discharge is used to initialize the 6
simulation. 7
To estimate the AET term in Eq. (3), it is assumed, in the present study, that actual evapotranspiration 8
is equal to potential evapotranspiration (PET) throughout the year, being defined as reference 9
evapotranspiration ET0 modulated by a monthly crop coefficient depending on the nature of 10
vegetation for each catchment. The strong hypothesis that AET=PET is likely to be more relevant in 11
winter, when there is sufficient water content in the air and soils, than in summer. Nonetheless this 12
assumption is used, even in summer, as a first rough approximation in order to assess the feasibility 13
of such a simple modeling concept. 14
2.2 Design and implementation of SIMPLEFLOOD
15
In order to combine the distributed modeling approach with the SDSA approach which is defined at 16
the catchment scale, the spatial modeling units chosen for SIMPLEFLOOD consist of sub-17
catchments. Climate forcing (precipitation and reference evapotranspiration) should be allocated to 18
each sub-catchment. Each sub-catchment must be homogeneous enough, consistently with the 19
Hydrological Response Unit (HRU) concept (Flügel, 1995), so that clear descriptors can be 20
identified. The size of the modeling units will be therefore constrained by the local climate 21
conditions, such as the typical spatial structure of storm events, and by the heterogeneity of the 22
geographic descriptors of the catchment, such as land use or geology. Runoff is generated on each 23
10
modeling unit according to the SDSA approach. In order to transfer the flow to the catchment outlet, 1
SIMPLEFLOOD also incorporates a routing algorithm in the river network. As not all the modeling 2
units are gauged, parameter regionalization will be necessary to distribute the parameter sets of the 3
g(Q) function derived on gauged sub-catchments when P and AET can be considered as negligible.
4
SIMPLEFLOOD was implemented in the JAMS modeling framework (Kralisch and Krause, 2006), 5
which is developed at the Department for Geoinformatics, Hydrology and Modeling of the Friedrich-6
Schiller-University Jena, in Germany. Like other modeling platforms, JAMS is able to integrate 7
numerous process components (modules) of the user’s choice, while providing support for non-8
hydrology-specific tasks such as data input/output management and runtime management. 9
The JAMS modeling framework contains already many implemented models such as the process-10
oriented model J2000 (Krause et al., 2006), water balance model J2000g (Krause and Hanisch, 2009), 11
process oriented nutrient transport model J2000s (Fink et al., 2007) and many components aimed at 12
land use management assessment. SIMPLEFLOOD reuses components from the J2000 model, while 13
incorporating a new component that implements the SDSA approach (see Figure 1). Thus 14
SIMPLEFLOOD consists of: 15
1. Parameter input and initialization 16
2. Climate forcing reading (ET0 and P) 17
3. Regionalization of climate data 18
4. Potential evapotranspiration (PET) calculation 19
5. Runoff production 20
6. Flow routing 21
Regionalization in Step 3 is based on the Inverse Distance Weightings (IDW) method like in the 22
J2000 model. The detail description of how this component works can be found in the JAMS wiki3. 23
3
11
The definition of the number of stations that are nearest to the particular sub-catchment and the 1
weightings of those n stations calculated via IDW dependently on their distances for each sub-2
catchment are taken into account. Regionalization is used for ET0 as shown in Table 1. For rainfall, 3
average rainfall at the scale of the sub-catchment was used as direct input of the model. 4
In step 4, it is assumed that PET= ET0 x Kc. In order to calculate potential evapotranspiration in 5
SIMPLEFLOOD model, values of reference evapotranspiration and crop coefficients are needed. 6
This is achieved by the redistribution of crop coefficient to each sub-catchment, according to landuse. 7
Then, a potential evapotranspiration is calculated at each time step and for each sub-catchment by 8
multiplying reference ET0 and the crop coefficient of the current month. 9
10
Model component Component description Input data and/or parameters
Parame
ter
in
p
u
t
EntityReader Reads sub-catchments and reaches
Reach and sub-catchment files Obtained by GIS pre-processing
LUReader Reads monthly crop
coefficient (Cr) according to the dominant land-use
Kc_1,Kc_2, …Kc_12 in file
GReader Reads “recession parameters” C1, C2 and C3 in file (obtained from g(Q) estimation and regionalization) Input Model initialization Reads the initial value of
discharge
Qinit (obtained as a specific
discharge at the catchment outlet)
Input TS input Reads time-series data P, ET0
ET0 regionalization Regionalize ET0 for each sub-catchment
n (number of stations), W
(weightings)
PET calculation Calculates PET for each sub-catchment
AET=PET= ET0 x Kc Runoff production Calculates discharge for each
sub-catchment
Qinit, C1, C2, C3, AET, P Flow routing Transfer the water from one
reach to the next one
Reach length (l), slope (α), width (b) and roughness (µ) Table 1. Input data and parameters for SIMPLEFLOOD
12
In step 5, the model outputs are the discharge time series at the outlet of each modeling unit (sub-1
catchment). These discharges are routed as inflow in each river reach in step 6. 2
The Reach routing component takes care of flow routing in the reach network using a variant of 3
kinematic wave approach and assuming rectangular channel geometry. In each reach, water velocity 4
is computed according to Strickler coefficient and then the water is passed to the next downstream 5
reach based on the velocity and length of the reach. The corresponding parameters are reach length, 6
slope, width and roughness. SIMPLEFLOOD runs at the hourly time step. 7
8
3. Case study
9
3.1 The Ardèche catchment
10
The Ardèche catchment is located in southern France. The catchment has an area of 2388 km², and 11
the Ardèche river itself has a length of 125 km. Elevation ranges from the mountains of the Massif 12
Central (highest point: 1681 m) in the northwest, to the confluence with the Rhone River (lowest 13
point: 42 m) in the southeast (Figure 2). 14
The main lithologies found in the Ardèche are schist, granite, and limestone. For a more detailed 15
geological description see Adamovic et al. (2015) and Naulet et al. (2005). Figure 3 shows the 16
geology of the Ardeche and surrounding area. 17
Among the land use types found in the Ardèche, forest dominates throughout the basin according to 18
the land use map derived by J. Andrieu (Univ. Nice) from Landsat 30m satellite images4. Forest is 19
represented by a mix of coniferous (27%), broadleaf (13%) and Mediterranean trees (17%). Shrubs 20
and bushes are also well represented in the catchment, occupying a significant portion of the area 21
(17%). Also significant areas of bare soil are distinguished in the central and southern part of the 22
4
13
Ardèche, as well as a few small urban areas and areas of early (e.g. carrots, celery, lettuce, radish, 1
peas) and late crops (e.g. spinach, eggplant, sugar beet). 2
There is a strong influence of the Mediterranean climate with seasonally heavy rainfall events during 3
autumn. Historical data show that these events usually lead to flash floods (Lang et al., 2002). Lang et 4
al. also comment on the relatively quick flow response (a couple of hours) to precipitation due to the 5
steepness of the upstream part of the catchment and presence of granitic and basaltic rocks. 6
The hydrological year consists mainly of two periods. There is a rainy season (September-February) 7
with maximum precipitation intensity in autumn, characterized by rainfall amounts greatly exceeding 8
reference evapotranspiration ET0 (calculated based on the SAFRAN reanalysis of Quintana-Seguí et 9
al. (2008)), and by high discharge. On the other hand, during the dry season (March-August), on 10
average ET0 is much larger than precipitation and runoff is low. 11
In the Ardèche basin there are numerous dams (Figure 2) built along the upstream Chassezac river, 12
and additional water input in the upstream Ardèche coming from the neighbourhood Loire catchment 13
(Montpezat hydropower plant). There are also numerous summer agricultural uptakes along the 14
Baume River. All this influences strongly the natural streamflow downstream. On Figure 2, thus 15
influenced and non-influenced gauging stations are distinguished. 16
3.2 Available data
17
In the Ardèche catchment, measurements of the hydrological state variables have mainly been started 18
in the 1960s for the purpose of flood forecasting. In this study, hourly data of precipitation (P), 19
reference evapotranspiration (ET0) and discharge (Q) from the period 1 Jan 2000 until 31 Dec 2012 20
are used. 21
Discharge data come from operational networks, and not from research catchments as in previous 22
applications of the SDSA as already discussed in Adamovic et al. (2015). They are obtained from the 23
national Banque Hydro website (www.hydro.eaufrance.fr) and Electricité de France 24
14
(www.france.edf.com/). Figure 2 and Table 2 present the data that were used in this study. Criteria for 1
the selection of stations were the availability of data for the above mentioned time frame, and 2
sufficient quality of stations and rating curves, as indicated by data managers. In particular, stations 3
that presented bad low flow quality are discarded (due either to undocumented agricultural uptakes or 4
very uncertain low flow rating curves) in order to compare the model output with more reliable water 5
balance estimates. For dam-influenced downstream gauging stations of the Ardèche River, ”natural” 6
or partially dis-influenced time series could be reconstructed at the daily time step in the framework 7
of the Floodscale project (Noël, 2014). At the hourly time step, it is considered that the influence of 8
dams is negligible during flood events when it is overflowing and releasing the water. On another 9
side, the daily turbine flows of the Chassezac dams were not available, making the dis-influence 10
calculations downstream of Chassezac river only partial (see Table 2). When these data are available, 11
a much more precise and general picture about water balance in the Ardèche can be assessed. 12
No Station name Catchment
area (km²) Station alt. (m) Influenced by dam operations 1 Ardèche at Meyras 98 318 No 2 Borne at Nicoulaud 62.7 617 No 3 Thines at Gournier 16.7 415 No 4 Altier at Goulette 103 628 No
5 Ardèche at Pont-de-Labeaume 292 295 Yes
6 Ardèche at Ucel 477 203 Yes
7 Ardèche at Vogue 623 143 Yes
8 Baume at Rosieres 210 148 partial
9 Chassezac at Gravieres 557 165 Yes
10 Ardèche at Vallon-Pont-d’Arc 2023 77 partial
11 Ardèche at Sauze-Saint-Martin 2257 46 partial
12 Auzonnet at Mages 49 355 No
Table 2- Presentation of the considered discharge gauging stations; stations used for parameter 13
regionalization are highlighted in bold 14
SAFRAN precipitation reanalysis of Météo-France, based on 8 by 8 km2 grids (Quintana-Seguí et al., 15
2008; Vidal et al., 2010) were used in this study. Data are derived using the results of a 16
meteorological model that are constrained using existing Météo-France rain gauges. To compute the 17
reference evapotranspiration ET0, the climate variables of the SAFRAN reanalysis of Météo-France at 18
15
an hourly time step were also used. ET0 is calculated using the Penman-Monteith formula according 1
to FAO recommendations (Allen et al., 1998). Four major rainfall events were selected and looked at 2
in more detail as presented in Section 3.3. 3
In the study, the BD CARTHAGE® database of drainage network (Figure 2) is used. Table 2 presents 4
the 11 sub-catchments in the Ardèche that are included in this study plus additional non-disturbed 5
catchment (#12) located in a limestone area. For non-influenced stations (in bold in Table 2) 6
topographic variables using a 25-m resolution DEM and TAUDEM tool 5.2 (Tarboton, 1997) were 7
computed in ARCGIS 10.2 software. Five variables such are: (i) drainage area; (ii) average altitude; 8
(iii) average slope; (iv) channel length; and (v) drainage density were calculated. These variables are 9
used in regionalization analysis and are presented in Section 4. 10
3.3 Selected flash flood events
11
Four major events occurring during the 2000-2012 period were selected in this study. Figure 4 12
presents the events cumulated rainfall, averaged over the SIMPLEFLOOD model mesh (see section 13
4.2 for the model set up). 14
The December 2003 flood event produced the maximum peak flow of the examined period (2000-15
2012) of 2960 m3/s at the Sauze-Saint-Martin station (#9). The event lasted a couple of days (from 16
30/11 until 04/12) with maximum intensities reached on second and third December 2003. The event 17
produced high flows at Ardèche at Vogue (#7) with maximum observed discharge of 1120 m3/s. 18
During this event it rained over the whole Ardèche (average accumulation of 285 mm). 19
Two important successive precipitation extreme events occurred in the Ardèche catchment at the end 20
of October (average catchment accumulation of 165 mm) and beginning of November 2008 (rainfall 21
accumulation of 260 mm). The first event occurred between the 19th and 23rd of October reaching its 22
maximum intensities on October 21st and 22nd. The cumulative precipitation of this five days event is 23
spatially variable across the Ardèche catchment with maximum precipitation in the central part of the 24
16
catchment. The second event occurred some days after, more precisely between 31/10/2008 and 1
06/11/2008 with maximum intensities on November 1st and 2nd. It generated large precipitation 2
accumulations over localized areas in the north-west and south-west of the Ardèche mountain ridges. 3
This seven day event lasted longer than the previous one with maximum precipitation amount of 600 4
mm, recorded in the local station Altier. A maximum discharge of 2450 m3 s-1 on November 2-nd was 5
recorded at the Sauze-Saint-Martin station (#12). 6
In November 2011, a significant precipitation accumulation occurred in the Ardèche catchment over 7
the mountainous areas in the western part of the catchment (average accumulation of 375 mm). This 8
event occurred between 1st and 6th of November 2011 with maximum precipitation recorded on 9
November 3rd and 4th in the upstream catchments. The event produced high flows along the Ardèche 10
and Chassezac rivers with flow of 1860 m3/s at the catchment outlet. 11
Figure 5 shows the measured instantaneous specific peak discharge as function of catchment area for 12
the four selected events. The figure shows that the hydrological response was quite similar at all 13
scales for the December 2003 event with specific peak discharge of about 2 m3 s-1 km-2 for 14
catchments size ranging from about 20 to 2000 km2. The October 2008 event is less intense at small 15
scales, due to rainfall heterogeneity, but maximum specific peak discharge is larger than 1 m3 s-1 km-2 16
at the outlet and in medium sized catchments. Finally the November 2008 and 2011 events follow 17
more classical patterns with higher values of specific peak discharge for smaller catchments and a 18
general decrease when catchment size increases. In all cases, the increase of discharge at the outlet 19
occurring in less than 24 hours and the range of specific discharge clearly show that these events are 20
flash floods as defined by Gaume et al. (2009) or Braud et al. (2014). 21
17
4. Parameter regionalization, model set up and evaluation
1
4.1 Parameter regionalization using the FAMD and HCPC classification
2
The parameters for which a regionalization method was applied are the three “recession parameters” 3
C1, C2 and C3 for which estimations are available at the gauged catchments and for which a value is 4
required for each modelling units. Several explanatory factors, detailed in section 4.1.3 were used to 5
achieve this regionalization. 6
4.1.1 Selection of the regionalization method
7
Classification techniques were shown to be efficient in providing information about catchment
8
functioning. In this analysis the different types of variables related to catchment structure, to
9
catchment hydro-climatic conditions and to catchment functioning are retained in order to find
10
relationships between those variables and recession parameters.
11
As will be shown more in details later, this led to define both quantitative variables (such as
12
catchment area, slope or altitude) and qualitative variables (geology, landuse). Quantitative variables
13
are generally dealt with using Principal Component Analysis (PCA), whereas categorical variables
14
are handled using Multiple Correspondence Analysis (MCA). For mixed data, and in order to use as
15
much as possible all the available information Factor Analysis of Mixed Data (FAMD) was
16
introduced (e.g. Pagès (2004)). FAMD analyses are preferable and appropriate in two cases as Pagès
17
(2004) suggested:
18
Case study when there are a few qualitative variables compared with quantitative ones 19
Case study when the number of individuals is low (less than 100). 20
As those two conditions are fulfilled in this case study, FAMD is retained as an appropriate method in
21
the analysis. To enhance FAMD results, a Hierarchical Clustering of Principal Components was
22
further applied.
18
4.1.2 Principles of the FAMD
1
Principles of Factor Analysis of Mixed Variables are described in Pagès (2004). A simplified
2
description can be found in Wikipedia5.
3
In the analysis, the representation of individuals is made directly from factors as a projection on the
4
first two dimensions. The representation of quantitative variables is constructed as in PCA
5
(correlation circle). The representation of the categories of qualitative variables is as in MCA: a
6
category is at the centroid of the individuals who possess it. One of the important indicators that
7
gives the quality of representation of a variable (e.g. slope) is cos2. It is measured by the squared
8
cosines between the vector issued from the variable position and its projection on the axis (Le et al.,
9
2008) where values close to 1 mean that the variable is well projected.
10
After the FAMD analysis is conducted, the classification of individuals is then established using a
11
hierarchical classification on principal components (HCPC), i.e. using individual coordinates on
12
principal components as a basis for classification. The HCPC method enables to classify the
13
individuals into homogeneous groups (Ward criteria). Usually it is used as complement to factor
14
analyses. The algorithm groups the closest individuals on the factorial map in pairs, then aggregates
15
the closest groups in pairs until reaching the proposed level of clustering.
16
Eventually, having defined the groups of individuals, the next step in analysis is to test whether the
17
individual varies according to each homogeneous area. This is achieved by analyzing the variance
18
(one-way ANOVA) to test for significant differences in catchments between each determined
19
group/cluster. All statistical analyses (FAMD, HCPC) were performed with R programing language
20
using the FactoMineR package6.
21
5 https://en.wikipedia.org/wiki/Factor_analysis_of_mixed_data 6
19
4.1.3 Application to our case study
1
The FAMD was applied to the four gauged sub-catchments in the Ardèche already studied in
2
Adamovic et al. (2015) and the Auzonnet catchment located nearby (see Figure 3). This catchment
3
was also sampled for the analysis since it is located on different geological conditions (limestones)
4
and there is no dam that disturbs its water balance as in Ardèche. It drains an area of 49 km2 and is
5
predominantly characterized by different types of sedimentary rocks. Recession analyses were also
6
successfully applied there (see Adamovic, 2014).
7
In order to increase the number of individuals, parameters estimated in different vegetation growth
8
conditions were taken into account. These conditions include all year periods, low-vegetation and
9
vegetation 2000-2008 periods. Vegetation periods include the periods between 1 of April and 30 of
10
October of each year. Low-vegetation periods include the time frame between 1 of November and 31
11
of March.
12
Five groups of explanatory predictor variables were used: topographic variables ((i) area; (ii)
13
average altitude; (iii) Strahler number; (iv) average slope; (v) drainage density; and (vi) total
14
channel length), land use, geology, meteorological variables ((i) runoff coefficient C, (ii) ratio of
15
potential evapotranspiration (KcET0) and precipitation PET/P, and (iii) mean annual precipitation
16
Pavg for all year, vegetation and low-vegetation period between 2000-2008), and recession
17
parameters (C1, C2, C3) as explained estimated variables. The factors used as explanatory variables
18
act as a fingerprint of the catchment since they incorporate many aspects of runoff generation controls
19
such as soils, geology, topography and land use, and hydro-climatic characteristics.
20
Three main land-use combination types were selected as predictor variables for FAMD analysis based
21
on their predominance (dominance of first two land-use types):
22
1. CM- Coniferous-Mediterranean forest predominance 23
2. CS- Coniferous-Shrubs predominance 24
20 3. CLC- Coniferous-Late crops predominance 1
The dominant geologies were categorized as granite, schists/basalts and limestone. The final set of 3
variables used in this study is presented in Table 3. 4
It can be noted that topographic variables along with geology and land use will not change among the
5
data sets. In order to constrain the conflicts that might appear in the statistical analysis; these
6
variables are kept as explanatory ones and other variables were kept as active.
7
21
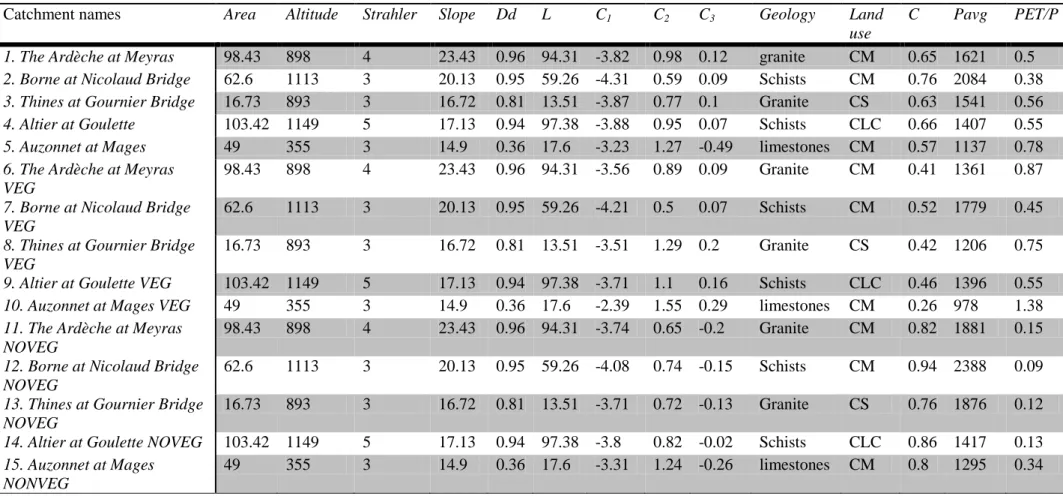
Catchment names Area Altitude Strahler Slope Dd L C1 C2 C3 Geology Land
use
C Pavg PET/P 1. The Ardèche at Meyras 98.43 898 4 23.43 0.96 94.31 -3.82 0.98 0.12 granite CM 0.65 1621 0.5
2. Borne at Nicolaud Bridge 62.6 1113 3 20.13 0.95 59.26 -4.31 0.59 0.09 Schists CM 0.76 2084 0.38
3. Thines at Gournier Bridge 16.73 893 3 16.72 0.81 13.51 -3.87 0.77 0.1 Granite CS 0.63 1541 0.56
4. Altier at Goulette 103.42 1149 5 17.13 0.94 97.38 -3.88 0.95 0.07 Schists CLC 0.66 1407 0.55
5. Auzonnet at Mages 49 355 3 14.9 0.36 17.6 -3.23 1.27 -0.49 limestones CM 0.57 1137 0.78
6. The Ardèche at Meyras VEG
98.43 898 4 23.43 0.96 94.31 -3.56 0.89 0.09 Granite CM 0.41 1361 0.87
7. Borne at Nicolaud Bridge VEG
62.6 1113 3 20.13 0.95 59.26 -4.21 0.5 0.07 Schists CM 0.52 1779 0.45
8. Thines at Gournier Bridge VEG
16.73 893 3 16.72 0.81 13.51 -3.51 1.29 0.2 Granite CS 0.42 1206 0.75
9. Altier at Goulette VEG 103.42 1149 5 17.13 0.94 97.38 -3.71 1.1 0.16 Schists CLC 0.46 1396 0.55
10. Auzonnet at Mages VEG 49 355 3 14.9 0.36 17.6 -2.39 1.55 0.29 limestones CM 0.26 978 1.38
11. The Ardèche at Meyras NOVEG
98.43 898 4 23.43 0.96 94.31 -3.74 0.65 -0.2 Granite CM 0.82 1881 0.15
12. Borne at Nicolaud Bridge NOVEG
62.6 1113 3 20.13 0.95 59.26 -4.08 0.74 -0.15 Schists CM 0.94 2388 0.09
13. Thines at Gournier Bridge NOVEG
16.73 893 3 16.72 0.81 13.51 -3.71 0.72 -0.13 Granite CS 0.76 1876 0.12
14. Altier at Goulette NOVEG 103.42 1149 5 17.13 0.94 97.38 -3.8 0.82 -0.02 Schists CLC 0.86 1417 0.13
15. Auzonnet at Mages NONVEG
49 355 3 14.9 0.36 17.6 -3.31 1.24 -0.26 limestones CM 0.8 1295 0.34
Table 3- Topographical, meteorological and recession variables used in the FAMD analysis for 5 examined catchments during all years, low-vegetation and low-vegetation period. Estimated variables are the C1, C2 and C3 parameters. The other variables are the quantitative and qualitative
22
4.1.4 Results of FAMD
1
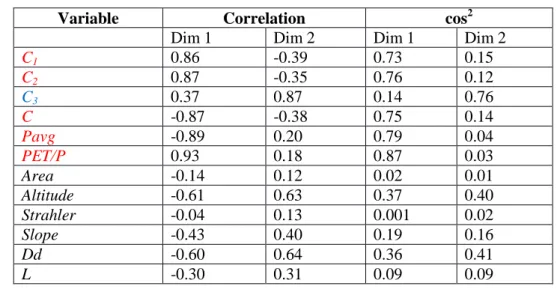
The FAMD applied to data set used in this study shows two dimensions that explain about 2
88% of the variance of the data set (Figure 6). Figure 6 and Table 4 show also the projections 3
of the quantitative variables on these two dimensions and the performance indicators for these 4
projections, respectively. Variables C1, C2 are well correlated to the first dimension, as well as 5
variables PET/P and Pavg. It seems like this dimension opposes individuals (catchments) that 6
are more humid / vs dry. Variable C3 is correlated to the second dimension. Drainage density 7
and altitude seem to be somehow correlated to dimension 2 as well, but this is not so clear. 8
The correlation of qualitative variables can be visualized on factor maps such as Figure 7, 9
where the individuals (catchments) are colored according to their defining qualitative variable 10
(here geology). It can also be observed that catchments cannot be separated according to the 11
land use due to its proximity on the two axes. 12
However, it can be seen that the groups of catchment are quite separated from one another, 13
and that it is particularly striking for the limestone geology. In addition, geology appears to be 14
the only qualitative variable significantly associated with a dimension. Variance analysis 15
shows that 44% of the variance of the coordinates on dimension 2 is explained by geology. 16
HCPC according to the principal components reinforces the interpretation of geology being a 17
key parameter. An optimum of four clusters was found. The hierarchical clustering tree of the
18
examined catchments grouped according to their belonging cluster is shown in Figure 8. It can 19
be seen that the clusters mostly follow geological characterization as shown in Figure 7. This 20
is confirmed by a X² test, that shows again that geology is the only significant variable linked 21
to the clusters with p=0.01058961. 22
From this analysis, thus it can be concluded that geology is the main driving factor of 23
hydrological variability, and that the recession parameters can be distributed according to the 24
dominant geology in the SIMPLEFLOOD model. 25
23 1
Variable Correlation cos2
Dim 1 Dim 2 Dim 1 Dim 2
C1 0.86 -0.39 0.73 0.15 C2 0.87 -0.35 0.76 0.12 C3 0.37 0.87 0.14 0.76 C -0.87 -0.38 0.75 0.14 Pavg -0.89 0.20 0.79 0.04 PET/P 0.93 0.18 0.87 0.03 Area -0.14 0.12 0.02 0.01 Altitude -0.61 0.63 0.37 0.40 Strahler -0.04 0.13 0.001 0.02 Slope -0.43 0.40 0.19 0.16 Dd -0.60 0.64 0.36 0.41 L -0.30 0.31 0.09 0.09 2
Table 4- Correlation and cos2 values for the examined variables (in red: the variables that are 3
well projected on the first dimension, in blue: the variables that are well projected on the 4
second dimension) 5
4.2 Model set up
6
The Ardèche catchment was discretized in sub-catchments with a 10 km² threshold, which is
7
the typical size of convective autumn events and is also consistent with the 8x8 km2 resolution
8
of the SAFRAN data. It resulted into 238 modelling units. For each modelling unit, a
9
dominant land use and dominant geology were attributed according to classification presented
10
in Sec 4.1, see Figure 9. The river network was discretized into 238 reaches as well, with
11
average channel length of the sub-catchment being 3.52 km with average channel slope of 3.6
12
%.
13
For precipitation input, the weighted average of the overlying SAFRAN cells for each
sub-14
catchment is used. Reference evapotranspiration, ET0 was calculated from SAFRAN variables
15
using the Penman-Monteith equation. The closest SAFRAN cell to the centroid of
sub-16
catchment was selected. These climate forcings present input in the model (TS input) as
17
shown in Figure 1.
24
Monthly values for the crop coefficient were determined for each land use according to the
1
FAO database (Allen et al., 1998)). They are used as multiplier to ET0 as shown in Figure 1.
2
In Table 5, the minimum and maximum values for each land-use type are shown.
3
ID Land-use type Kc min Kc max
1 Water 1.05 1.05 2 Coniferous Forest 1 1,2 3 Broadleaf Forest 0.74 0.97 4 Mediterranean Forest 1 1.18 5 Urban Areas 1 1 6 Bare Soil 0.3 0.3 7 Early Crops 0.57 1.09 8 Late Crops 0.53 1.14
9 Heath and Shrubs 0.5 1.1
Table 5- Crop coefficient values for respected land-use types 4
Recession parameters were distributed according to dominant geology as discussed in 5
previous section. They are given in Table 6. 6
ID C1 C2 C3
1 (granite) -3.71 0.72 -0.13
2 (schists) -3.8 0.82 -0.02
3 (limestone) -3.31 1.24 -0.26
Table 6- Geology input recession parameters in SIMPLEFLOOD 7
They were estimated from 5 gauged-catchments from low-vegetation of the 2000-2008 8
period (Adamovic et al., 2015). Then, the g(Q) function is used for continuous discharge 9
simulation over the 2000-2012 period. In this time series, the high-vegetation periods and 10
2009-2012 period can be considered as a validation period. 11
The flow routing scheme implemented in the model assumes simplified rectangular channel 12
bathymetry and thus requires only 4 parameters. Width (b) was set manually according to 13
topographical surveys, rough channel width estimations using Google Earth images, and the 14
Strahler order. The width of the rivers found in the catchment ranged from 1 m to 97 m, with 15
the largest width being on the Ardèche River slightly upstream from the catchment outlet. 16
The roughness coefficient (µ) was set at a uniform value of 30, which is a typical value for 17
natural semi-mountainous streams and corresponds also to the calibrated value obtained with 18
25 a 1D hydrodynamic model that was previously set up on the same catchment (Doussiere, 1
2007). Reach length (l) and slope (α) are product of GIS analysis. 2
The model was run with different initial discharge conditions in order to define the warm-up 3
period. Eventually, year 2000 is chosen as an initial warm-up period and thus was excluded 4
from further evaluation analysis (see Adamovic, 2014). 5
4.3 Evaluation criteria
6
To assess model efficiency, Nash-Sutcliffe efficiency and percent bias are used as model 7
evaluation criteria for discharge simulations. Nash-Sutcliffe efficiency, NSE (Nash and 8
Sutcliffe, 1970) is used as a dimensionless model evaluation statistic indicating how well the 9
simulated discharges fit the observations. The NSE as to emphasize the high flows is 10
computed as shown in the following equation: 11 (4) 12
where is the i-th observation of discharge data, is the simulated discharge value for i-13
th time step, is the mean of all observed data and n represents the number of 14
observations. 15
NSE values range between −∞ and 1.0, with 1 representing the optimal value (see Moriasi et 16
al., 2007, for a recent review of performance criteria). NSE on the logarithm of the discharge 17
is also computed to give less weight to the peaks. For continuous simulation, NSE can be 18
calculated at the hourly time step, because the dam operations influence on peaks can be 19
neglected. However, logNSE can be calculated only at the daily time step, for which the dis-20
influenced data could be estimated. While NSE is calculated for continuous and event based 21
simulations, logNSE is calculated only for continuous simulations. 22
In addition, percent bias (PBIAS) was calculated as a part of the model evaluation statistics. It 23
measures total volume difference between two time series, as Eq. (5) indicates: 24
26 (5) 1
where is the ith observation of discharge data, is the simulated discharge value for the 2
ith time step, n represents the number of observations and 100 converts the result to percent. 3
The optimal value of PBIAS is 0.0 where positive values indicate model overestimation bias, 4
and negative values indicate model underestimation bias (e.g. Gupta et al., 1999). Again, in 5
this case, PBIAS can be calculated only at the daily time step for continuous simulation in 6
order to remove the influence of dam operations on observed streamflow. 7
RMSE represents one of the most used error index statistics (Singh et al., 2004;Vazques-8
Amabile and Engel, 2005). In the literature usually it is considered that the lower RMSE the 9
better the model performance. The area-weighted root mean square error (NRMSE) is used to 10
determine how closely values match one another while taking into account a normalization 11
factor – area. In that way an adequate comparison across catchments can be provided. 12
Singh et al. (2004) proposed a so-called RSR model evaluation indicator that is RMSE based 13
on the observations standard deviation in order to better quantify a low RMSE. RSR 14
standardizes RMSE using the observations standard deviation (Moriasi et al., 2007). It is 15
calculated according to the following equation: 16 (6) 17
where is the i-th observation of discharge data, is the is the simulated discharge value 18
for i-th time step, is the mean of all observed data and n represents the number of
19
observations. 20
RSR includes the benefits of error index statistics along with scaling factor (Moriasi et al., 21
2007). Optimal value of RSR is 0 which means zero residual variation and good model 22
27 simulation whereas positive values indicate not so good modeling performance. RSR is 1
calculated only for continuous based simulations at hourly time step. 2
5. Results
3
The SIMPLEFLOOD model was run continuously for the period 2000-2012. Evaluation was 4
performed on a continuous and event-based approach. No parameter calibration was done in 5
the results presented below. 6
5.1 Continuous simulations
7
A performance map with NSE calculated at hourly time step is shown on Figure 10. Good 8
efficiencies were obtained for almost all examined catchments except for catchment #3. More 9
precisely, downstream catchments (#10 and #11) showed NSE values of 0.76 and 0.75 10
respectively. 11
PBIAS values are also shown in Figure 10 at a daily time step. An underestimation tendency 12
of the discharge is observed for almost all of the examined stations except for catchment #3 13
where a high overestimation (over 50%) is detected. Using the natural discharge data for 14
influenced stations, PBIAS values become certainly more realistic than if measured discharge 15
had been used, although a general volume underestimation is still observed. 16
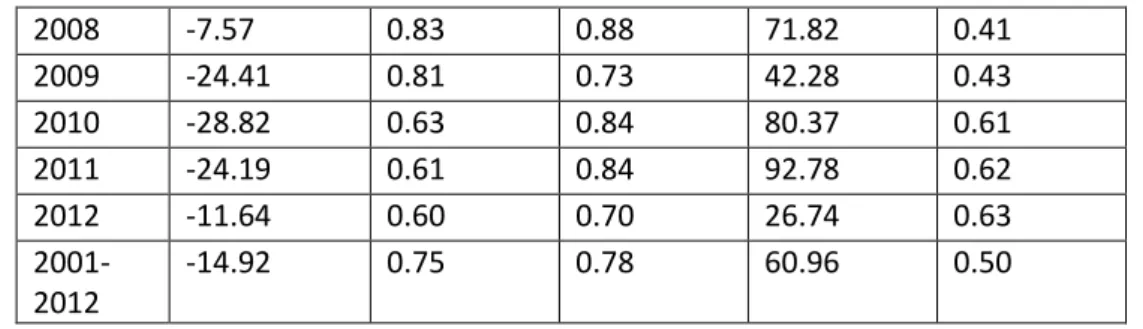
Table 7 gives the complementary information on modeling performance for the catchment 17
outlet (#11). Yearly modeling performance is given separately in addition to the entire 18
simulation period, so that evaluation whether some years are better simulated than others can 19
be done. Year 2002 displays the best simulation in terms of discharge dynamics, with a NSE 20
of 0.75, NSE on log of discharge of 0.78 and the bias compared with naturalized discharge of 21
–15 %, which shows that the simulation underestimated the total volume discharged from the 22
catchment by a certain amount. 23
28 Good simulation of discharge dynamics based on high NSE and high NSElog also occurred 1
for the simulations of years 2001, 2003, 2004, 2006, 2008-2012. Although good NSE were 2
seen in these years, similarly to 2002, the model bias for volume discharged was higher. 3
Generally, in all years the model underestimated the discharge. Years when the model 4
performed poorly occurred in 2005 and 2007, with NSE less than 0.28 and a high 5
underestimation of the volume discharged especially in year 2005 (30%). If the RSR is looked 6
at, it can be seen that these years represent dry years with the values approaching almost 1. 7
This is well illustrated in Figure 11 that shows observed and simulated hydrograph for station 8
#1 in year 2005. It can be seen that the model underreacts to all events. This is a common 9
trend seen in our hydrological modelling and could be due to the increased influence of some 10
other processes during dry years such as evapotranspiration, drainage, and groundwater flow, 11
that are not taken into account in the model. 12
Table 8 shows the summary of modelling performance for all the stations in the Ardèche 13
catchment. According to Moriasi et al. (2007), hydrological simulations can be regarded as 14
“satisfactory” if NSE>0.50, RSR<0.70, and if PBIAS is ± 25% for discharge. Table 8 shows 15
that for the majority of stations, satisfactory behavior is obtained except for catchments #4 16
and #9 where the BIAS was higher/lower than recommended and catchment #3 where NSE, 17
PBIAS and RSR were unsatisfactory. Furthermore, by comparing normalized RMSEs it is 18
noticed that almost all the catchments have the similar values except for catchment #3 where 19
NRMSE was around 0.13. 20
Year PBIAS (%) NSE NSE_log RMSE
(m3/s) RSR 2001 -1.69 0.72 0.76 44.92 0.53 2002 -3.23 0.85 0.80 52.82 0.39 2003 -18.60 0.82 0.80 78.35 0.42 2004 -5.74 0.74 0.81 61.39 0.51 2005 -30.53 0.23 0.54 43.06 0.88 2006 -21.89 0.66 0.83 65.10 0.58 2007 5.57 0.28 0.44 32.48 0.85
29 2008 -7.57 0.83 0.88 71.82 0.41 2009 -24.41 0.81 0.73 42.28 0.43 2010 -28.82 0.63 0.84 80.37 0.61 2011 -24.19 0.61 0.84 92.78 0.62 2012 -11.64 0.60 0.70 26.74 0.63 2001-2012 -14.92 0.75 0.78 60.96 0.50
Table 7- Modeling performance for the Ardèche at Sauze Saint-Martin (#11) catchment 1
No Station name NSE NSElog PBIAS NRMSE RSR
1 Ardèche at Meyras 0.66 0.79 -12 0.05 0.58 2 Borne at Nicoulaud 0.64 0.60 -27 0.07 0.60 3 Thines at Gournier -1.05 0.65 83 0.13 1.43 4 Altier at Goulette 0.60 -0.96 -40 0.04 0.63 5 Ardèche at Pont-de-Labeaume 0.63 0.46 -15 0.05 0.61 6 Ardèche at Ucel 0.68 -0.10 -29 0.04 0.57 7 Ardèche at Vogue 0.68 0.70 -18 0.04 0.56 8 Baume at Rosieres 0.61 0.53 -32 0.04 0.62 9 Chassezac at Gravieres 0.56 -1.4 105 0.03 0.66 10 Ardèche at Vallon-Pont-d’Arc 0.76 0.65 -13 0.03 0.49 11 Ardèche at Sauze-Saint-Martin 0.75 078 -15 0.03 0.50
Table 8- Summary of modeling performance in the Ardèche catchment 2
5.2 Event based simulations
3
In this section, discussion about the performance of SIMPLEFLOOD for the event based 4
simulations of 2003, 2008 and 2011 flood events is given. 5
The modeling performance indicators for the examined catchments are given in Table 9. 6
These results are based on hourly averages and not on instantaneous peak discharge values. 7
The catchment behavior varies from event to event giving good NSE and BIAS values for 8
October 2003 and November 2008 event for all catchments except catchment #3 (December 9
2003 event) and catchments #3 and #4 and to a lesser extent catchment #8. For the December 10
2003 event it can be observed that there is around 23 % less water that enters the system 11
(catchment #7) from upstream Ardèche that will eventually be one of the reasons for the 12
hydrograph underestimation at the catchment outlet (Figure 12).These two events occur in wet 13
conditions following significant rainfall in the previous period whereas the October 2008 and 14
30 November 2011 are associated with dry previous conditions (not shown). These two events 1
show high PBIAS, with a general tendency to underestimate discharge. Figure 12 shows the 2
comparison of simulated and observed hydrograph at the catchment outlet. The November 3
2008 event is best simulated whereas two other events (October 2008 and November 2011) 4
show high discharge underestimation. In addition, Figure 13 gives a comparison of the 5
observed and simulated peak discharge for selected events and examined catchments. The 6
SIMPLEFLOOD model shows overall good performance with R2 of 0.74, but a tendency to 7
underestimate the highest values, except for the November 2008 event. 8
Oct. 2003 Oct. 2008 Nov. 2008 Nov. 2011
No Station name NSE PBIAS NSE PBIAS NSE PBIAS NSE PBIAS
1 Ardèche at Meyras 0.56 26 <0.1 1.2 0.64 25 <0.1 -50 2 Borne at Nicoulaud 0.69 6 <0.1 >100 0.86 -15 <0.1 -44 3 Thines at Gournier <0.1 1.9 <0.1 >100 <0.1 >100 <0.1 -57 4 Altier at Goulette 0.40 -37 <0.1 -82 <0.01 -49 <0.1 -72 5 Ardèche at Pont-de-Labeaume 0.76 -1.5 0.30 49 0.61 7.5 <0.1 -54 6 Ardèche at Ucel 0.83 -12 0.39 -44 0.60 1 <0.1 -52 7 Ardèche at Vogue 0.70 -23 0.24 -54 0.72 6 <0.1 -55 8 Baume at Rosieres 0.63 12 <0.1 >100 0.25 28 <0.1 46 9 Chassezac at Gravieres 0.86 6 0.60 24 0.80 -2 <0.1 -55 10 Ardèche at Vallon-Pont-d’Arc 0.74 -23 0.48 -40 0.94 7.5 0.04 -54 11 Ardèche at Sauze-Saint-Martin 0.65 -29 0.48 -44 0.91 -1 0.05 -59
Table 9- Performance indicators at the examined catchments for SIMPLEFLOOD model for 9
2003, 2008 and 2011 flood events. 10
31
6. Discussion
1
In order to construct the SIMPLEFLOOD model several preexisting components from the 2
JAMS repository were used as a part of the model structure (components for creation of 3
modeling units, for input data, climate forcing regionalization and flow routing), which 4
facilited the model design. Spatial discretization in sub-catchments was done with a size 5
compatible with the catchment heterogeneity and rainfall spatial variability. The discretization 6
of 10 km2 appears to be adequate in this case along with use of SAFRAN rainfall data which 7
has a coarse resolution 8x8 km2. Other distributed rainfall products are also available on a 1-8
km2 grid (see below). Since high resolution rainfall is recommended in the study of flash 9
floods (Borga et al., 2008), it would be interesting to test the model performance using these 10
rainfall products. Such a study would also require a sensitivity analysis of models’ results 11
with regards to catchment discretization in order to see if a finer model discretization is 12
required to really benefit from the 1 km2 resolution radar data. 13
In this study, only the SAFRAN reanalyses are used as rainfall input. The gridded SAFRAN 14
product has been shown to underestimate precipitation especially in mountainous areas and 15
underestimates the occurrence of strong precipitation (P > 20 mm day−1 (Quintana-Seguí et 16
al., 2008; Vidal et al., 2010). Adamovic et al. (2015) also showed that rainfall correction at 17
the annual scale was required in order to properly close the water balance on some gauged 18
catchments in the Ardèche, and the correction was generally leading to increased rainfall. 19
Rainfall volume underestimation could explain the general discharge underestimation by the 20
model. Some authors tried to overcome the rainfall underestimation problem in mountainous 21
areas by interpolating the SAFRAN data across altitude bands (Etchevers et al., 2001; 22
Lafaysse et al., 2011; Thierion et al., 2012), but these data were not available for the present 23
study. In addition, SAFRAN re-analyses are based on existing rain gauges. In mountainous 24
areas, the few rain gauges that do exist are generally located in lower, flatter terrain, and may 25