HAL Id: hal-00304015
https://hal.archives-ouvertes.fr/hal-00304015
Submitted on 5 Mar 2008HAL is a multi-disciplinary open access
archive for the deposit and dissemination of sci-entific research documents, whether they are pub-lished or not. The documents may come from teaching and research institutions in France or abroad, or from public or private research centers.
L’archive ouverte pluridisciplinaire HAL, est destinée au dépôt et à la diffusion de documents scientifiques de niveau recherche, publiés ou non, émanant des établissements d’enseignement et de recherche français ou étrangers, des laboratoires publics ou privés.
Spatiotemporal variations of NOy species in the
northern latitudes stratosphere measured with the
balloon-borne MIPAS instrument
A. Wiegele, A. Kleinert, H. Oelhaf, R. Ruhnke, G. Wetzel, F. Friedl-Vallon, A.
Lengel, G. Maucher, H. Nordmeyer, H. Fischer
To cite this version:
A. Wiegele, A. Kleinert, H. Oelhaf, R. Ruhnke, G. Wetzel, et al.. Spatiotemporal variations of NOy species in the northern latitudes stratosphere measured with the balloon-borne MIPAS instrument. Atmospheric Chemistry and Physics Discussions, European Geosciences Union, 2008, 8 (2), pp.4693-4725. �hal-00304015�
ACPD
8, 4693–4725, 2008 Spatiotemporal variations of NOy species measured by MIPAS-B A. Wiegele et al. Title Page Abstract Introduction Conclusions References Tables Figures ◭ ◮ ◭ ◮ Back CloseFull Screen / Esc
Printer-friendly Version
Interactive Discussion Atmos. Chem. Phys. Discuss., 8, 4693–4725, 2008
www.atmos-chem-phys-discuss.net/8/4693/2008/ © Author(s) 2008. This work is licensed
under a Creative Commons License.
Atmospheric Chemistry and Physics Discussions
Spatiotemporal variations of NO
y
species
in the northern latitudes stratosphere
measured with the balloon-borne MIPAS
instrument
A. Wiegele1,*, A. Kleinert1, H. Oelhaf1, R. Ruhnke1, G. Wetzel1, F. Friedl-Vallon1, A. Lengel1,**, G. Maucher1, H. Nordmeyer1, and H. Fischer1
1
Institut f ¨ur Meteorologie und Klimaforschung, Forschungszentrum Karlsruhe, Karlsruhe, Germany
*
now at: Institut f ¨ur Physik der Atmosph ¨are, DLR, Oberpfaffenhofen, Germany
**
now at: Carl Zeiss AG, Oberkochen, Germany
Received: 4 December 2007 – Accepted: 25 January 2008 – Published: 5 March 2008 Correspondence to: A. Wiegele ([email protected])
ACPD
8, 4693–4725, 2008 Spatiotemporal variations of NOy species measured by MIPAS-B A. Wiegele et al. Title Page Abstract Introduction Conclusions References Tables Figures ◭ ◮ ◭ ◮ Back CloseFull Screen / Esc
Printer-friendly Version
Interactive Discussion
Abstract
This paper presents the spatiotemporal distribution of NOyspecies at altitudes between
14 and 31 km as measured with the MIPAS-B instrument on the morning of 21 March 2003 in northern Scandinavia. At lower altitudes, temperature variations and the dis-tribution of ClONO2 and the tracer N2O reveal the dynamics along the cross section 5
through the edge of the late arctic polar vortex. At higher altitudes, continuous mea-surement before, during, and after sunrise provides information about photochemistry illustrating the evolution of the photochemically active gases NO2 and N2O5 around
sunrise. The measured temporal evolution of NO2and N2O5is compared to box
mod-elling that is run along backward calculated trajectories. With regard to NO2, there
10
is a good agreement between the model and observations in terms of quantity but the photochemistry in the model is slightly too slow. The comparison of measured and modelled N2O5, however, reveals significant differences of the absolute quantities
pointing at a too slow photochemistry in the model.
1 Introduction
15
Odd reactive nitrogen (NOy) can be divided into reactive radicals NOxand the less
re-active reservoir species (Brasseur et al.,1999). For the following discussion, we define:
NOx= NO + NO2+ NO3 (1)
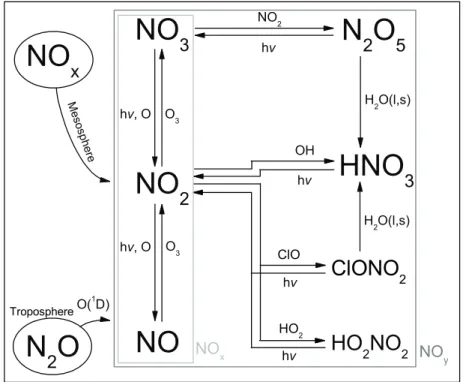
NOy= NOx+ HNO3+ 2 · N2O5+ ClONO2+ HO2NO2 (2)
20
Nitrogen constituents, which are of minor importance for the NOy budget, such as
HNO2and BrONO2are neglected here. The most important NOyreactions are shown
in Fig.1with hν denoting photolytic dissociation reactions. The time constants for the photolytic reactions are quite different for the various species. Photolytic reactions of
ACPD
8, 4693–4725, 2008 Spatiotemporal variations of NOy species measured by MIPAS-B A. Wiegele et al. Title Page Abstract Introduction Conclusions References Tables Figures ◭ ◮ ◭ ◮ Back CloseFull Screen / Esc
Printer-friendly Version
Interactive Discussion NO2and NO3are very fast, while photolysis of N2O5is slower, and photolysis of HNO3
and ClONO2is almost negligible in the lower stratosphere (Wayne,2000).
Thus, the partitioning within NOxis dominated by fast photochemistry. NO2is most
prominent during nighttime, while a considerable amount of NOx is converted to NO during daytime. The mixing ratios of NO and NO3differ between sunlit and dark condi-5
tions by a few orders of magnitude depending on altitude and latitude. The reformation of NO2after sunset is about as fast as its photolytic dissociation after sunrise.
N2O5 is photolysed into NO2 and NO3 during the daytime. This reaction is much
slower than the photolysis of NO2 into NO, thus N2O5 is decreasing slowly during the
whole daytime period. At nighttime, in the absence of sunlight, N2O5is built up through
10
the reaction of NO2with NO3leading to a slow increase of N2O5during the nighttime with its maximum occurring around sunrise.
The NOy family plays an important role in ozone chemistry, where the NOy species
have the ability to act in two ways. One is the ability to buffer reactive halogen species by forming reservoir gases and the other is its capability of catalytic ozone destruction
15
(Brasseur et al., 1999). While the overall reactive nitrogen content NOy is invariant
at short timescales, the partitioning changes rapidly around sunset and sunrise and slowly during day- and nighttime. Furthermore, the amount of NOyat a certain altitude
differs between inside and outside the vortex.
Numerous measurements of individual species of the NOyfamily have been reported
20
over the last decades whereas observations of the complete partitioning and budget can be found less frequently in the literature. The latter have been mainly based on airborne and spaceborne remote sensing during day- and nighttime in emission or at sunrise and sunset in occultation (e.g. Toon,1987;Abbas et al.,1991;Sen et al., 1998;Danilin et al., 1999; Osterman et al.,1999;K ¨ull et al.,2002; Stowasser et al.,
25
2002,2003;Wetzel et al.,2002;Mengistu Tsidu et al.,2005).
From these various measurement techniques, diurnal variations of NOyspecies can
be best addressed by balloon borne emission measurements. Emission instruments are capable of measuring in any azimuth direction at any time of the day, and a balloon
ACPD
8, 4693–4725, 2008 Spatiotemporal variations of NOy species measured by MIPAS-B A. Wiegele et al. Title Page Abstract Introduction Conclusions References Tables Figures ◭ ◮ ◭ ◮ Back CloseFull Screen / Esc
Printer-friendly Version
Interactive Discussion platform allows sampling of the same air masses over several hours. Stowasser et al.
(2003) have studied the variation of short-lived NOy species around sunrise, but this
was based on only three limb sequences, that have been performed one hour before, during, and three hours after sunrise.
For the study presented here, vertical profiles of the most important NOy species 5
have been measured quasi-continuously with high temporal resolution during a time period of several hours around sunrise. The measurements cover the altitude range from 14 to about 32 km and a spatial range of a few hundred km. This has allowed the study of both the temporal evolution of short-lived species and the distribution of longer-lived constituents across the vortex edge.
10
2 Measurement and sampling
The Michelson Interferometer for Passive Atmospheric Sounding, balloon-borne version, MIPAS-B, is a cryogenic Fourier transform spectrometer which mea-sures the thermal emission of the atmosphere using the limb sounding geometry (Fischer and Oelhaf,1996). Details about its layout, measurement technique, and data
15
processing are reported byFriedl-Vallon et al.(2004) and references cited therein. The instrument covers the wavenumber region of 750 cm−1
up to 2460 cm−1
(equivalent to 4.06 µm up to 13.3 µm) where the most important NOy species show prominent
rotational-vibrational transitions.
The passive measurement of the thermal emission of atmospheric constituents
al-20
lows MIPAS-B to measure at any time of the day and to point the line-of-sight (LOS) in elevation and azimuth according to the scientific needs. Thus, the remote sensing technique of MIPAS-B is suited for covering a range of altitudes in a short time interval. The azimuth angle can be adjusted to the position of the sun. These capabilities are essential for studying temporal evolutions at consistent illumination conditions.
ACPD
8, 4693–4725, 2008 Spatiotemporal variations of NOy species measured by MIPAS-B A. Wiegele et al. Title Page Abstract Introduction Conclusions References Tables Figures ◭ ◮ ◭ ◮ Back CloseFull Screen / Esc
Printer-friendly Version
Interactive Discussion 2.1 Measurement technique and data analysis
The raw data measured by MIPAS-B are interferograms with a maximum optical path difference of 14.5 cm leading to a spectral resolution of about 0.07 cm−1 (apodised).
The sampling of one interferogram lasts about 10 s. The pointing system (Maucher, 1999) offers an accuracy of better than 150 m (3σ) with respect to tangent point
alti-5
tudes.
The processing of the measured interferograms to calibrated spectra includes math-ematical filtering, non-linearity correction, phase correction, and complex Fourier trans-formation (Kleinert,2006;Kleinert and Trieschmann,2007). The two point calibration that leads to radiance units is done by means of ’deep space’ (+20◦ elevation angle) 10
and black body spectra. As measure of the instrument sensitivity approximate Noise Equivalent Spectral Radiance (NESR) values for each spectral channel are compiled in Table1.
For the temperature and trace gas retrievals the Karlsruhe Optimized and Pre-cise Radiative transfer Algorithm KOPRA (Stiller et al., 2002) and the adapted
inver-15
sion tool KOPRAFIT have been used together with the spectroscopic database HI-TRAN01 (Rothman et al.,2003). Absorption cross-sections of ClONO2 originate from
Wagner and Birk(2003). The microwindows used for the retrieval are basically the ones described byWetzel et al.(2002).
All retrievals have been performed with the same a priori information independent
20
of the time of day. Error calculations include noise and LOS errors as well as spectro-scopic errors for all retrievals. For the temperature retrieval, uncertainties in CO2mixing ratios and gain errors are also taken into account. The gas retrievals then include the error caused by the resulting temperature errors.
The retrieval of NO profiles under consideration of non-local thermodynamic
equilib-25
rium (NLTE) effects has turned out to be extremely difficult for the balloon measurement geometry at this season and latitude, since both the stratospheric and the mesospheric contributions of NO were mainly located above the balloon altitude of about 31 km.
ACPD
8, 4693–4725, 2008 Spatiotemporal variations of NOy species measured by MIPAS-B A. Wiegele et al. Title Page Abstract Introduction Conclusions References Tables Figures ◭ ◮ ◭ ◮ Back CloseFull Screen / Esc
Printer-friendly Version
Interactive Discussion Therefore, those two contributions could not be separated properly, leading to large
errors in the retrieved profiles. Qualitatively, however, the raise of NO with sunrise is quite obvious. Because of the large uncertainties in the retrieved NO profiles, these results are not further discussed, and the NOybudget calculations will be restricted to
the nighttime measurements.
5
2.2 Sampling approach
In order to sample the temporal evolution of the NOy species around sunrise, a
ded-icated measurement scenario has been performed covering the time from two hours before to three hours after sunrise. This scenario had to fulfil two requirements: First, the limb scans had to be comparably fast in order to get a high temporal resolution,
10
and second, the direction of the measurement beam had to be chosen perpendicular to the azimuth direction of the sun in order to ensure symmetric illumination conditions along the LOS before and beyond the tangent point.
The first requirement was reached by averaging only two interferograms per tangent altitude (two have been chosen for the sake of redundancy). The tangent altitude
15
sampling was 14 km, 17.5 km, 19.5 km, followed by equidistant steps of 1.5 km up to 30 km, 31 km, and completed by constant elevations at −0.3◦, 2◦, and 20◦. With this
sampling scheme, the measurement duration of one limb profile was about 5 min. In total 58 limb sounding sequences have been recorded. In order to fulfil the second requirement the azimuth direction of the LOS was changed about every 30 min. Thus,
20
individual limb sequences were grouped in 7 different azimuth angles.
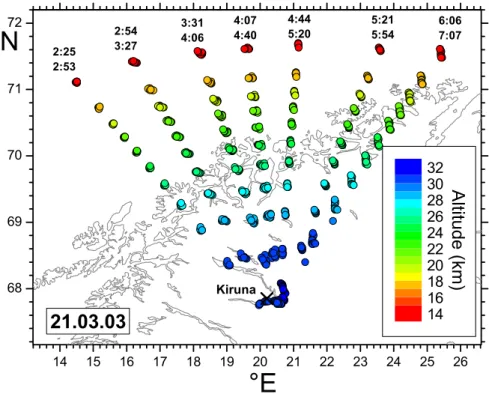
The sampling of the measurements with the coordinates and altitudes of the tan-gent points is shown in Fig. 2. Very calm conditions at float altitude led to nearly no movement of the gondola during the recordings. It should be noted that this measure-ment pattern not only covers the temporal evolution of the NOyspecies, but, by looking 25
into different azimuth directions, also the spatial distribution within the covered range. While the temporal evolution is the dominant effect for short-lived species in the higher altitude range, variations of long-lived trace gases in the course of the measurements
ACPD
8, 4693–4725, 2008 Spatiotemporal variations of NOy species measured by MIPAS-B A. Wiegele et al. Title Page Abstract Introduction Conclusions References Tables Figures ◭ ◮ ◭ ◮ Back CloseFull Screen / Esc
Printer-friendly Version
Interactive Discussion rather reflect the spatial distribution of the trace gases than their temporal evolution.
3 Meteorology
The early winter 2002/2003 was governed by low temperatures (Naujokat and Grunow, 2003) that were below the threshold temperature for the formation of polar stratospheric cloud (PSC) particles (Hanson and Mauersberger, 1988). After a major warming in
5
mid-January followed by a reformation of the vortex, temperatures sank again below the threshold temperature for few days in early February. During that periods PSCs were observed (Spang et al.,2005) and denitrification had been measured by the MkIV instrument (Grooß et al.,2005). Grooß et al.(2005) have modelled the PSC formation as well as denitrification and give a more detailed view about the meteorological
con-10
ditions during the winter 2002/2003.
The MIPAS-B measurements have been performed during a balloon flight above Kiruna (Sweden) at 20th/21st of March 2003. At this time of the year, a weak arctic vortex still existed and its center was shifted to Scandinavia and northern Russia.
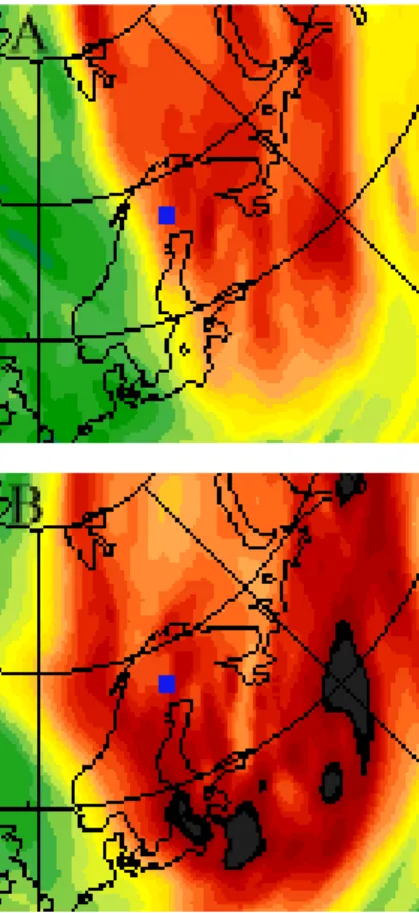
The vortex axis was tilted in the vertical (see Fig.3), therefore the different tangent
15
altitudes (Fig. 2) were partly inside and partly outside of the vortex. The fields of potential vorticity (PV), as well as an analysis of the edge of the polar vortex calculated according toNash et al.(1996), have shown that the westerly tangent points at 17 km and 19 km were situated outside the vortex, while the easterly tangent points were inside. All tangent points above 21 km were clearly inside the vortex. At the lowest
20
level (14 km) the vortex was not well defined anymore.
Regarding the time of the year an exceptionally high tropopause was found in the westernmost measurement region above the North Sea and Norway in the ECMWF temperature profiles and the distributions of the PV. The temperature profile of a ra-diosonde launched from Kiruna the same day shows a first strong inversion, indicating
25
the tropopause, as high as almost 13 km.
In summary, the measurements covered the edge of the polar vortex with strong 4699
ACPD
8, 4693–4725, 2008 Spatiotemporal variations of NOy species measured by MIPAS-B A. Wiegele et al. Title Page Abstract Introduction Conclusions References Tables Figures ◭ ◮ ◭ ◮ Back CloseFull Screen / Esc
Printer-friendly Version
Interactive Discussion horizontal gradients at altitudes between 17 km and 21 km, while weaker gradients
could be expected above these altitudes, where the scanned air masses were situated inside of the vortex. Therefore, both features can be explored, the edge of polar vortex with its strong horizontal gradients in the lowermost stratosphere as well as the diurnal evolution of the shorter lived species in the middle stratosphere.
5
4 Observations
The measurements reflect different air masses across the vortex edge (mainly at lower altitudes) as well as diurnal variations (mainly at higher altitudes). Therefore, the dis-cussion focuses first on temperature and longer lived species to characterise the dy-namical and thermal state of the observed air volumes. Thereafter, the diurnal evolution
10
of photolytically active species such as NO2and N2O5will be discussed.
The following plots show the retrieved profiles in colour code. The observations in the different azimuth directions are separated by black bars. The time of measure-ment is displayed on the X-axis. This axis is not perfectly linear because of calibration measurements during the change of azimuth angles. The approximate longitudes of
15
the tangent points, valid for an altitude of 21 km, are denoted as white numbers. They serve as indicator for the position relative to the vortex edge. Furthermore, Figs.9and 10include the sunrise for different altitudes as a white solid line.
4.1 Temperature
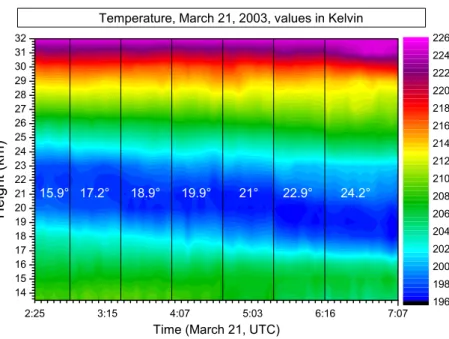
The retrieved temperature profiles are shown in Fig. 4. The temperature does not
20
show mentionable diurnal variations, therefore the longitude, which serves as indicator for the position relative to the vortex edge, is more relevant than the time axis.
The transection across the vortex edge shows differences between the air masses situated outside or inside the polar vortex. The more easterly the measurement is sit-uated, the more the air masses are influenced by processes inside the vortex. The
ACPD
8, 4693–4725, 2008 Spatiotemporal variations of NOy species measured by MIPAS-B A. Wiegele et al. Title Page Abstract Introduction Conclusions References Tables Figures ◭ ◮ ◭ ◮ Back CloseFull Screen / Esc
Printer-friendly Version
Interactive Discussion easterly profiles show a more pronounced temperature minimum which is situated
at lower altitudes compared to the westerly profiles. Although the subsidence of air masses inside the vortex caused by the Brewer-Dobson circulation leads to adiabatic warming, radiative cooling during the polar night is stronger and leads to lower mini-mum temperatures inside the vortex. The minimini-mum temperature decreases from about
5
197.5 K to about 196.5 K between the outer- and innermost sequences, and the alti-tude of the minimum temperature decreases from about 22 km to about 19 km. In the altitude range of about 17 to 19 km, where the measurements cross the vortex edge, horizontal gradients are in the order of 1.5100 kmK with a maximum value of 1.8100 kmK at 18 km.
10
4.2 N2O
The retrieved N2O profiles of all 58 measured sequences are collected in Fig.5. Be-cause of the longevity of N2O, again the situation of the sampled air masses relative to
the vortex is more important for the interpretation of the measurement than the time of day.
15
The dynamic tracer N2O indicates the subsidence of air masses across the vortex
edge very well. The subsidence is clearly visible below 21 km and is more pronounced at lower altitudes. While N2O values of 75 ppbv (cyan) show a subsidence of about 1 km (from 20.8 km to 19.8 km), values of 225 ppbv (yellow) range from 18.5 km to 16 km, revealing a subsidence of about 2.5 km in this altitude range. Above the cyan
20
area, the relative subsidence is less obvious, because at higher altitudes the tangent points of different azimuth directions are relatively close together (see Fig. 2) and all situated inside the vortex. Furthermore, vertical gradients are very weak, which makes the quantification of any subsidence in that altitude region uncertain.
Very low mixing ratios of N2O are measured at altitudes between about 22 and 25
24 km. This is in line with a mesospheric intrusion reported by Engel et al. (2006). Mixing ratios below 15 ppbv are marked in dark blue colours. The black area at this altitude in the two easternmost azimuth directions indicates extremely low N2O
ACPD
8, 4693–4725, 2008 Spatiotemporal variations of NOy species measured by MIPAS-B A. Wiegele et al. Title Page Abstract Introduction Conclusions References Tables Figures ◭ ◮ ◭ ◮ Back CloseFull Screen / Esc
Printer-friendly Version
Interactive Discussion centrations close to zero.
The very high tropopause level mentioned in Sect. 3 is reflected by the high mix-ing ratios of N2O at the lowest altitude of 14 km of the westernmost sequences. The
maximum values of about 323 ppbv are in good agreement with the tropospheric mean value of 2003 (about 318 ppbv,WMO,2006).
5
4.3 NOyPartitioning
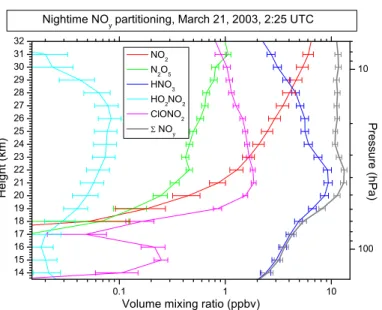
Vertical profiles of nighttime NOypartitioning are shown in Fig.6. The error bars include
noise, temperature and LOS errors as well as spectroscopic errors (see also Sect.2.1). The NOyerror bars are calculated as root of sum squares of the individual errors. HNO3 dominates the budget up to 28 km altitude while higher up, the budget is dominated by
10
NO2. The nighttime contribution of NO to the total NOyis negligible in the measurement
range. Thus, the exclusion of NO is acceptable in the nighttime budget, while at daytime the NO contribution to total NOyexceeds that of NO2at higher altitudes (not shown).
4.4 HNO3
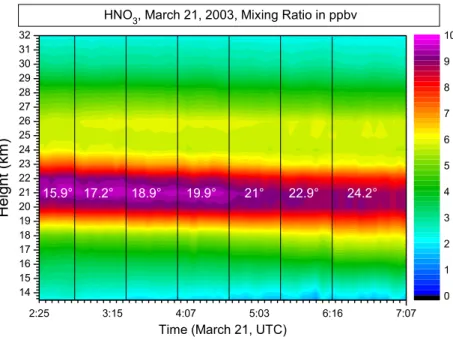
The retrieved mixing ratios of HNO3across the vortex edge are displayed in Fig. 7. In 15
contrast to N2O, HNO3cannot be regarded as good dynamical tracer as it undergoes photochemistry over weeks and may also be affected by denitrification, sedimentation, and renitrification.
From looking at the HNO3profiles, the subsidence of the air masses inside the vortex seems also visible but is much less obvious as compared to N2O (see Fig.5). Further-20
more, the inside-outside contrast could underpin subsidence only for altitudes below about 19 km as it exhibits a different vertical behaviour than N2O. Inside the vortex the
HNO3peak mixing ratios are lower than outside by up to about 1 ppbv whereas below
the VMR peak the HNO3abundance is increased. This pattern suggests some
resid-ual redistribution of HNO3 after events of denitrification that were reported for periods
25
ACPD
8, 4693–4725, 2008 Spatiotemporal variations of NOy species measured by MIPAS-B A. Wiegele et al. Title Page Abstract Introduction Conclusions References Tables Figures ◭ ◮ ◭ ◮ Back CloseFull Screen / Esc
Printer-friendly Version
Interactive Discussion 4.5 ClONO2
As described in Sect.3 the MIPAS-B measurements cover the vortex edge at lower altitudes. Figure 8 shows the distribution of ClONO2 across the vortex edge. After periods of strong chlorine activation, a chlorine nitrate ring is formed near the vortex edge in spring due to the recombination of ClO with NO2. An intersection through 5
this ring is clearly visible in Fig. 8. Maximum ClONO2 mixing ratios of up to 2.5 ppbv appear inside of the vortex close to the edge pointing back at previously strong chlorine activation.
The retrieved ClONO2 profiles show significant differences between adjacent az-imuth directions (separated by thin vertical lines), revealing the very strong horizontal
10
gradients of ClONO2at the edge of the polar vortex. The different subsidence at
adja-cent longitudes is clearly visible in the lower altitude range. 4.6 NO2
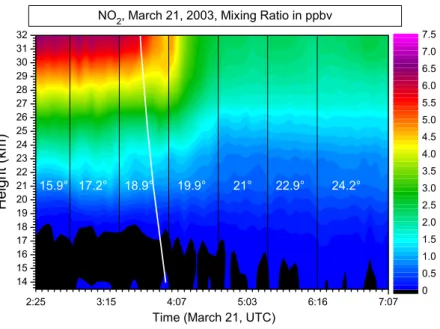
Figure9shows the evolution of the NO2mixing ratios before, during, and after sunrise.
The plot is performed like the figures shown before, but here the time of measurement
15
has to be noted and the white solid line in the third azimuth direction displays the time of sunrise for the different altitudes.
The plot shows mixing ratios of NO2 up to 6.5 ppbv during nighttime at the highest
altitudes. At daytime, the mixing ratios at these altitudes are reduced to about 2.5 ppbv. The reduction during sunrise is quite fast and shows the fast photolysis rates of NO2. 20
For example, at 31 km, the decrease from 5.4 ppbv at local sunrise to 2.3 ppbv takes place within 65 min. The diurnal variations are visible down to about 22 km.
4.7 N2O5
For the interpretation of the measured mixing ratios of N2O5 shown in Fig. 10 again
the measurement time is more important than the longitude. This species is expected
25
ACPD
8, 4693–4725, 2008 Spatiotemporal variations of NOy species measured by MIPAS-B A. Wiegele et al. Title Page Abstract Introduction Conclusions References Tables Figures ◭ ◮ ◭ ◮ Back CloseFull Screen / Esc
Printer-friendly Version
Interactive Discussion to reveal minimum mixing ratios around sunset and maximum mixing ratios around
sunrise as described in Sect.1.
Although the results of N2O5are a little noisier than those of e.g. NO2, the tendencies
are obvious. As expected, the maximum of the mixing ratios is found around sunrise. The peak mixing ratio of 1.15 ppbv is measured at an altitude of 30 km few minutes
5
after local sunrise.
The mixing ratios at altitudes below 25 km do not show a significant response to changing sunlit conditions. The low volume mixing ratios of N2O5at about 23 km in the easterly profiles can again be explained with the reduced NOycontent caused by the
already mentioned mesospheric intrusion.
10
5 Modelling
5.1 Box model
A box model has been used to compare the MIPAS-B measurements with the state-of-the-art chemistry modeling. The box model is a zero dimensional chemistry model described by Ruhnke and R ¨oth (1995) and includes rate coefficients taken from
15
Sander et al.(2003). The photolysis rates are precalculated for the different altitude levels of the trajectories with the radiation transfer model ART (R ¨oth,2002). As the photolysis rates depend especially on the ozone profile, a climatologic ozone profile, normalised to the mean ozone column measured by MIPAS-B, has been used to calcu-late the photolysis rates as realistically as possible. The box model takes into account
20
48 different gases, combined in nine families, and includes 167 reactions, of which 39 are photolytic. Time steps are 10 min and the output is obtained every hour.
The zero dimensional modelling offers the possibility to simulate the chemistry of the measured air parcels for several days, because photochemistry is modelled according to the sunlit conditions along the trajectory. Pressure and temperature are taken from
25
ACPD
8, 4693–4725, 2008 Spatiotemporal variations of NOy species measured by MIPAS-B A. Wiegele et al. Title Page Abstract Introduction Conclusions References Tables Figures ◭ ◮ ◭ ◮ Back CloseFull Screen / Esc
Printer-friendly Version
Interactive Discussion vertical mixing is negligible. For initialisation of the box model the mixing ratios of the
gases used for the modelling are taken from a long-term simulation of the 3-D chemistry transport model KASIMA (Kouker et al., 1999), except for the constraints described below. A multi-annual KASIMA run with a grid of 5.6◦in latitude and longitude is used
with an interpolation to the starting coordinates of the trajectories. The initial NOywas
5
constrained to the total NOy content measured by MIPAS-B. Therefore, the various
NOyspecies NOy,ihad to be normalised by the factor [NOy,
d
NOy= NOy,MIPAS−B NOy,KASIMA
, (3)
such that the NOy partitioning given by KASIMA is preserved, but the total amount is
constrained to the budget of the MIPAS-B measurements. Then the mixing ratios for
10
the box modelling NOy,i,BOX becomes:
NOy,i,BOX= dNOy· NOy,i,KASIMA (4)
These calculations have been done in terms of the definition of NOyas given in Eq. (2).
The mixing ratios of the tracers N2O, CH4, as well as of ozone are also taken from the MIPAS-B measurement to avoid any biases in the initialisation fields modelled by
15
KASIMA and to meet reality as good as possible. 5.2 Trajectories
For the model calculations, backward trajectories originating with the tangent points and times of the MIPAS-B measurements have been calculated. The backward tra-jectory calculations (Reimer and Kaupp, 1997) are based on the ECMWF reanalysis
20
given every 6 h with a resolution of 2.5◦in latitude and longitude. The trajectories are
calculated on isentropic surfaces taking into account radiative heating and cooling with climatological heating rates.
ACPD
8, 4693–4725, 2008 Spatiotemporal variations of NOy species measured by MIPAS-B A. Wiegele et al. Title Page Abstract Introduction Conclusions References Tables Figures ◭ ◮ ◭ ◮ Back CloseFull Screen / Esc
Printer-friendly Version
Interactive Discussion At each altitude, the box model was run for a duration of 3 days along the calculated
backward trajectories, ending at the points of the MIPAS-B measurements. In order to compare the model results to the measurements, the trajectories ending at the times and points of measurements for the first (westernmost) azimuth direction have been extended along so-called synthetic trajectories which are defined by the times and
5
locations of the following MIPAS-B measurements of the same altitude. These synthetic trajectories do not represent the transport of the air parcels anymore; they give only the model results along the MIPAS-B measurements.
Furthermore, for each tangent altitude and azimuth direction of the measurements, individual trajectories have been determined and model calculations along these
indi-10
vidual trajectories have been performed. The model results at the measurement points calculated with the individual trajectories do not differ significantly from the results cal-culated along the synthetic trajectories. Therefore, solely the results of the box mod-elling along the backward trajectories of the first azimuth direction in combination with the synthetic trajectories along the points of measurements will be discussed further.
15
5.3 Results of box modelling
Figures11 and 12 present the time-resolved box modelling results together with the measurements for the photochemically active species NO2 and N2O5, respectively. The time axis is extended to 3 days before the measurements to include the box mod-elling. While this first part of the axis is linear, the time during measurement is stretched
20
and not perfectly linear (see Sect. 4). The coloured circles overlaying the measure-ments denote the mixing ratios for the different altitudes in the same colour code as the measurements. Differences between model results and measurements thus appear as colour contrast between fore- and background. For clarity, the results of the box modelling during the 3 days before the measurement are displayed on fixed altitudes,
25
although the air parcels experience some altitude excursion.
The thin black lines denote the local solar zenith angle in the respective altitudes. In this context, the fixed altitude denotes the horizon. Thus, when the black line is above
ACPD
8, 4693–4725, 2008 Spatiotemporal variations of NOy species measured by MIPAS-B A. Wiegele et al. Title Page Abstract Introduction Conclusions References Tables Figures ◭ ◮ ◭ ◮ Back CloseFull Screen / Esc
Printer-friendly Version
Interactive Discussion the circles, the air parcel is sunlit, while during nighttime, the black line is below the
circles. Depending on altitude and taking terrestrial refraction into account, sunrise and sunset occur at solar zenith angles of 93◦
to 95◦
. 5.3.1 NO2Model results
The modelling of NO2(Fig.11) during the 3 days before the measurements shows the 5
altitude-dependent behaviour of NO2 with changing sunlit conditions very well. The mixing ratios are changing rapidly between night- and daytime according to the varia-tions of the solar zenith angles. This is visible down to 19.5 km. Only few hours are necessary for the model to tune and no mentionable accumulation or consumption of NOxdue to an erroneous initialisation is visible during the modelled 3 days.
10
The comparison between the model and the measurement at the right side of the figure shows that both the daytime and nighttime equilibrium mixing ratios are rep-resented very well by the model. Some differences are evident during sunrise. The reduction of NO2 during the measurements of the third azimuth direction, where the
sunrise occurred, is similar in the model and in the measurement at all altitudes. At the
15
next azimuth direction the model provides significantly slower reductions of NO2at the
highest altitude such that the equilibrium mixing ratio is obtained more than one hour later compared to the measurements pointing to slower photolysis in the model. This bias in time is less pronounced at lower altitudes.
5.3.2 N2O5Model results
20
The diurnal variations of N2O5 (Fig.12) during the first days of modelling show minor
variations with time compared to those of NO2and well defined maxima at sunrise and minima at sunset above 21 km.
During the three days of box modelling an accumulation of N2O5is significant mainly
at altitudes between 25.5 km and 28.5 km. This may be due to two reasons, (i) the
25
nighttime formation, that is strongly dependent on temperature (Kircher et al.,1984), 4707
ACPD
8, 4693–4725, 2008 Spatiotemporal variations of NOy species measured by MIPAS-B A. Wiegele et al. Title Page Abstract Introduction Conclusions References Tables Figures ◭ ◮ ◭ ◮ Back CloseFull Screen / Esc
Printer-friendly Version
Interactive Discussion and (ii) the photolytic daytime destruction, that is very dependent on the photolytic flux
which is mainly determined by the ozone column above.
At the highest altitude, it seems that the N2O5 mixing ratio obtained by KASIMA,
which is used for the model initialisation, is too low. Despite the weak accumulation of N2O5 during three days, the comparison between the model and the measurements
5
shows too small modelled concentrations at the highest altitude, while the modelled mixing ratios in the altitude range from 24 to 29 km are clearly too high.
In addition to the discrepancies in the absolute values, the modelled diurnal evolution during the time of measurement does not fit the measurement very well either. The peak in the modelled N2O5 concentration around sunrise is much broader than the 10
measured one, indicating that the modelled chemistry reactions are too slow, as it has also been found in the modelled NO2values.
6 Conclusions
The results presented here show the ability of MIPAS-B to measure the diurnal vari-ations of photochemically active NOy species with high temporal resolution. Further-15
more, the capability of measuring the spatial distribution of various trace gases across the vortex edge has been demonstrated. The measurements in March 2003 yield a cross section through the edge of the polar vortex as well as the temporal evolution of photochemically active NOyspecies around sunrise. Spatial and temporal effects can
be separated, because the measurements across the vortex edge have only occurred
20
at lower altitudes (as can be seen from the PV distributions), where photochemistry is less important. The measurements at the higher altitudes are situated well inside the vortex, so that chemistry can be investigated solely. The dynamics across the edge of the polar vortex is well seen from the distribution of temperature and of N2O, showing
the relative subsidence of polar vortex air at a good spatial resolution. This spatial
25
resolution allows to resolve the ring of enhanced ClONO2close to the vortex edge with its very strong horizontal gradients.
ACPD
8, 4693–4725, 2008 Spatiotemporal variations of NOy species measured by MIPAS-B A. Wiegele et al. Title Page Abstract Introduction Conclusions References Tables Figures ◭ ◮ ◭ ◮ Back CloseFull Screen / Esc
Printer-friendly Version
Interactive Discussion The measurements of species that are affected by photolysis clearly show the diurnal
variation as expected for both NO2and N2O5.
The comparison with a box modelling along backward calculated trajectories reveals differences that are mainly caused by too slow model chemistry. This explains also the accumulation of modelled N2O5during the three days of backward modelling. The
5
discrepancy between model and measurement may be caused by the photolysis rates used in the box model. As the actual photolysis rates along the trajectory depend on the overhead conditions (in particular on the ozone profile) the photolysis rates used in a 0-D box model, by definition with no information of the actual overhead conditions, are by nature only simple approaches of actual photolysis rates. The initialisation of
10
the box model in particular with respect to the assumed chlorine activation is a further reason for the discrepancies between modelled and measured results.
Acknowledgements. The authors thank the CNES launching team for the excellent balloon
operations, the Esrange team of SSC for logistical support, and the FU Berlin (B. Naujokat and K. Grunow) for meteorological support and trajectory calculations. Financial support by the
15
DLR (Project 50EE0020) and ESA for the MIPAS-B balloon flights is gratefully acknowledged.
References
Abbas, M. M., Kunde, V. G., Brasunas, J. C., Herman, J. R., and Massie, S. T.: Nighttime reactive nitrogen measurements from stratospheric infrared thermal emissions observations, J. Geophys. Res., 96, D6, 10 885–10 897, 1991. 4695
20
Brasseur, G. P., Orlando, J. J., and Tyndall, G. S.: Atmospheric Chemistry and Global Change, Oxford University Press, 654 pp., 1999. 4694,4695
Danilin, M. Y., Rodriguez, J. M., Hu, W., Ko, M. K. W., Weisenstein, D. K., Kumer, J. B., Mer-genthaler, J. L., Russell, J. M., III, Koike, M., Yue, G. K., Jones, N. B., and Johnston, P. V.: Nitrogen species in the post-Pinatubo stratosphere: Model analysis utilizing UARS
measure-25
ments, J. Geophys. Res., 104, D7, 8247–8262, 1999. 4695
Engel, A., M ¨obius, T., Haase, H. P., B ¨onisch, H., Wetter, T., Schmidt, U., Levin, I., Reddmann, T., Oelhaf, H., Wetzel, G., Grunow, K., Huret, N., and Pirre, M.: Observation of mesospheric
ACPD
8, 4693–4725, 2008 Spatiotemporal variations of NOy species measured by MIPAS-B A. Wiegele et al. Title Page Abstract Introduction Conclusions References Tables Figures ◭ ◮ ◭ ◮ Back CloseFull Screen / Esc
Printer-friendly Version
Interactive Discussion
air inside the arctic stratospheric polar vortex in early 2003, Atmos. Chem. Phys., 6, 267– 282, 2006.4701
Fischer, H. and Oelhaf, H.: Remote sensing of vertical profiles of atmospheric trace con-stituents with MIPAS limb-emission spectrometers, Appl. Optics, 35, 2787–2796, 1996.
4696
5
Friedl-Vallon, F., Maucher, G., Seefeldner, M., Trieschmann, O., Kleinert, A., Lengel, A., Keim, C., Oelhaf, H., and Fischer, H.: Design and characterization of the balloon-borne Michelson Interferometer for Passive Atmospheric Sounding (MIPAS-B2), Appl. Optics, 43, 3335–3355, 2004. 4696
Grooß, J.-U., G ¨unther, G., M ¨uller, R., Konopka, P., Bausch, S., Schlager, H., Voigt, C., Volk,
10
C. M., and Toon, G. C.: Simulation of denitrification and ozone loss for the Arctic winter 2002/2003, Atmos. Chem. Phys., 5, 1437–1448, 2005.4699,4702
Hanson, D. R. and Mauersberger, K.: Laboratory studies of the nitric acid trihydrate: Implica-tions for the south polar stratosphere, Geophys. Res. Lett., 15, 855–858, 1988. 4699
Kircher, C. C., Margitan, J. J., and Sander, S. P.: Pressure and temperature dependence of the
15
reaction NO2+NO3+M yields N2O5+M, J. Phys. Chem., 88, 19, 4370–4375, 1984. 4707
Kleinert, A.: Correction of detector nonlinearity for the balloon-borne Michelson Interferometer for Passive Atmospheric Sounding, Appl. Optics, 45, 425–431, 2006. 4697
Kleinert, A.and Trieschmann, O.: Phase determination for a Fourier transform infrared spec-trometer in emission mode, Appl. Optics, 46, 2307–2319, 2007. 4697
20
Kouker, W., Langbein, I., Reddmann, T., and Ruhnke, R.: The Karlsruhe Simulation Model of the Middle Atmosphere (KASIMA), Version 2, Wissenschaftliche Berichte, FZKA 7278, 60 pp., Forschungszentrum Karlsruhe, Germany, 1999.4705
K ¨ull, V., Riese, M., Tie, X., Wiemert, T., Eidmann, G., Offermann, D., and Brasseur, G. P.: NOy
partitioning and aerosol influences in the stratosphere, J. Geophys. Res., 107, D23, 8183,
25
doi:10.1029/2001JD001246, 2002. 4695
Maucher, G.: Das Sternreferenzsystem von MIPAS-B2: Sichtlinien-Bestimmung f ¨ur ein bal-longetragenes Spektrometer zur Fernerkundung atmosph ¨arischer Spurengase, Rep. FZKA 6227, Forschungszentrum Karlsruhe GmbH, Karlsruhe, Germany, 1999.4697
Mengistu Tsidu, G., Stiller, G. P., von Clarmann, T., Funke, B., H ¨opfner, M., Fischer, H., Glatthor,
30
N., Grabowski, U., Kellmann, S., Kiefer, M., Linden, A., Lopez-Puertas, M., Milz, M., Steck, T., and Wang, D.-Y.: NOyfrom Michelson Interferometer for Passive Atmospheric Sounding on Environmental Satellite during the Southern Hemisphere polar vortex split in
Septem-ACPD
8, 4693–4725, 2008 Spatiotemporal variations of NOy species measured by MIPAS-B A. Wiegele et al. Title Page Abstract Introduction Conclusions References Tables Figures ◭ ◮ ◭ ◮ Back CloseFull Screen / Esc
Printer-friendly Version
Interactive Discussion
ber/October 2002, J. Geophys. Res., 110, D11301, doi:10.1029/2004JD005322, 2005.4695
Naujokat, B. and Grunow, K.: The stratospheric arctic winter 2002/03: Balloon flight planning by trajectory calculation, in: Proceedings of the 16th ESA Symposium on European Rocket and Balloon Programmes and Related Research, ESA SP-530, 421–425, St. Gallen, 2003.
4699
5
Nash, E. R., Newman, P. A., Rosenfield, J. E., and Schoeberl, M. R.: An objective determination of the polar vortex using Ertel’s potential vorticity, J. Geophys. Res., 101, 9471–9478, 1996.
4699
Osterman, G. B., Sen, B., Toon, G. C., Salawitch, R. J., Margitan, J. J., Blavier, J.-F., Fahey, D. W., and Gao, R. S.: Partitioning of NOy species in the summer Arctic stratosphere,
Geo-10
phys. Res. Lett., 26, 8, 1157–1160, doi:10.1029/1999GL900166, 1999. 4695
Reimer, E. and Kaupp, H.: Source identification of odour compounds using trajectories, Interreg II research Project OMKAS, Proc. of ECO-INFORMA, 97, 6.–9.October 1997, Eco-Informa-Press, Bayreuth, 572–577, 1997.4705
R ¨oth, E.-P.: Description of the Anisotropic Radiation Transfer Model ART to Determine
Pho-15
todissociation Coefficients, Berichte des Forschungszentrums J ¨ulich, 3960, 2002.4704
Rothman, L. S., Barbe, A., Benner, D. C., et al.: The HITRAN molecular spectroscopic database: edition of 2000 including updates through 2001, J. Quant. Spectrosc. Ra., 82, 5–44, 2003. 4697
Ruhnke, R. and R ¨oth, E.-P.: Ein Box-Trajektorien-Modell zur Analyse atmosph ¨arischer
Reak-20
tionssysteme, Berichte des Forschungszentrums J ¨ulich 3131, Forschungszentrums J ¨ulich GmbH, ISSN 0944-2952, 1995.4704
Sander, S. P., Friedl, R. R., Ravishankara, A. R., Golden, D. M., Kolb, C. E., Kurylo, M. J., Huie, R. E., Orkin, V. L., Molina, M. J., Moortgat, G. K., and Finlayson-Pitts, B. J.: Chemical Kinetics and Photochemical Data for Use in Atmospheric Studies/Evaluation Number 14,
25
JPL Publication 02-25,http://jpldataeval.jpl.nasa.gov/pdf/JPL 02-25 rev02.pdf, 2003. 4704
Sen, B., Toon, G. C., Osterman, G. B., Blavier, J.-F., Margitan, J. J., Salawitch, R. J., and Yue, G. K.: Measurements of reactive nitrogen in the stratosphere, J. Geophys. Res., 103, D3, 3571–3586, 1998. 4695
Spang, R., Remedios, J. J., Kramer, L. J., Poole, L. R., Fromm, M. D., M ¨uller, M.,
Baum-30
garten, G., and Konopka, P.: Polar stratospheric cloud observations by MIPAS on ENVISAT: Detection method, validataion and analysis of the northern hemisphere winter 2002/2003, Atmos. Chem. Phys., 5, 679–692, 2005. 4699
ACPD
8, 4693–4725, 2008 Spatiotemporal variations of NOy species measured by MIPAS-B A. Wiegele et al. Title Page Abstract Introduction Conclusions References Tables Figures ◭ ◮ ◭ ◮ Back CloseFull Screen / Esc
Printer-friendly Version
Interactive Discussion
Stiller, G. P., von Clarmann, T., Funke, B., Glatthor, N., Hase, F., H ¨opfner, M., and Linden, A.: Sensitivity of trace gas abundances retrievals from infrared limb emission spectra to simplifying approximations in radiative transfer modelling, J. Quant. Spectrosc. Ra., 72, 249– 280,2002. 4697
Stowasser, M., Oelhaf, H., Ruhnke, R., Wetzel, G., Friedl-Vallon, F., Kleinert, A., Kouker, W.,
5
Lengel, A., Maucher, G., Nordmeyer, H., Reddmann, Th., Trieschmann, O., von Clarmann, T., Fischer, H., and Chipperfield, M. P.: A characterization of the warm 1999 Arctic winter by observations and modeling: NOypartitioning and dynamics, J. Geophys. Res., 107, D19, 4376, doi:10.1029/2001JD001217, 2002. 4695
Stowasser, M., Oelhaf, H., Ruhnke, R., Kleinert, A., Wetzel, G., Friedl-Vallon, F., Kouker, W.,
10
Lengel, A., Maucher, G., Nordmeyer, H., Reddmann, T., and Fischer, H.: The variation of short-lived NOy species around sunrise at mid-latitudes as measured by MIPAS-B and calculated by KASIMA, Geophys. Res. Lett., 30, 8, 1432, doi:10.1029/2002GL016727, 2003.
4695,4696
Toon, G. C.: Detection of stratospheric nitrogen species, Nature, 330, 427, 1987.4695
15
Wagner, G. and Birk, M.: New infrared spectroscopic database for chlorine nitrate, J. Quant. Spectrosc. Ra., 82, 443–460, 2003.4697
Wayne, R. P.: Chemistry of atmospheres: an introduction to the chemistry of the atmospheres of earth, the planets and their satellites, Oxford Univ. Press, 806 pp., 2000. 4695
Wetzel, G., Oelhaf, H., Ruhnke, R., Friedl-Vallon, F., Kleinert, A., Kouker, W., Maucher, G.,
Red-20
dmann, T., Seefeldner, M., Stowasser, M., Trieschmann, O., von Clarmann, T., Fischer, H.: NOy partitioning and budget and its correlation with N2O in the Arctic vortex and in summer midlatitudes in 1997, J. Geophys. Res., 107, D16, doi:10.1029/2001JD000916, 2002. 4695,
4697
WMO: Greenhouse Gas Bulletin, 4 pp.,
25
http://www.wmo.ch/pages/prog/arep/gaw/ghg/documents/ghg-bulletin-en-11-06.pdf, 2006.
ACPD
8, 4693–4725, 2008 Spatiotemporal variations of NOy species measured by MIPAS-B A. Wiegele et al. Title Page Abstract Introduction Conclusions References Tables Figures ◭ ◮ ◭ ◮ Back CloseFull Screen / Esc
Printer-friendly Version
Interactive Discussion Table 1. Spectral channels of MIPAS-B during the flight in March 2003 along with NESR values
and prominent gases in these spectral regions.
Wavenumber region approx. NESR (single spectrum) Gases Channel
(cm−1) (nW/(cm2sr cm−1)) NO
y Further Species
1 750 1000 7 HNO3, HO2NO2, ClONO2 CO2, O3, ClO, H2O 2 1070 1557 4.5 N2O5 CH4, N2O, O3, H2O
3 1557 1774 1.5 NO2 H2O
4 1774 2460 1.8 NO
ACPD
8, 4693–4725, 2008 Spatiotemporal variations of NOy species measured by MIPAS-B A. Wiegele et al. Title Page Abstract Introduction Conclusions References Tables Figures ◭ ◮ ◭ ◮ Back CloseFull Screen / Esc
Printer-friendly Version
Interactive Discussion Fig. 1. Simplified reaction scheme of NOy. All mentioned NOy species except NO and NO3
ACPD
8, 4693–4725, 2008 Spatiotemporal variations of NOy species measured by MIPAS-B A. Wiegele et al. Title Page Abstract Introduction Conclusions References Tables Figures ◭ ◮ ◭ ◮ Back CloseFull Screen / Esc
Printer-friendly Version
Interactive Discussion Fig. 2. Measurement scheme with its tangent points above northern Scandinavia. The colour
code denotes the altitudes of the tangent points. For each azimuth direction, start and stop times of the measurements are indicated in UTC. The sunrise was between 03:40 UTC at the highermost and 04:00 UTC at the lowermost tangent points.
ACPD
8, 4693–4725, 2008 Spatiotemporal variations of NOy species measured by MIPAS-B A. Wiegele et al. Title Page Abstract Introduction Conclusions References Tables Figures ◭ ◮ ◭ ◮ Back CloseFull Screen / Esc
Printer-friendly Version
Interactive Discussion Fig. 3. Distribution of PV above north-eastern Europe on 21 March 2003, 00:00 UTC. Part
A shows the distribution at the potential temperature level 475 K (∼19.5 km), part B at 550 K (∼22.5 km). Kiruna is marked with a blue square. Although the colour code is not identical, yel-low colours denote the edge of polar vortex in both graphs, while red colours show air masses inside the vortex (D ¨ornbrack, personal communication, 2003).
ACPD
8, 4693–4725, 2008 Spatiotemporal variations of NOy species measured by MIPAS-B A. Wiegele et al. Title Page Abstract Introduction Conclusions References Tables Figures ◭ ◮ ◭ ◮ Back CloseFull Screen / Esc
Printer-friendly Version
Interactive Discussion Fig. 4. Temperature across the edge of the polar vortex. The seven azimuth directions of the
measurements are separated by black bars. The different blocks are labelled with the mean longitude of the tangent points at 21 km. The X-axis shows the time of the measurement.
ACPD
8, 4693–4725, 2008 Spatiotemporal variations of NOy species measured by MIPAS-B A. Wiegele et al. Title Page Abstract Introduction Conclusions References Tables Figures ◭ ◮ ◭ ◮ Back CloseFull Screen / Esc
Printer-friendly Version
Interactive Discussion Fig. 5. Same as Fig.4, but for N2O.
ACPD
8, 4693–4725, 2008 Spatiotemporal variations of NOy species measured by MIPAS-B A. Wiegele et al. Title Page Abstract Introduction Conclusions References Tables Figures ◭ ◮ ◭ ◮ Back CloseFull Screen / Esc
Printer-friendly Version
Interactive Discussion Fig. 6. Nighttime partitioning of NOyexcept NO of the first measured sequence.
ACPD
8, 4693–4725, 2008 Spatiotemporal variations of NOy species measured by MIPAS-B A. Wiegele et al. Title Page Abstract Introduction Conclusions References Tables Figures ◭ ◮ ◭ ◮ Back CloseFull Screen / Esc
Printer-friendly Version
Interactive Discussion Fig. 7. Same as Fig.4, but for HNO3.
ACPD
8, 4693–4725, 2008 Spatiotemporal variations of NOy species measured by MIPAS-B A. Wiegele et al. Title Page Abstract Introduction Conclusions References Tables Figures ◭ ◮ ◭ ◮ Back CloseFull Screen / Esc
Printer-friendly Version
Interactive Discussion Fig. 8. Same as Fig.4, but for ClONO2.
ACPD
8, 4693–4725, 2008 Spatiotemporal variations of NOy species measured by MIPAS-B A. Wiegele et al. Title Page Abstract Introduction Conclusions References Tables Figures ◭ ◮ ◭ ◮ Back CloseFull Screen / Esc
Printer-friendly Version
Interactive Discussion Fig. 9. Same as Fig.4, but for NO2. Here, the added white solid line denotes the time of the
ACPD
8, 4693–4725, 2008 Spatiotemporal variations of NOy species measured by MIPAS-B A. Wiegele et al. Title Page Abstract Introduction Conclusions References Tables Figures ◭ ◮ ◭ ◮ Back CloseFull Screen / Esc
Printer-friendly Version
Interactive Discussion Fig. 10. Same as Fig.9, but for N2O5.
ACPD
8, 4693–4725, 2008 Spatiotemporal variations of NOy species measured by MIPAS-B A. Wiegele et al. Title Page Abstract Introduction Conclusions References Tables Figures ◭ ◮ ◭ ◮ Back CloseFull Screen / Esc
Printer-friendly Version
Interactive Discussion Fig. 11. Comparison between measured and modelled NO2 mixing ratios. Model results are
figured as coloured circles while the measurements results are plotted at the right hand side in the background.
ACPD
8, 4693–4725, 2008 Spatiotemporal variations of NOy species measured by MIPAS-B A. Wiegele et al. Title Page Abstract Introduction Conclusions References Tables Figures ◭ ◮ ◭ ◮ Back CloseFull Screen / Esc
Printer-friendly Version
Interactive Discussion Fig. 12. Same as Fig.11but for N2O5.