HAL Id: hal-00302196
https://hal.archives-ouvertes.fr/hal-00302196
Submitted on 12 Oct 2006HAL is a multi-disciplinary open access
archive for the deposit and dissemination of sci-entific research documents, whether they are pub-lished or not. The documents may come from teaching and research institutions in France or abroad, or from public or private research centers.
L’archive ouverte pluridisciplinaire HAL, est destinée au dépôt et à la diffusion de documents scientifiques de niveau recherche, publiés ou non, émanant des établissements d’enseignement et de recherche français ou étrangers, des laboratoires publics ou privés.
Evaluation of a new convective cloud field model:
precipitation over the maritime continent
H.-F. Graf, J. Yang
To cite this version:
H.-F. Graf, J. Yang. Evaluation of a new convective cloud field model: precipitation over the maritime continent. Atmospheric Chemistry and Physics Discussions, European Geosciences Union, 2006, 6 (5), pp.10217-10246. �hal-00302196�
ACPD
6, 10217–10246, 2006Evaluation convective cloud
field model
H.-F. Graf and J. Yang
Title Page Abstract Introduction Conclusions References Tables Figures J I J I Back Close
Full Screen / Esc
Printer-friendly Version Interactive Discussion
EGU
Atmos. Chem. Phys. Discuss., 6, 10217–10246, 2006 www.atmos-chem-phys-discuss.net/6/10217/2006/ © Author(s) 2006. This work is licensed
under a Creative Commons License.
Atmospheric Chemistry and Physics Discussions
Evaluation of a new convective cloud field
model: precipitation over the maritime
continent
H.-F. Graf and J. Yang
University of Cambridge, Centre for Atmospheric Sciences, Cambridge, UK
Received: 31 August 2006 – Accepted: 12 October 2006 – Published: 12 October 2006 Correspondence to: H.-F. Graf ([email protected])
ACPD
6, 10217–10246, 2006Evaluation convective cloud
field model
H.-F. Graf and J. Yang
Title Page Abstract Introduction Conclusions References Tables Figures J I J I Back Close
Full Screen / Esc
Printer-friendly Version Interactive Discussion
Abstract
A convective cloud field model (CCFM) is substituted for a standard mass flux param-eterisation of convective clouds in a limited area atmospheric model (REMO) and is tested for a whole annual cycle (July 1997 to June 1998) over the Maritime Continent. REMO with CCFM is run in 0.5-degree resolution and the model at the boundaries is
5
forced 6-hourly by ECMWF reanalysis data. Simulated precipitation from runs with the standard convection parameterisation and with CCFM is compared against two sets of observations. The use of CCFM clearly improves the simulated precipitation patterns and total rainfall over the whole model domain. The distribution between large-scale and convective precipitation becomes more realistic. CCFM shows to be a useful
con-10
cept to describe convective cloud spectra in atmospheric models, although there are still similar problems with occasionally extreme precipitation as in the original set-up of REMO.
1 Introduction
The representation of convective clouds in atmospheric circulation and climate
mod-15
els is one of the yet unsolved current challenges. A realistic treatment of the physical processes associated with convective clouds is of great importance for many other physical processes in an Atmospheric General Circulation Model (AGCM) since con-vection to a large degree controls the vertical distribution and transport of moisture, chemical tracers, energy and momentum. The net latent heat released when
precipi-20
tation is formed couples convection to the large-scale dynamics. Water detraining from convective clouds is used in AGCMs as a source for stratiform clouds including cirrus, which in turn have great importance for the radiation budget of the Earth. To resolve the spectrum (or probability density function, PDF, in terms of cloud height, radius and vertical velocities) of convective clouds, their physics needs to be explicitly determined
25
ffer-ACPD
6, 10217–10246, 2006Evaluation convective cloud
field model
H.-F. Graf and J. Yang
Title Page Abstract Introduction Conclusions References Tables Figures J I J I Back Close
Full Screen / Esc
Printer-friendly Version Interactive Discussion
EGU
ent attempts have been made to parameterise convection. Most of the current cumulus convection parameterisations are formulated as mass flux schemes and use the stan-dard vertical resolution of the AGCM they are imbedded in. They determine the overall mass flux of all cumulus clouds in one AGCM grid column (Anthes, 1977; Emanuel, 1994; Emanuel and Raymond, 1993; Tiedtke, 1989). Other convection schemes are
5
based on cloud models (Arakawa and Schubert, 1974; Kreitzberg and Perkey, 1976, 1977; Kain and Fritsch, 1990).
One problem with current mass flux schemes is that they describe the variety of convective clouds by an effective mean convective cloud while in the real world con-vective activity always produces cloud spectra. In general, there are many small clouds
10
and just a few deep clouds. The mass flux approach also causes a lack of informa-tion about cloud dynamics and microphysics, although Zhang et al. (2005) report on the successful introduction of explicit microphysics in the convective mass flux scheme (still simulating one mean cloud) of ECHAM5. Convective transport very probably is oversimplified with current cumulus schemes. The idea of an explicit cloud spectrum
15
parameterisation was introduced by Arakawa and Schubert (1974). Their scheme de-scribes a spectrum of mass fluxes. In contrast to Arakawa and Schubert (1974), Don-ner (1993), DonDon-ner et al. (2001) and Naveau and Moncrieff (2001) describe a spectrum of simplified clouds and not mass fluxes. Cloud dynamical and microphysical structures are represented in a more precise way, but both schemes are based on either
obser-20
vations or high-resolution cloud resolving model (CRM) simulations and are, therefore, to a certain degree case-dependent. Using a cloud-resolving convection parameter-ization approach (also called “super-parameterisation”, Grabowski, 2003) would be another pathway to solve the cumulus problem. However, these schemes are still far too computationally expensive to be applied in long climate integrations.
25
Recently Nober and Graf (2005) published a new approach to convective cloud field parameterisation based on a full spectral Convective Cloud Field Model (CCFM, see their publication for details of the model). CCFM is based on a concept from population dynamics (specifically the Lotka-Volterra equation is applied to determine the resulting
ACPD
6, 10217–10246, 2006Evaluation convective cloud
field model
H.-F. Graf and J. Yang
Title Page Abstract Introduction Conclusions References Tables Figures J I J I Back Close
Full Screen / Esc
Printer-friendly Version Interactive Discussion
cloud spectrum) to the field of convective cloud parameterisation. CCFM does not seek to explicitly resolve a three dimensional cloud field, but rather its statistics, namely the PDF (or the spectrum) of cloud dimensions, including precipitation rate and convective transport. This makes CCFM much cheaper to run by only keeping the most relevant information. The cloud spectrum defined by CCFM can be used to determine the
5
spectrum of convective transport, of heating rates, precipitation intensity, cloud top heights etc. This information one would also obtain from a CRM, but at much higher cost. A conventional “mean cloud” parameterisation does not give this information except when a spectrum is prescribed based on observations or CRM results.
Important benefits of CCFM are that cloud spectra (i.e. the PDF of cloud sizes and
10
heights) are not prescribed, but evolve from vertical profiles of temperature and hu-midity and triggering provided by the mother GCM. The convective and non-convective processes of the previous time step modify these profiles. Hence, CCFM covers all possible states of the atmosphere without a priori information. Second, since CCFM provides a spectrum of vertical velocities in conjunction to cloud radii and heights, it
15
can explicitly treat convective transport. Inclusion of microphysics in the cloud model used by CCFM allows the interaction of aerosols with convective clouds to be studied. CCFM also produces PDFs of precipitation intensities in a grid cell and, due to the fact that the internal vertical grid in CCFM is of much higher resolution (typical 70–100 m throughout the layer of convection), the formation of mixed phase can be determined
20
more accurately than with the typical 1000 m resolutions of GCMs in the free tropo-sphere. The CCFM was successfully tested against a complex Large Eddy Model, LEM (Nober and Graf, 2005). In this case CCFM was able to simulate important quan-tities of a shallow cumulus cloud field very close to the LEM. The reference convection scheme of the state of the art climate model ECHAM5 fails to do so by a factor of 2
25
(cloud cover) and by a factor of 5 (liquid water path).
CCFM was developed to be used in coarse resolution climate models. The question if CCFM also leads to reasonable results in higher resolution models will be answered in this current study. We will investigate the performance of CCFM with respect to
ACPD
6, 10217–10246, 2006Evaluation convective cloud
field model
H.-F. Graf and J. Yang
Title Page Abstract Introduction Conclusions References Tables Figures J I J I Back Close
Full Screen / Esc
Printer-friendly Version Interactive Discussion
EGU
precipitation in a limited area model (REMO, Jacob, 2001) of 0.5-degree resolution, run over the Maritime Continent for a full year from July 1997 to June 1998. While in 1997 the ongoing El Nino event led to anomalously low rainfall over much of the model domain, 1998 was a normal year with higher rainfall than in 1997. This study provides a test also for deep convection, which was missing in the first study by Nober and
5
Graf (2005). The Maritime continent is a region of most complex meteorological and geographical conditions. Consisting of a large number of islands of varying size in the centre of the tropical oceanic warm pool, it experiences two main seasons, wet and dry. From November to March the winter monsoon brings heavy rainfall with northeasterly winds north and northwesterly winds south of the equator. The transitional seasons are
10
characterized by relatively weak and variable winds. The precipitation is highly variable in space and time and precipitation often results from deep tropical convective clouds. We will compare monthly area mean precipitation and precipitation patterns from a version of REMO with the standard mass flux cumulus parameterisation against a version, which contains CCFM and two different sets of observed monthly precipitation.
15
We will also study contrasting daily cycles over land and ocean points during wet and dry seasons.
2 Model and data
The limited area model REMO (REgional MOdel) has been developed from the re-gional three dimensional weather forecast model EM/DM of the German Weather
Ser-20
vice (Majewski, 1991). It includes parameterisations of unresolved physical processes based on the global circulation model ECHAM4 (Roeckner et al., 1996; Jacob, 2001). Its standard horizontal resolution is 0.5 degrees and it has 20 vertical layers. In the so-called climate mode at the first time step (1 June 1997) REMO is initialised us-ing meteorological reanalysis data (ERA40) from ECMWF, which serve also as lateral
25
boundary conditions every 6 h. This procedure secures that the model is always close to the observed meteorological conditions while internally developing its own
dynam-ACPD
6, 10217–10246, 2006Evaluation convective cloud
field model
H.-F. Graf and J. Yang
Title Page Abstract Introduction Conclusions References Tables Figures J I J I Back Close
Full Screen / Esc
Printer-friendly Version Interactive Discussion
ics. So the model parameters can directly be compared with observations. We chose the year 1997 to 1998 because this was characterized by enormous smoke concen-trations due to biomass burning (mainly peat fires, Langmann and Heil, 2004) and we will, in a later paper, investigate the effects of the smoke on the efficiency of the for-mation of precipitation. REMO, in its standard configuration in the climate mode, while
5
reproducing the annual cycle very well, overestimates rainfall over the whole Maritime Continent by an order of 50–100% mainly during the wet season (Langmann and Heil, 2004).
The model is run twice with different convective cloud modules. The standard con-vective cloud module is based on the scheme of Tiedtke (1989). It is one of the current
10
cumulus parameterisations, which are formulated as muss flux schemes, determining the overall mass flux of all cumulus clouds in one grid column. The new CCFM mod-ule is based on Nober and Graf (2005) and determines for each grid column where convection takes place an explicit spectrum of different clouds. CCFM uses the same interface to the mother model as the original Tiedtke scheme, i.e. it receives vertical
15
profiles and tendencies of temperature and humidity and returns vertical profiles of convective tendencies of temperature and humidity, convective precipitation and de-trainment of water to the GCM. In CCFM a one-dimensional cloud model is used to determine the potential clouds developing under given atmospheric conditions. This includes a microphysics scheme, which in the original version is based on Kessler
20
(1969) for warm clouds and Ogura and Takahashi (1971) for mixed phase. At every grid point and at every time step, first a simplified cloud model is run that is driven by the vertical profiles of temperature and humidity and is initiated by a reasonable set of initial radii and vertical velocities at cloud base. This provides the spectrum of potential convective clouds. Second, cloud-environment and cloud-cloud interaction coefficients
25
are determined and, third, the system is solved under the condition that CAPE is used by the final cloud spectrum as efficiently as possible. This third step provides the final cloud spectrum as a sub-set of the potential clouds from step one. Since the spectrum of potential clouds (step 1) is determined only once and without costly iteration
pro-ACPD
6, 10217–10246, 2006Evaluation convective cloud
field model
H.-F. Graf and J. Yang
Title Page Abstract Introduction Conclusions References Tables Figures J I J I Back Close
Full Screen / Esc
Printer-friendly Version Interactive Discussion
EGU
cedures, the cloud model itself and its microphysics might be of more complex nature than in the original approach taken by Nober and Graf (2005). Here, however, we keep their original version.
We extended the original CCFM with two important modifications. In the first step of CCFM, where the spectrum of potential clouds that can develop in a given
envi-5
ronment (determined by vertical profiles of temperature and humidity) we restrict the maximum initial radius of the convective cloud base to 1/4 of the height of the planetary boundary layer (PBL) from the mother model REMO. The (rather heuristic) reasoning behind this is that the maximum size of vertical turbulent elements developing in the PBL is restricted by the height of the PBL itself. These turbulent elements may be seen
10
as structures organising smaller individual convective elements and finally leading to updrafts initialising individual convective clouds at the cumulus condensation level. In REMO the PBL height is restricted to 5km and this, in some cases, may lead to unre-alistically big clouds and extreme precipitation, especially in cases when very instable situations occur, like during the passage of fronts or squall lines. These structures
15
cannot be simulated by CCFM for conceptual reasons. We tried to limit these extreme cases by including vertical wind shear effects, but did not achieve an overall improve-ment of the results. We limit the growth of the convective cloud if wind shear is bigger than 5 m/s between two REMO levels. These modifications produced improved results, but the exact numbers still have to be determined using high-resolution numerical
mod-20
els. Because of the relatively high resolution of REMO (ca. 60 km horizontally) we also had to restrict the number of different initial radii for the potential cloud types. We found that three cloud types lead to reasonable results, being a compromise between quality of the simulation and computer time. The distribution of the three initial radii is set to: maximum initial cloud radius rmax=1/
4of the PBL height, minimum radius rmin=100 m 25
and the intermediate initial cloud radius is simply set to the mean of rmaxand rmin. At GCM resolution of 4 degrees Nober and Graf used 10 to 20 cloud types, resulting in finer spectra. Second, we estimate the vertical velocity wcbat the base of the convec-tive clouds by turbulent kinetic energy, TKE, which is a prognostic parameter of REMO,
ACPD
6, 10217–10246, 2006Evaluation convective cloud
field model
H.-F. Graf and J. Yang
Title Page Abstract Introduction Conclusions References Tables Figures J I J I Back Close
Full Screen / Esc
Printer-friendly Version Interactive Discussion
following Lohmann et al. (1999) wcb= wl s+ 0.7 sqrt(TKE), where wl sis the large scale vertical velocity. Overall, these modifications to the original CCFM (Nober and Graf, 2005) provide a realistic scenario for the development of convective clouds. Since TKE is lower over sea, as is the PBL height, there smaller clouds develop leading to less rainfall. The daily cycle of convective clouds and rainfall also is affected positively
5
since the conditions of PBL height and TKE vary much less over sea than over land, thus leading to a reduced oceanic daily cycle of convection and convective precipita-tion. Over land the daily cycle of convection is enhanced since PBL height and TKE vary strongly.
We obtained observations of precipitation from two sources: Area averaged monthly
10
mean data of rainfall over land based on rain gauge measurements at 1◦ resolution are available from Global Precipitation Climatology Centre (GPCC,http://www.dwd.de/
en/FundE/Klima/KLIS/int/GPCC). The data coverage is sparse (see a typical example of the number of rain gauges per 1◦ grid GPCC for November 1997, Fig. 1) and this, due to interpolation in the graphics of precipitation patterns, will lead to quite smooth
15
patterns. Very probably local extremes are often not captured. On the other hand, model data are available at 0.5◦ resolution, leading to much higher pattern variability than observations.
Combined land and ocean data, interpolated to a 1.0◦ grid at daily and monthly resolution, based on infrared and microwave satellite observations over ocean and on
20
gauge measurements over land are available from Global Precipitation Climatology Project (Huffmann et al., 1997; Adler et al., 2003), GPCPhttp://precip.gsfc.nasa.gov/. These data have uncertainties of more than 10% over land and more than 40% over sea (Langmann and Heil, 2004).
ACPD
6, 10217–10246, 2006Evaluation convective cloud
field model
H.-F. Graf and J. Yang
Title Page Abstract Introduction Conclusions References Tables Figures J I J I Back Close
Full Screen / Esc
Printer-friendly Version Interactive Discussion
EGU
3 Results and discussion
3.1 Total rainfall
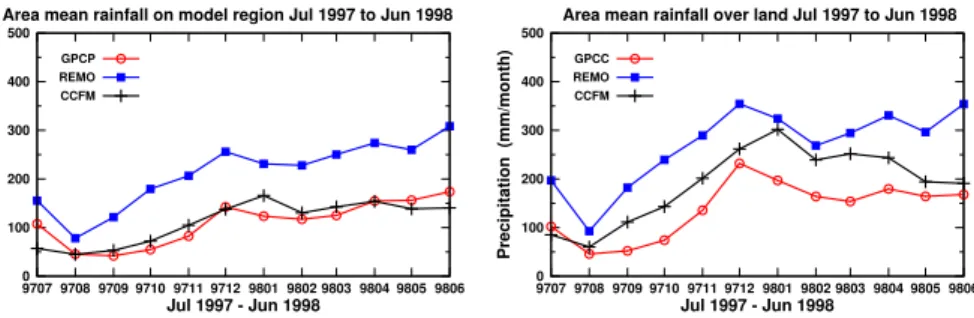
We will first compare the area mean rainfall over all grid cells of REMO and REMO-CCFM with the GPCP blended data set data (Fig. 2a). Clearly, REMO is overestimat-ing rainfall by 60–100% throughout the simulation period from July 1997 to June 1998
5
(green dotted line) in comparison with observations (red line). The inclusion of CCFM leads to much improved rainfall over the area (blue dotted line) with slightly more than observed rainfall from September 1997 to March 1998 and less in July 1997 and May, June 1998, but these differences are still within the range of uncertainty of the obser-vations. If one would speculate for physical reasons, the over-estimated rainfall in the
10
dry season of 1997 might also be due to effects of smoke from the heavy biomass burning going on in Sumatra and Kalimantan in the dry seasons of 1997 and 1998 leading to reduced cloud droplet size and rainfall. This effect, which is not included in the current model version, but clearly has affected the observations, will be cov-ered in an upcoming study. Overall, the introduction of CCFM leads to a significant
15
improvement of mean precipitation over the whole model domain. In Fig. 2b the total rainfall is shown for land grids only, which can be compared with GPCC data. Again, REMO-CCFM is superior to REMO and is much closer to observed values. There still is clearly an over-estimation of rainfall over land by REMO-CCFM in all months except July 1997. Together with the results for the whole area (Fig. 2a) this means that
rain-20
fall over sea will probably be under-estimated. Reasons for these discrepancies will have to be studied later. They may be due to neglecting of aerosol effects on the cloud microphysics, biases in the evaporation from the ocean or in the set-up of CCFM itself. 3.2 Daily cycles
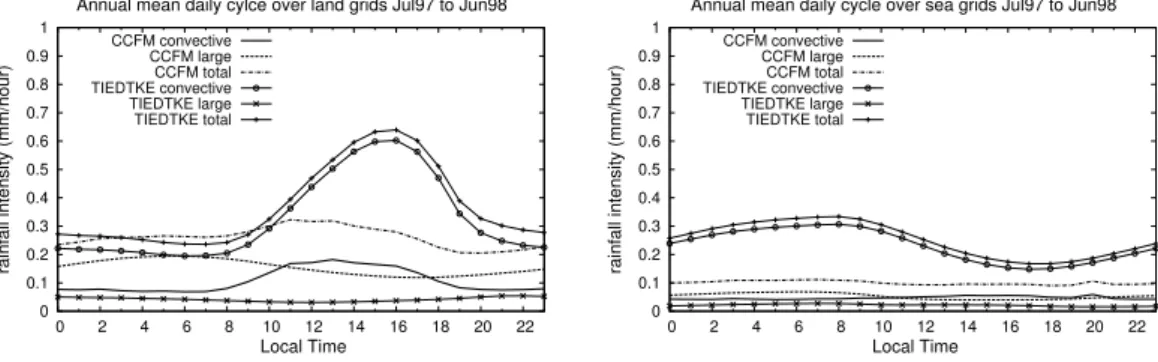
The annual mean daily cycle of convective rainfall (Fig. 3) in REMO is characterised by
25
ACPD
6, 10217–10246, 2006Evaluation convective cloud
field model
H.-F. Graf and J. Yang
Title Page Abstract Introduction Conclusions References Tables Figures J I J I Back Close
Full Screen / Esc
Printer-friendly Version Interactive Discussion
(Fig. 3a) and by a maximum during the night and early morning hours and minimum convective precipitation in the afternoon over sea (Fig. 3b). REMO-CCFM exhibits a similar, but much weaker daily cycle in the annual mean, both over land and sea. In REMO-CCFM the contribution of large-scale precipitation to total precipitation is much higher than in REMO, where over land and sea the large-scale precipitation barely
5
contributes to total precipitation. The total convective precipitation in REMO by far ex-ceeds that in REMO-CCFM, which over land produces a flat maximum during the day and minimum rainfall during the night. Over sea, there is nearly no daily cycle detected in REMO-CCFM. The only publication we found that enables to compare these results with observations is from Mori et al. (2004). They looked at Tropical Rainfall Measuring
10
Mission (TRMM) satellite precipitation radar data over a strip in the vicinity of Sumatra, including land and sea areas that allow studying large scale and convective precipita-tion separately on a 1.5 degree scale. Since they used the years 1998 to 2000 their mean precipitation is higher in the mean than in our case, which includes part of the year 1997 when the precipitation was strongly reduced due to the ongoing El Nino.
15
They found that convective rainfall contributes to total rainfall about 57% in offshore areas and 63% over land with convective rainfall being equal to large scale during the night. REMO results do not match these observations. The REMO-CCFM simulation also does not quite capture the annual mean daily cycle very well; especially it seems to underestimate the contribution of convective rainfall and the strength of the afternoon
20
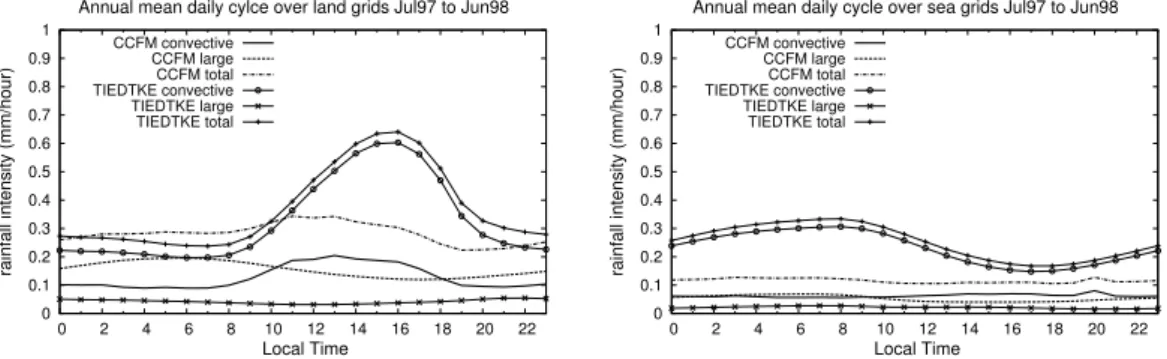
maximum as well as to overestimate the nightly contribution of the large scale precipita-tion. This cannot be improved substantially when only those grid cells are used where precipitation occurs (Fig. 4). Hence, in the mean, REMO overestimates total rainfall mainly due to an overestimation of convective rainfall, while REMO-CCFM produces the right amount of total rainfall over the whole domain, but underestimates convective
25
rainfall. Since large-scale rainfall in the model is directly coupled to convective rainfall (the water not being precipitated from convective clouds directly enters the reservoir for the formation of large scale rainfall), underestimation of convective leads to over-estimation of large-scale rainfall. We have a look at the contribution of the tree cloud
ACPD
6, 10217–10246, 2006Evaluation convective cloud
field model
H.-F. Graf and J. Yang
Title Page Abstract Introduction Conclusions References Tables Figures J I J I Back Close
Full Screen / Esc
Printer-friendly Version Interactive Discussion
EGU
types in REMO-CCFM (in REMO all the convective rain is produced by a single mean convective cloud) to convective rainfall (Fig. 5) for December 1998, at the beginning of the rainy season. The maximum of convective rain is found over the warm waters and land to the north of Australia and over the land areas. There is very little convective rain over the oceans except in the northern part of the model domain. Mainly the biggest
5
convective clouds (type 3) produce the rain, followed by type 2 and the small clouds of type 1. Over the Strait of Malacca and at some other oceanic regions in the northern part of the model domain small and medium clouds together dominate the convective precipitation. At these places the oceanic PBL height is rather low and so the maxi-mum initial cloud radius is much smaller than over land and the differences between
10
the cloud types are small, too. In the case of 1200 m PBL height the three convective types T1, T2, T3 are initialised by radii of 100, 200 and 300 m, respectively. In this case contribution to rainfall from all cloud types is to be expected to be very similar. There is no reasonable way to increase the number of cloud types at resolutions of 0.5 degrees since the numbers of initialised clouds remain too small for typical cloud coverage with
15
convective clouds. This is clearly a disadvantage of CCFM being used at resolutions it was not originally developed for.
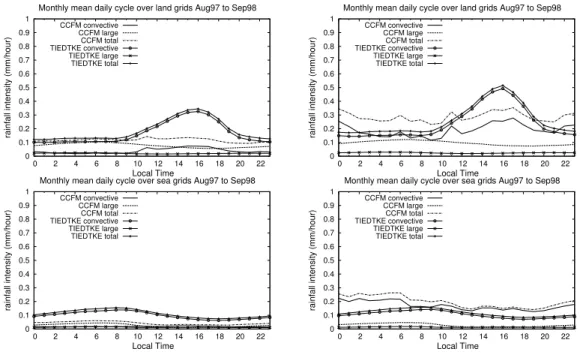
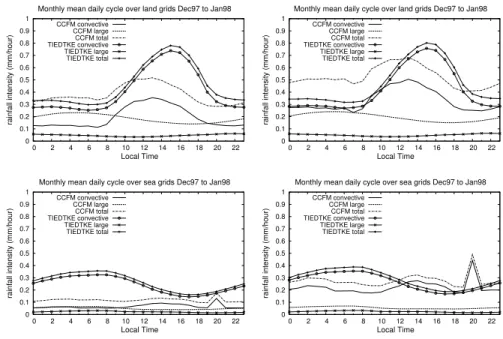
There are some differences in convective precipitation daily cycles between the dry (Fig. 6) and rainy (Fig. 7) seasons. As expected, the daily cycles of precipitation in both our models during the wet season (December 1997 and January 1998) over land and
20
over sea are stronger than during the dry season of August and September 1997. The daily cycle is much stronger over land and weaker over sea. The general deficits, how-ever, remain unchanged with too much (less) contribution of large-scale precipitation in REMO-CCFM (REMO) to the total rainfall. However, if we consider only those time steps when convective rainfall is produced in REMO-CCFM the daily cycle of
convec-25
tive rainfall is enhanced (due to the reduced number of time steps used to calculate the mean) and matches much better the observed distribution between convective and large scale rainfall: equal contribution of large scale and convective precipitation dur-ing the night and enhanced convective rainfall durdur-ing the day. In the REMO simulations
ACPD
6, 10217–10246, 2006Evaluation convective cloud
field model
H.-F. Graf and J. Yang
Title Page Abstract Introduction Conclusions References Tables Figures J I J I Back Close
Full Screen / Esc
Printer-friendly Version Interactive Discussion
the differences are marginal in the wet season, but clearly apparent in the dry sea-son. The daily maximum of rainfall is shifted from 02:00 p.m. in the wet season to 05:00 p.m. in the dry season in REMO-CCFM, while there are no obvious changes in timing of convective rain in REMO. These results suggest that in REMO-CCFM too few rain producing convective clouds are developing in the mean, leading to the transfer
5
of moisture to the reservoir that forms large scale precipitation. Causes may lie in the simplistic microphysics used in CCFM, may lie in the use of too few cloud types or in the distribution of the initial radii of these cloud types.
3.3 Rainfall patterns
An important test of the performance of CCFM is the comparison of the geographical
10
distribution of rainfall against observations. Here we will discuss observed GPCC and GPCP data against rainfall patterns simulated for the period July 1997 to June 1998. In the text version only selected months will be shown, the full set of Figures is provided in the appendix. Since there are no observations dividing precipitation into convective and large scale, we will only discuss the total precipitation. As already mentioned
15
before, REMO is in general overestimating the total domain mean rainfall by a factor of two, while REMO-CCFM provides the correct total domain mean precipitation, but overestimates precipitation over land and underestimates over sea. Land based rain gauges are sparse and the blended rainfall data have errors up to 40%. It has to be expected that extreme rainfall events be not captured correctly by the observations.
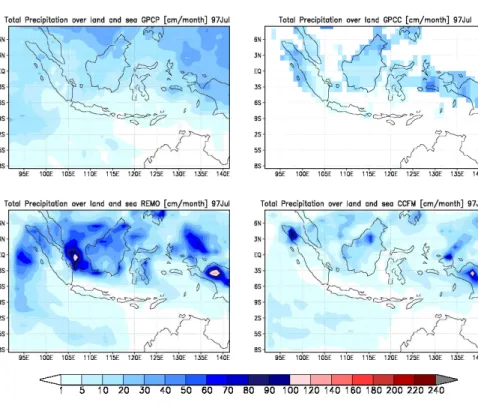
20
In July 1997 (Fig. 8) rainfall occurred mainly in the northern part of the model do-main, while Australia and the eastern islands of Indonesia remained dry. Both models simulate this general pattern correctly. Rainfall maxima are observed over the north-ern parts of Sumatra and Borneo and over Irian Jaya, the latter extending to the seas northwestward. Both models capture also these maxima, however with more patchy
25
patterns and higher maxima mainly over the highest mountains. REMO-CCFM under-estimates the GPCP observations over sea, but is otherwise in good agreement with these data. REMO severely overestimates precipitation over sea and shows extreme
ACPD
6, 10217–10246, 2006Evaluation convective cloud
field model
H.-F. Graf and J. Yang
Title Page Abstract Introduction Conclusions References Tables Figures J I J I Back Close
Full Screen / Esc
Printer-friendly Version Interactive Discussion
EGU
precipitation over the Strait of Malacca, which is not confirmed by the observations. In October 1997 (Fig. 9) the general South-North gradient in precipitation remains and first rainfall appears over the North of Australia. Maxima of rain are observed over the north of Sumatra, Borneo and Irian Jaya. These are well simulated by the models, however again the models produce extreme precipitation over the mountainous areas
5
and REMO, in addition, simulates extreme precipitation over the seas northwest of Borneo. REMO-CCFM seems to do a better job here. Both models obtain more rainfall over the western part of the Indian Ocean than observed.
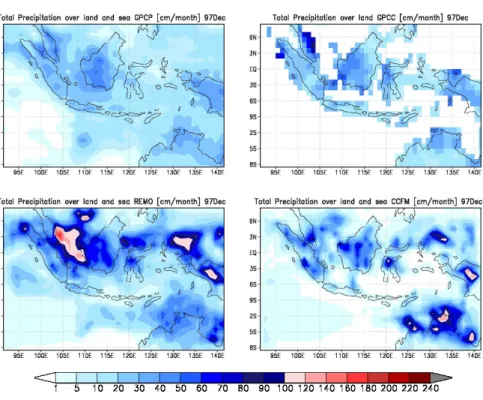
In December 1997(Fig. 10) observations and models show strong precipitation over the whole area with maxima over land. Again REMO in contrast to observations
pro-10
duces extreme rainfall over the Strait of Malacca, but apart from a positive bias is close to GPCC rain gauge observations over land. REMO-CCFM overestimates the rainfall over North Australia and seems to concentrate precipitation more than observed at single grid cells. While part of this may be explained by the very coarse observations, which tend to smooth the pattern, it is suggested to also be a result of linking the initial
15
size of the largest cloud type to the PBL height and the use of TKE as initial cloud base velocity. In areas where there are higher mountains and over land this may lead to deeper convective clouds producing extreme precipitation. We find this behaviour during the whole winter monsoon season. During this period a surplus of water vapour is available in the PBL and this feeds the convective clouds. However, apart from North
20
Australia, where REMO remains close to observations, the standard model is heavily overestimating rainfall especially over the sea.
In March 1998 (Fig. 11) the winter monsoon still is active providing abundant precipi-tation in the whole area, but retreating first in the north of the model domain. Both mod-els show clearly their deficits: REMO is strongly overestimating rain over the oceans
25
and REMO-CCFM underestimates over large parts of the warm pool area waters. Still REMO-CCFM simulates too heavy rainfall over North Australia and West Sumatra and both models produce unrealistic rainfall over Irian Jaya.
ACPD
6, 10217–10246, 2006Evaluation convective cloud
field model
H.-F. Graf and J. Yang
Title Page Abstract Introduction Conclusions References Tables Figures J I J I Back Close
Full Screen / Esc
Printer-friendly Version Interactive Discussion
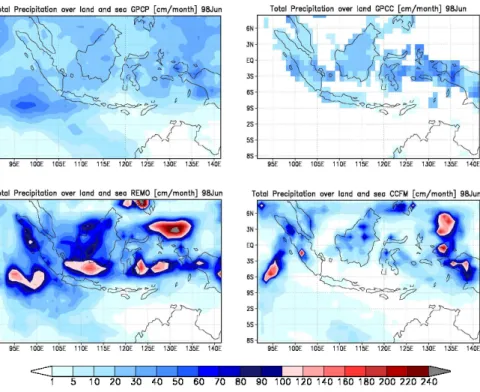
until midsummer. In June (Fig. 12) still most of our model domain received consid-erable rainfall, excluding North Australia and the eastern islands of Indonesia. Again REMO simulates unrealistic areas of extreme rainfall over the sea, some of them, but not all, also apparent in REMO-CCFM. The observations, in part because of the rea-sons already discussed above, provide a smoother distribution of precipitation than the
5
models, especially REMO-CCFM, do. REMO-CCFM still underestimates precipitation over the sea.
4 Conclusions
In this study we provide the first comprehensive test of a newly developed Convective Cloud Field Model (Nober and Graf, 2005) by implementing it in the limited area model
10
REMO with a resolution of 0.5 degrees over the Maritime Continent. We simulated a whole year (July 1997 to June 1998) running the model in the climate mode. The model is initialised by ECMWF ERA40 reanalysis data on the whole domain at 1 June 1997 and later on is forced at its boundaries by these data every 6 h. We compare the model precipitation with two different observational data sets. Since CCFM was developed for
15
use in coarse grid climate models, where its ability to utilise principles of self organisa-tion of convective clouds is much better suited than in a 0.5 degree resoluorganisa-tion, this is a test at the edge of potential use. We find that CCFM can run in a limited area model without problems of stability. REMO-CCFM outperforms the standard REMO with re-gard to the total domain precipitation throughout the one-year simulation, but shifts
20
precipitation from sea to land. REMO-CCFM seems to underestimate the daily cycle of convective precipitation leading to a higher contribution of large scale to total precipita-tion. This is suggested to be due to too few convective clouds producing rainfall. On the other hand, standard REMO overestimates the amplitude of the convective rain daily cycle and has too little contribution of large scale to total precipitation. REMO-CCFM,
25
though not being perfect, in many cases produces simulations of precipitation patterns over the Maritime Continent matching observations better than standard REMO
simu-ACPD
6, 10217–10246, 2006Evaluation convective cloud
field model
H.-F. Graf and J. Yang
Title Page Abstract Introduction Conclusions References Tables Figures J I J I Back Close
Full Screen / Esc
Printer-friendly Version Interactive Discussion
EGU
lations. Of specific value is that REMO-CCFM overcomes problems of standard REMO regarding unrealistically high precipitation rates over the oceans. REMO-CCFM also suffers from such extreme precipitation “hot spots”, but these are mainly located over land in areas with either high mountains (like Irian Jaya and North Sumatra) or a strong convergence like North Australia. We think that the main reason for these extremes is
5
that we couple the maximum size of the initial radius of convective clouds directly to the height of the planetary boundary layer. This is enhanced over land and especially over rough surfaces (mountains) leading to bigger and deeper clouds there produc-ing more precipitation. Improvproduc-ing the estimation of the maximum initial cloud radius is therefore on top of our agenda in the near future and will hopefully improve the results.
10
The extreme precipitation along the coast of North Australia in REMO-CCFM is con-nected with problems of the treatment of strong horizontal wind shear on the vertical development of convective clouds. Obviously our approach was not effective enough to suppress very deep convection by wind shear and so we will continue searching for a way to treat such phenomena connected with organised convection at fronts and
15
squall lines. We will also soon implement a cloud microphysics into our one dimen-sional cloud model that allows treatment of the effects of aerosols on rain formation, which possibly is of great importance during the biomass-burning season. While these problems seem to be solvable at least to a certain degree in the future, one problem will remain when CCFM is used in a model of higher resolution: It is not possible to
gen-20
erate an ensemble of convective clouds big enough to allow efficient self organisation of the cloud spectrum. Overall we are confident that CCFM is a potential tool to treat convective clouds in atmospheric models. Certainly its use at resolutions below one degree will always remain problematic as this conflicts with the stochastic approach of the method, which requires a large enough ensemble of convective clouds to allow
25
self-organisation to become efficient.
Acknowledgements. This work was sponsored by European Commission FW6, Asia-pro-Eco
ACPD
6, 10217–10246, 2006Evaluation convective cloud
field model
H.-F. Graf and J. Yang
Title Page Abstract Introduction Conclusions References Tables Figures J I J I Back Close
Full Screen / Esc
Printer-friendly Version Interactive Discussion
References
Adler, R. F., Huffman, G. J., Chang, A., Ferraro, R., Xie, P., Janowiak, J., Rudolf, B., Schneider, U., Curtis, S., Bolvin, D., Gruber, A., Susskind, J., and Arkin, P.: The Version 2 Global Precipitation Climatology Project (GPCP) Monthly Precipitation Analysis (1979–present), J. Hydrometeorol., 4, 1147–1167, 2003.
5
Anthes, R. A.: A cumulus parameterisation scheme utilizing a one dimensional cloud model, Mon. Wea. Rev., 105, 270–286, 1977.
Arakawa, A. and Schubert, W. H.: Interaction of a cumulus ensemble with the large-scale environment, Part 1, J. Atmos. Sci., 31, 674–701, 1974.
Betts, A. K.: A new convective adjustment scheme. Part I: Observational and theoretical basis,
10
Q. J. R. Meteorol. Soc., 112, 677–691, 1986.
Betts, A. K. and Miller, M. J.: A new convective adjustment scheme. Part II: Single column tests using GATE wave, BOMEX, ATEX and arctic air-mass data sets, Q. J. R. Meteorol. Soc., 112, 693–709, 1986.
Donner, L. J.: A cumulus parameterisation including mass fluxes, vertical momentum dynamics,
15
and mesoscale effects, J. Atmos. Sci., 50, 889–906, 1993.
Donner, L. J., Seman, C. J., Hemler, R. S., and Fan, S.: A cumulus parameterisation including mass fluxes, vertical momentum dynamics, and mesoscale effects: Thermodynamic and hydrological aspects in a general circulation model, J. Clim., 14, 3444–3463, 2001.
Emanuel, K. A.: Atmospheric Convection, Oxford University Press, 1994.
20
Emanuel, K. A. and Raymond, D. J.: The Representation of Cumulus Convection in Numeri-cal Models. MeteorologiNumeri-cal Monographs, Published by the American MeteorologiNumeri-cal Society, 1993.
Grabowski, W. W.: Impact of cloud microphysics on convective-radiative quasi equilibrium re-vealed by cloud-resolving convection parameterization, J. Climate, 16, 3463–3475, 2003.
25
Graf, H.-F.: The complex interaction of aerosols and clouds, Science, 303, 1309–1311, 2004 Huffmann, G. J., Adler, R. F., Arkin, P., Chang, A., Ferraro, R., Gruber, A., Janowiak, J., McNab,
A., Rudolf, B., and Schneider, U.: The Global Precipitation Climatology Project (GPCP) combined precipitation dataset, Bull. Am. Meteorol. Soc., 78, 5–20, 1997.
Jacob, D.: A note on the simulation of the annual and inter-annual variabiolity of the water
30
budget over the Baltic Sea drainage basin, Meterol. Atmos. Phys., 77, 61–73, 2001.
ACPD
6, 10217–10246, 2006Evaluation convective cloud
field model
H.-F. Graf and J. Yang
Title Page Abstract Introduction Conclusions References Tables Figures J I J I Back Close
Full Screen / Esc
Printer-friendly Version Interactive Discussion
EGU
application in convective parameterisation, J. Atmos. Sci., 47, 2784–2802, 1990.
Kessler, E.: On the distribution and continuity of water substance in atmospheric circulation models, Meteorol. Monographs, 10, Amer. Meteorol. Soc., Boston, MA, 1969.
Kreitzberg, C. W. and Perkey, D.: Release of potential instability. Part 1: A seqeuntial plume model within a hydrostatic primitive equation model, J. Atmos. Sci., 33, 456–475, 1976.
5
Kreitzberg, C. W. and Perkey, D.: Release of potential instability. Part 2: The mechanism of convective /mesoscale interaction, J. Atmos. Sci., 34, 1569–1595, 1977.
Kuo, H. L.: On formation and intensification of tropical cyclones through latent heat release by cumulus convection, J. Atmos. Sci., 22, 40–63, 1965.
Kuo, H. L.: Further studies of the parameterisation of the influence of cumulus convection on
10
the large-scale flow, J. Atmos. Sci., 31, 1232–1240, 1974.
Langmann, B. and Heil, A.: Release and dispersion of vegetation and peat fire emissions in the atmosphere over Indonesia 1997/98, Atmos. Chem. Phys., 4, 2145–2160, 2004.
Lohmann, U., Feichter, J., Chuang, C. C., and Penner, J. E.: Predicting the number of cloud droplets in the ECHAM GCM, J. Geophys. Res., 104, 9169–9198, 1999.
15
Majewski, D.: The Europa Modell of the Deutsche Wetterdienst, Seminar Proceedings ECMWF, 2, 147–191, 1991.
Mori, S., Hamada, J.-I., Tauhid, Y. I., Yamanaka, M. D., Okamoto, N., Murata, F., Sakurai, N., Hashiguchi, H., and T. Sribimawati: Diurnal Land-Sea Rainfall Peak Migration over Sumatera Island, Indonesian Maritime Continent, Observed by TRMM Satellite and Intensive
Rawin-20
sonde Soundings, Mon. Wea. Rev., 132, 2021–2039, 2004.
Naveau, P. and Moncrieff, M. W.: A Statistical Formulation of Convective Mass Fluxes, Q. J. R. Meteorol. Soc., 129, Part A, 592, 2217–2233, 2003.
Nober, F. J. and Graf, H.-F.: A new convective cloud field model based on principles of self-organisation, Atmos. Chem. Phys., 5, 2749–2759, 2005.
25
Ogura, Y. and Takahashi, T.: Numerical simulation of the life cycle of a thunderstorm cell., Mon. Wea. Rev., 99, 895–911, 1971.
Roeckner, E., Arpe, K., Bengtson, L., Christoph, M., Claussen, M., Duemenil, L., Esch. M., Giorgetta, M., Schlese, U., and Schulzweida, U.: The atmospheric general circulation model ECHAM4: Model description and simulation of present day climate, MPI Report 218,
Max-30
Planck-institute for Meteorology, Hamburg, 1996.
Tiedtke, M.: A comprehensive mass flux scheme for cumulus cloud parameterisation in large-scale models, Q. J. R. Meteorol. Soc., 117, 1779–1800, 1989.
ACPD
6, 10217–10246, 2006Evaluation convective cloud
field model
H.-F. Graf and J. Yang
Title Page Abstract Introduction Conclusions References Tables Figures J I J I Back Close
Full Screen / Esc
Printer-friendly Version Interactive Discussion
Zhang, J., Lohmann, U., and Stier, P.: A Microphysical Parameterization for Convective Clouds in the ECHAM5 Climate Model: Single Column Model Results Evaluated at the Oklahoma ARM Site, J. Geophys. Res., 110, D15S07, doi:10.1029/2004JD005128, 2005.
ACPD
6, 10217–10246, 2006Evaluation convective cloud
field model
H.-F. Graf and J. Yang
Title Page Abstract Introduction Conclusions References Tables Figures J I J I Back Close
Full Screen / Esc
Printer-friendly Version Interactive Discussion
EGU
Fig. 1. The number of rain gauges per 1 degree grid cells of the GPCC data set, taken from
ACPD
6, 10217–10246, 2006Evaluation convective cloud
field model
H.-F. Graf and J. Yang
Title Page Abstract Introduction Conclusions References Tables Figures J I J I Back Close
Full Screen / Esc
Printer-friendly Version Interactive Discussion 0 100 200 300 400 500 9707 9708 9709 9710 9711 9712 9801 9802 9803 9804 9805 9806 Precipitation (mm/month) Jul 1997 - Jun 1998
Area mean rainfall on model region Jul 1997 to Jun 1998
GPCP REMO CCFM 0 100 200 300 400 500 9707 9708 9709 9710 9711 9712 9801 9802 9803 9804 9805 9806 Precipitation (mm/month) Jul 1997 - Jun 1998
Area mean rainfall over land Jul 1997 to Jun 1998
GPCC REMO CCFM
Fig. 2. Total precipitation for July 1997 to June 1998: (a) over the whole model domain from
REMO, REMO-CCFM simulation and GPCP observations,(b) as (a) but only land grids and
ACPD
6, 10217–10246, 2006Evaluation convective cloud
field model
H.-F. Graf and J. Yang
Title Page Abstract Introduction Conclusions References Tables Figures J I J I Back Close
Full Screen / Esc
Printer-friendly Version Interactive Discussion EGU 0 0.1 0.2 0.3 0.4 0.5 0.6 0.7 0.8 0.9 1 0 2 4 6 8 10 12 14 16 18 20 22
rainfall intensity (mm/hour)
Local Time
Annual mean daily cylce over land grids Jul97 to Jun98
CCFM convective CCFM large CCFM total TIEDTKE convective TIEDTKE large TIEDTKE total 0 0.1 0.2 0.3 0.4 0.5 0.6 0.7 0.8 0.9 1 0 2 4 6 8 10 12 14 16 18 20 22
rainfall intensity (mm/hour)
Local Time
Annual mean daily cycle over sea grids Jul97 to Jun98
CCFM convective CCFM large CCFM total TIEDTKE convective TIEDTKE large TIEDTKE total
Fig. 3. Annual mean daily cycle of convective, large scale and total precipitation simulated with
ACPD
6, 10217–10246, 2006Evaluation convective cloud
field model
H.-F. Graf and J. Yang
Title Page Abstract Introduction Conclusions References Tables Figures J I J I Back Close
Full Screen / Esc
Printer-friendly Version Interactive Discussion 0 0.1 0.2 0.3 0.4 0.5 0.6 0.7 0.8 0.9 1 0 2 4 6 8 10 12 14 16 18 20 22
rainfall intensity (mm/hour)
Local Time
Annual mean daily cylce over land grids Jul97 to Jun98
CCFM convective CCFM large CCFM total TIEDTKE convective TIEDTKE large TIEDTKE total 0 0.1 0.2 0.3 0.4 0.5 0.6 0.7 0.8 0.9 1 0 2 4 6 8 10 12 14 16 18 20 22
rainfall intensity (mm/hour)
Local Time
Annual mean daily cycle over sea grids Jul97 to Jun98
CCFM convective CCFM large CCFM total TIEDTKE convective TIEDTKE large TIEDTKE total
Fig. 4. Annual mean cycle of convective, large scale and total precipitation simulated with
REMO (Tiedtke-scheme) and REMO-CCFM over land(a) and sea (b) grids, only data from grid
ACPD
6, 10217–10246, 2006Evaluation convective cloud
field model
H.-F. Graf and J. Yang
Title Page Abstract Introduction Conclusions References Tables Figures J I J I Back Close
Full Screen / Esc
Printer-friendly Version Interactive Discussion
EGU
Fig. 5. The contribution of small (type 1), medium (type 2) and large (type 3) convective clouds
ACPD
6, 10217–10246, 2006Evaluation convective cloud
field model
H.-F. Graf and J. Yang
Title Page Abstract Introduction Conclusions References Tables Figures J I J I Back Close
Full Screen / Esc
Printer-friendly Version Interactive Discussion 0 0.1 0.2 0.3 0.4 0.5 0.6 0.7 0.8 0.9 1 0 2 4 6 8 10 12 14 16 18 20 22
rainfall intensity (mm/hour)
Local Time
Monthly mean daily cycle over land grids Aug97 to Sep98
CCFM convective CCFM large CCFM total TIEDTKE convective TIEDTKE large TIEDTKE total 0 0.1 0.2 0.3 0.4 0.5 0.6 0.7 0.8 0.9 1 0 2 4 6 8 10 12 14 16 18 20 22
rainfall intensity (mm/hour)
Local Time
Monthly mean daily cycle over land grids Aug97 to Sep98
CCFM convective CCFM large CCFM total TIEDTKE convective TIEDTKE large TIEDTKE total 0 0.1 0.2 0.3 0.4 0.5 0.6 0.7 0.8 0.9 1 0 2 4 6 8 10 12 14 16 18 20 22
rainfall intensity (mm/hour)
Local Time
Monthly mean daily cycle over sea grids Aug97 to Sep98
CCFM convective CCFM large CCFM total TIEDTKE convective TIEDTKE large TIEDTKE total 0 0.1 0.2 0.3 0.4 0.5 0.6 0.7 0.8 0.9 1 0 2 4 6 8 10 12 14 16 18 20 22
rainfall intensity (mm/hour)
Local Time
Monthly mean daily cycle over sea grids Aug97 to Sep98
CCFM convective CCFM large CCFM total TIEDTKE convective TIEDTKE large TIEDTKE total
Fig. 6. Daily cycle of rainfall in the dry season (August and September 1997) for land (top row)
and sea (bottom row) grids. Mean over all time steps (left) and those time steps only when convective rain occurs (right).
ACPD
6, 10217–10246, 2006Evaluation convective cloud
field model
H.-F. Graf and J. Yang
Title Page Abstract Introduction Conclusions References Tables Figures J I J I Back Close
Full Screen / Esc
Printer-friendly Version Interactive Discussion EGU 0 0.1 0.2 0.3 0.4 0.5 0.6 0.7 0.8 0.9 1 0 2 4 6 8 10 12 14 16 18 20 22
rainfall intensity (mm/hour)
Local Time
Monthly mean daily cycle over land grids Dec97 to Jan98 CCFM convective CCFM large CCFM total TIEDTKE convective TIEDTKE large TIEDTKE total 0 0.1 0.2 0.3 0.4 0.5 0.6 0.7 0.8 0.9 1 0 2 4 6 8 10 12 14 16 18 20 22
rainfall intensity (mm/hour)
Local Time
Monthly mean daily cycle over land grids Dec97 to Jan98 CCFM convective CCFM large CCFM total TIEDTKE convective TIEDTKE large TIEDTKE total 0 0.1 0.2 0.3 0.4 0.5 0.6 0.7 0.8 0.9 1 0 2 4 6 8 10 12 14 16 18 20 22
rainfall intensity (mm/hour)
Local Time
Monthly mean daily cycle over sea grids Dec97 to Jan98 CCFM convective CCFM large CCFM total TIEDTKE convective TIEDTKE large TIEDTKE total 0 0.1 0.2 0.3 0.4 0.5 0.6 0.7 0.8 0.9 1 0 2 4 6 8 10 12 14 16 18 20 22
rainfall intensity (mm/hour)
Local Time
Monthly mean daily cycle over sea grids Dec97 to Jan98 CCFM convective CCFM large CCFM total TIEDTKE convective TIEDTKE large TIEDTKE total
Fig. 7. Daily cycle of rainfall in the wet season (December 1997 and January 1998) for land
(top row) and sea (bottom row) grids. Mean over all time steps (left) and those time steps only when convective rain occurs (right).
ACPD
6, 10217–10246, 2006Evaluation convective cloud
field model
H.-F. Graf and J. Yang
Title Page Abstract Introduction Conclusions References Tables Figures J I J I Back Close
Full Screen / Esc
Printer-friendly Version Interactive Discussion
ACPD
6, 10217–10246, 2006Evaluation convective cloud
field model
H.-F. Graf and J. Yang
Title Page Abstract Introduction Conclusions References Tables Figures J I J I Back Close
Full Screen / Esc
Printer-friendly Version Interactive Discussion
EGU
ACPD
6, 10217–10246, 2006Evaluation convective cloud
field model
H.-F. Graf and J. Yang
Title Page Abstract Introduction Conclusions References Tables Figures J I J I Back Close
Full Screen / Esc
Printer-friendly Version Interactive Discussion
ACPD
6, 10217–10246, 2006Evaluation convective cloud
field model
H.-F. Graf and J. Yang
Title Page Abstract Introduction Conclusions References Tables Figures J I J I Back Close
Full Screen / Esc
Printer-friendly Version Interactive Discussion
EGU
ACPD
6, 10217–10246, 2006Evaluation convective cloud
field model
H.-F. Graf and J. Yang
Title Page Abstract Introduction Conclusions References Tables Figures J I J I Back Close
Full Screen / Esc
Printer-friendly Version Interactive Discussion