arXiv:1002.4917v3 [hep-ex] 23 Jun 2010
Measurement of direct photon pair production cross sections in p ¯
p collisions at
√
s = 1.96 TeV
V.M. Abazov36, B. Abbott74, M. Abolins63, B.S. Acharya29, M. Adams49, T. Adams47, E. Aguilo6, G.D. Alexeev36, G. Alkhazov40, A. Alton62,a, G. Alverson61, G.A. Alves2, L.S. Ancu35, M. Aoki48, Y. Arnoud14, M. Arov58, A. Askew47, B. ˚Asman41, O. Atramentov66, C. Avila8, J. BackusMayes81, F. Badaud13, L. Bagby48, B. Baldin48,
D.V. Bandurin47, S. Banerjee29, E. Barberis61, A.-F. Barfuss15, P. Baringer56, J. Barreto2, J.F. Bartlett48, U. Bassler18, S. Beale6, A. Bean56, M. Begalli3, M. Begel72, C. Belanger-Champagne41, L. Bellantoni48, J.A. Benitez63, S.B. Beri27, G. Bernardi17, R. Bernhard22, I. Bertram42, M. Besan¸con18, R. Beuselinck43,
V.A. Bezzubov39, P.C. Bhat48, V. Bhatnagar27, G. Blazey50, S. Blessing47, K. Bloom65, A. Boehnlein48, D. Boline60, T.A. Bolton57, E.E. Boos38, G. Borissov42, T. Bose60, A. Brandt77, R. Brock63, G. Brooijmans69, A. Bross48, D. Brown19, X.B. Bu7, D. Buchholz51, M. Buehler80, V. Buescher24, V. Bunichev38, S. Burdin42,b, T.H. Burnett81, C.P. Buszello43, P. Calfayan25, B. Calpas15, S. Calvet16, E. Camacho-P´erez33, J. Cammin70, M.A. Carrasco-Lizarraga33, E. Carrera47, B.C.K. Casey48, H. Castilla-Valdez33, S. Chakrabarti71, D. Chakraborty50, K.M. Chan54, A. Chandra79, G. Chen56, S. Chevalier-Th´ery18, D.K. Cho76, S.W. Cho31, S. Choi32, B. Choudhary28,
T. Christoudias43, S. Cihangir48, D. Claes65, J. Clutter56, M. Cooke48, W.E. Cooper48, M. Corcoran79, F. Couderc18, M.-C. Cousinou15, D. Cutts76, M. ´Cwiok30, A. Das45, G. Davies43, K. De77, S.J. de Jong35, E. De La Cruz-Burelo33, K. DeVaughan65, F. D´eliot18, M. Demarteau48, R. Demina70, D. Denisov48, S.P. Denisov39,
S. Desai48, H.T. Diehl48, M. Diesburg48, A. Dominguez65, T. Dorland81, A. Dubey28, L.V. Dudko38, L. Duflot16, D. Duggan66, A. Duperrin15, S. Dutt27, A. Dyshkant50, M. Eads65, D. Edmunds63, J. Ellison46, V.D. Elvira48,
Y. Enari17, S. Eno59, H. Evans52, A. Evdokimov72, V.N. Evdokimov39, G. Facini61, A.V. Ferapontov76, T. Ferbel59,70, F. Fiedler24, F. Filthaut35, W. Fisher63, H.E. Fisk48, M. Fortner50, H. Fox42, S. Fuess48, T. Gadfort72,
A. Garcia-Bellido70, V. Gavrilov37, P. Gay13, W. Geist19, W. Geng15,63, D. Gerbaudo67, C.E. Gerber49, Y. Gershtein66, D. Gillberg6, G. Ginther48,70, G. Golovanov36, B. G´omez8, A. Goussiou81, P.D. Grannis71,
S. Greder19, H. Greenlee48, Z.D. Greenwood58, E.M. Gregores4, G. Grenier20, Ph. Gris13, J.-F. Grivaz16, A. Grohsjean18, S. Gr¨unendahl48, M.W. Gr¨unewald30, F. Guo71, J. Guo71, G. Gutierrez48, P. Gutierrez74, A. Haas69,c, P. Haefner25, S. Hagopian47, J. Haley61, I. Hall63, L. Han7, K. Harder44, A. Harel70, J.M. Hauptman55,
J. Hays43, T. Hebbeker21, D. Hedin50, A.P. Heinson46, U. Heintz76, C. Hensel23, I. Heredia-De La Cruz33, K. Herner62, G. Hesketh61, M.D. Hildreth54, R. Hirosky80, T. Hoang47, J.D. Hobbs71, B. Hoeneisen12, M. Hohlfeld24,
S. Hossain74, P. Houben34, Y. Hu71, Z. Hubacek10, N. Huske17, V. Hynek10, I. Iashvili68, R. Illingworth48, A.S. Ito48, S. Jabeen76, M. Jaffr´e16, S. Jain68, D. Jamin15, R. Jesik43, K. Johns45, C. Johnson69, M. Johnson48,
D. Johnston65, A. Jonckheere48, P. Jonsson43, A. Juste48,d, E. Kajfasz15, D. Karmanov38, P.A. Kasper48, I. Katsanos65, R. Kehoe78, S. Kermiche15, N. Khalatyan48, A. Khanov75, A. Kharchilava68, Y.N. Kharzheev36, D. Khatidze76, M.H. Kirby51, M. Kirsch21, J.M. Kohli27, A.V. Kozelov39, J. Kraus63, A. Kumar68, A. Kupco11,
T. Kurˇca20, V.A. Kuzmin38, J. Kvita9, S. Lammers52, G. Landsberg76, P. Lebrun20, H.S. Lee31, W.M. Lee48, J. Lellouch17, L. Li46, Q.Z. Li48, S.M. Lietti5, J.K. Lim31, D. Lincoln48, J. Linnemann63, V.V. Lipaev39, R. Lipton48, Y. Liu7, Z. Liu6, A. Lobodenko40, M. Lokajicek11, P. Love42, H.J. Lubatti81, R. Luna-Garcia33,e,
A.L. Lyon48, A.K.A. Maciel2, D. Mackin79, R. Maga˜na-Villalba33, P.K. Mal45, S. Malik65, V.L. Malyshev36, Y. Maravin57, J. Mart´ınez-Ortega33, R. McCarthy71, C.L. McGivern56, M.M. Meijer35, A. Melnitchouk64, L. Mendoza8, D. Menezes50, P.G. Mercadante4, M. Merkin38, A. Meyer21, J. Meyer23, N.K. Mondal29, T. Moulik56,
G.S. Muanza15, M. Mulhearn80, E. Nagy15, M. Naimuddin28, M. Narain76, R. Nayyar28, H.A. Neal62, J.P. Negret8, P. Neustroev40, H. Nilsen22, S.F. Novaes5, T. Nunnemann25, G. Obrant40, D. Onoprienko57,
J. Orduna33, N. Osman43, J. Osta54, G.J. Otero y Garz´on1, M. Owen44, M. Padilla46, M. Pangilinan76, N. Parashar53, V. Parihar76, S.-J. Park23, S.K. Park31, J. Parsons69, R. Partridge76, N. Parua52, A. Patwa72,
B. Penning48, M. Perfilov38, K. Peters44, Y. Peters44, P. P´etroff16, R. Piegaia1, J. Piper63, M.-A. Pleier72, P.L.M. Podesta-Lerma33,f, V.M. Podstavkov48, M.-E. Pol2, P. Polozov37, A.V. Popov39, M. Prewitt79, D. Price52, S. Protopopescu72, J. Qian62, A. Quadt23, B. Quinn64, M.S. Rangel16, K. Ranjan28, P.N. Ratoff42, I. Razumov39,
P. Renkel78, P. Rich44, M. Rijssenbeek71, I. Ripp-Baudot19, F. Rizatdinova75, M. Rominsky48, C. Royon18, P. Rubinov48, R. Ruchti54, G. Safronov37, G. Sajot14, A. S´anchez-Hern´andez33, M.P. Sanders25, B. Sanghi48,
T. Schliephake26, S. Schlobohm81, C. Schwanenberger44, R. Schwienhorst63, J. Sekaric56, H. Severini74, E. Shabalina23, V. Shary18, A.A. Shchukin39, R.K. Shivpuri28, V. Simak10, V. Sirotenko48, P. Skubic74, P. Slattery70, D. Smirnov54, G.R. Snow65, J. Snow73, S. Snyder72, S. S¨oldner-Rembold44, L. Sonnenschein21,
A. Sopczak42, M. Sosebee77, K. Soustruznik9, B. Spurlock77, J. Stark14, V. Stolin37, D.A. Stoyanova39, M.A. Strang68, E. Strauss71, M. Strauss74, R. Str¨ohmer25, D. Strom49, L. Stutte48, P. Svoisky35, M. Takahashi44, A. Tanasijczuk1, W. Taylor6, B. Tiller25, M. Titov18, V.V. Tokmenin36, D. Tsybychev71, B. Tuchming18, C. Tully67,
P.M. Tuts69, R. Unalan63, L. Uvarov40, S. Uvarov40, S. Uzunyan50, R. Van Kooten52, W.M. van Leeuwen34, N. Varelas49, E.W. Varnes45, I.A. Vasilyev39, P. Verdier20, L.S. Vertogradov36, M. Verzocchi48, M. Vesterinen44,
D. Vilanova18, P. Vint43, P. Vokac10, H.D. Wahl47, M.H.L.S. Wang70, J. Warchol54, G. Watts81, M. Wayne54, G. Weber24, M. Weber48,g, M. Wetstein59, A. White77, D. Wicke24, M.R.J. Williams42, G.W. Wilson56, S.J. Wimpenny46, M. Wobisch58, D.R. Wood61, T.R. Wyatt44, Y. Xie48, C. Xu62, S. Yacoob51, R. Yamada48,
W.-C. Yang44, T. Yasuda48, Y.A. Yatsunenko36, Z. Ye48, H. Yin7, K. Yip72, H.D. Yoo76, S.W. Youn48, J. Yu77, S. Zelitch80, T. Zhao81, B. Zhou62, J. Zhu71, M. Zielinski70, D. Zieminska52, and L. Zivkovic69
(The DØ Collaboration)
1Universidad de Buenos Aires, Buenos Aires, Argentina 2LAFEX, Centro Brasileiro de Pesquisas F´ısicas, Rio de Janeiro, Brazil
3Universidade do Estado do Rio de Janeiro, Rio de Janeiro, Brazil 4Universidade Federal do ABC, Santo Andr´e, Brazil
5Instituto de F´ısica Te´orica, Universidade Estadual Paulista, S˜ao Paulo, Brazil 6Simon Fraser University, Burnaby, British Columbia,
Canada; and York University, Toronto, Ontario, Canada
7University of Science and Technology of China, Hefei, People’s Republic of China 8Universidad de los Andes, Bogot´a, Colombia
9Center for Particle Physics, Charles University, Faculty of Mathematics and Physics, Prague, Czech Republic 10Czech Technical University in Prague, Prague, Czech Republic
11Center for Particle Physics, Institute of Physics,
Academy of Sciences of the Czech Republic, Prague, Czech Republic 12Universidad San Francisco de Quito, Quito, Ecuador 13LPC, Universit´e Blaise Pascal, CNRS/IN2P3, Clermont, France
14LPSC, Universit´e Joseph Fourier Grenoble 1, CNRS/IN2P3, Institut National Polytechnique de Grenoble, Grenoble, France 15CPPM, Aix-Marseille Universit´e, CNRS/IN2P3, Marseille, France
16LAL, Universit´e Paris-Sud, IN2P3/CNRS, Orsay, France 17LPNHE, Universit´es Paris VI and VII, CNRS/IN2P3, Paris, France
18CEA, Irfu, SPP, Saclay, France
19IPHC, Universit´e de Strasbourg, CNRS/IN2P3, Strasbourg, France
20IPNL, Universit´e Lyon 1, CNRS/IN2P3, Villeurbanne, France and Universit´e de Lyon, Lyon, France 21III. Physikalisches Institut A, RWTH Aachen University, Aachen, Germany
22Physikalisches Institut, Universit¨at Freiburg, Freiburg, Germany
23II. Physikalisches Institut, Georg-August-Universit¨at G¨ottingen, G¨ottingen, Germany 24Institut f¨ur Physik, Universit¨at Mainz, Mainz, Germany
25Ludwig-Maximilians-Universit¨at M¨unchen, M¨unchen, Germany 26Fachbereich Physik, University of Wuppertal, Wuppertal, Germany
27Panjab University, Chandigarh, India 28Delhi University, Delhi, India
29Tata Institute of Fundamental Research, Mumbai, India 30University College Dublin, Dublin, Ireland
31Korea Detector Laboratory, Korea University, Seoul, Korea 32SungKyunKwan University, Suwon, Korea
33CINVESTAV, Mexico City, Mexico
34FOM-Institute NIKHEF and University of Amsterdam/NIKHEF, Amsterdam, The Netherlands 35Radboud University Nijmegen/NIKHEF, Nijmegen, The Netherlands
36Joint Institute for Nuclear Research, Dubna, Russia 37Institute for Theoretical and Experimental Physics, Moscow, Russia
38Moscow State University, Moscow, Russia 39Institute for High Energy Physics, Protvino, Russia 40Petersburg Nuclear Physics Institute, St. Petersburg, Russia
42Lancaster University, Lancaster LA1 4YB, United Kingdom 43Imperial College London, London SW7 2AZ, United Kingdom 44The University of Manchester, Manchester M13 9PL, United Kingdom
45University of Arizona, Tucson, Arizona 85721, USA 46University of California Riverside, Riverside, California 92521, USA
47Florida State University, Tallahassee, Florida 32306, USA 48Fermi National Accelerator Laboratory, Batavia, Illinois 60510, USA
49University of Illinois at Chicago, Chicago, Illinois 60607, USA 50Northern Illinois University, DeKalb, Illinois 60115, USA
51Northwestern University, Evanston, Illinois 60208, USA 52Indiana University, Bloomington, Indiana 47405, USA 53Purdue University Calumet, Hammond, Indiana 46323, USA 54University of Notre Dame, Notre Dame, Indiana 46556, USA
55Iowa State University, Ames, Iowa 50011, USA 56University of Kansas, Lawrence, Kansas 66045, USA 57Kansas State University, Manhattan, Kansas 66506, USA 58Louisiana Tech University, Ruston, Louisiana 71272, USA 59University of Maryland, College Park, Maryland 20742, USA
60Boston University, Boston, Massachusetts 02215, USA 61Northeastern University, Boston, Massachusetts 02115, USA
62University of Michigan, Ann Arbor, Michigan 48109, USA 63Michigan State University, East Lansing, Michigan 48824, USA
64University of Mississippi, University, Mississippi 38677, USA 65University of Nebraska, Lincoln, Nebraska 68588, USA 66Rutgers University, Piscataway, New Jersey 08855, USA 67Princeton University, Princeton, New Jersey 08544, USA 68State University of New York, Buffalo, New York 14260, USA
69Columbia University, New York, New York 10027, USA 70University of Rochester, Rochester, New York 14627, USA 71State University of New York, Stony Brook, New York 11794, USA
72Brookhaven National Laboratory, Upton, New York 11973, USA 73Langston University, Langston, Oklahoma 73050, USA 74University of Oklahoma, Norman, Oklahoma 73019, USA 75Oklahoma State University, Stillwater, Oklahoma 74078, USA
76Brown University, Providence, Rhode Island 02912, USA 77University of Texas, Arlington, Texas 76019, USA 78Southern Methodist University, Dallas, Texas 75275, USA
79Rice University, Houston, Texas 77005, USA
80University of Virginia, Charlottesville, Virginia 22901, USA and 81University of Washington, Seattle, Washington 98195, USA
(Dated: May 12, 2010)
We present a measurement of direct photon pair production cross sections using 4.2 fb−1 of data collected with the D0 detector at the Fermilab Tevatron p¯p Collider. We measure single differential cross sections as a function of the diphoton mass, the transverse momentum of the diphoton system, the azimuthal angle between the photons, and the polar scattering angle of the photons. In addition, we measure double differential cross sections considering the last three kinematic variables in three diphoton mass bins. The results are compared with different perturbative QCD predictions and event generators.
PACS numbers: 13.85.Qk, 12.38.Qk
At a hadron collider, the direct photon pair (DPP) pro-duction with large diphoton invariant mass (Mγγ) cons-titutes a large and irreducible background to searches for the Higgs boson decaying into a pair of photons, for both the Fermilab Tevatron [1] and the CERN LHC experiments [2]. DPP production is also a significant background in searches for new phenomena, such as new heavy resonances [3], extra spatial dimensions [4], or cas-cade decays of heavy new particles [5]. Thus, precise mea-surements of the diphoton differential production cross
sections for various kinematic variables and their theo-retical understanding are extremely important for future Higgs and new phenomena searches.
In addition, DPP production is interesting in its own right, and is used to check the validity of the predictions of perturbative quantum chromodynamics (pQCD) and soft-gluon resummation methods implemented in theo-retical calculations. Measurements involving the dipho-ton final state have been previously carried out at fixed-target [6, 7] and collider [8–10] experiments. However,
the large integrated luminosity accumulated by the D0 experiment in p¯p collisions at √s = 1.96 TeV at the Fermilab Tevatron Collider allows us to perform precise measurements of several observables in kinematic regions previously unexplored, as well as, for the first time, the measurement of double differential cross sections for this process.
The DPP events produced in p¯p → γγ+X are expected to be dominantly produced via q ¯q scattering (q ¯q → γγ) and gluon-gluon fusion (gg → γγ) through a quark-loop diagram. In spite of the suppression factor of α2
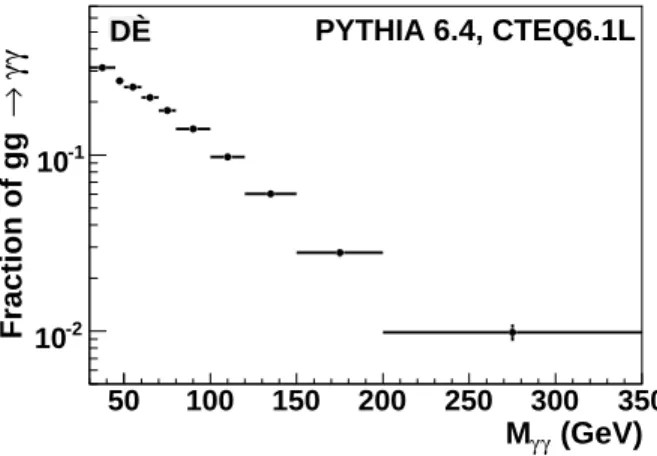
s for gg → γγ as compared to q¯q → γγ, the former still gives a significant contribution in kinematic regions where the gg parton luminosity is high, especially at low Mγγ. Figure 1 shows the expected contribution to the total DPP rate from gg → γγ, as predicted by the pythia [11] Monte Carlo (MC) event generator with the CTEQ6.1L parton distribution function (PDF) set [12]. In addition, direct photons may result from single or double fragmentation processes of the partons produced in the hard scattering [13, 14]. However, a strict photon isolation requirement significantly reduces the rate for these processes.
(GeV) γ γ M 50 100 150 200 250 300 350 γγ → Fraction of gg 10-2 -1 10 DØ PYTHIA 6.4, CTEQ6.1L
FIG. 1: The fraction of events produced via gg → γγ scat-tering relative to total diphoton production as a function of Mγγ, as predicted by the pythia event generator using the CTEQ6.1L PDF set. Photons are required to have transverse momentum pT > 21(20) GeV for the highest (next-to-highest) pT photon and pseudorapidity |η| < 0.9 [15].
In this Letter, we present measurements of the DPP production cross sections using data collected by the D0 experiment from August 2006 to June 2009. The cross sections are measured differentially as a function of Mγγ, the diphoton transverse momentum (pγγT ), the azimuthal angle between the photons (∆φγγ), and the cosine of the polar scattering angle of the photon in the frame with no net transverse momentum of the diphoton sys-tem (defined as cos θ∗ = tanh[(η
1− η2)/2], where η1(2) is the pseudorapidity of the highest (next-to-highest) pT photon). These kinematic variables probe different as-pects of the DPP production mechanism. For instance, the shapes of the pγγT and ∆φγγ distributions are mostly
affected by initial state gluon radiation and fragmenta-tion effects. In addifragmenta-tion, the Mγγ spectrum is particu-larly sensitive to potential contributions from new phe-nomena. The cos θ∗ distribution probes PDF effects and the angular momentum of the final state, which should be different for QCD-mediated production as compared, for example, to the decay of a spin-0 Higgs boson [13]. The measured cross sections are compared to theoretical predictions from resbos [13], diphox [14], and pythia [11]. Both resbos and diphox provide next-to-leading order (NLO) predictions in pQCD, however the gg → γγ contribution is considered only at leading order (LO) in diphox. pythia is a parton shower MC event generator that includes the above processes at LO. In diphox, the explicit parton-to-photon fragmentation functions are in-cluded at NLO, while in resbos a function approximat-ing rate from the NLO fragmentation diagrams is intro-duced. Also, only in resbos, the effects of soft and collinear initial state gluon emissions are resummed to all orders. This is particularly important for the descrip-tion of the pγγT (∆φγγ) distribution, which is a δ-function at LO and diverges at NLO as pγγT → 0 (∆φγγ → π).
The D0 detector is a general purpose detector dis-cussed in detail elsewhere [16]. The subdetectors most relevant to this analysis are the central tracking system, composed of a silicon microstrip tracker (SMT) and a central fiber tracker (CFT) embedded in a 2 T solenoidal magnetic field, the central preshower detector (CPS), and the calorimeter. The CPS is located immediately before the inner layer of the calorimeter and is formed of approx-imately one radiation length of lead absorber followed by three layers of scintillating strips. The calorimeter con-sists of a central section with coverage in pseudorapidity of |ηdet| < 1.1 [15], and two end calorimeters covering up to |ηdet| ≈ 4.2. The electromagnetic (EM) section of the calorimeter is segmented longitudinally into four layers (EMi, i = 1, 4), with transverse segmentation into cells of size ∆ηdet× ∆φdet= 0.1 × 0.1 [15], except EM3 (near the EM shower maximum), where it is 0.05 × 0.05. The calorimeter is well-suited for a precise measurement of the energy and direction of electrons and photons, pro-viding an energy resolution of about 3.6% at an energy of 50 GeV and an angular resolution of about 0.01 radi-ans. The energy response of the calorimeter to photons is calibrated using electrons from Z boson decays. Since electrons and photons shower differently in matter, addi-tional corrections as a function of η are derived using a detailed geant-based [17] simulation of the D0 detector response. These corrections are largest [(2.0 − 2.5)%] at low photon energies (≈ 20 GeV). The data used in this analysis were collected using a combination of triggers re-quiring at least two clusters of energy in the EM calorime-ter with loose shower shape requirements and varying pT thresholds between 15 GeV and 25 GeV, and correspond to an integrated luminosity of 4.2 ± 0.3 fb−1 [18].
candi-dates with transverse momentum pT > 21 (20) GeV for the highest (next-to-highest) pT photon candidate and pseudorapidity |η| < 0.9, for which the trigger require-ments are > 96% efficient. The minimum pT require-ments for the two photon candidates are chosen to be different following theoretical discussions [13, 14] and a previous measurement [10]. The photon pT is computed with respect to the reconstructed event primary vertex (PV) with the highest number of associated tracks. The PV is required to be within 60 cm of the center of the de-tector along the beam axis. The PV has a reconstruction efficiency of about 98% and has about 65% probability of being the correct vertex corresponding to the hard p¯p → γγ + X production.
Photon candidates are formed from clusters of calorimeter cells within a cone of radius R = p(∆η)2+ (∆φ)2 = 0.4 around a seed tower [16]. The final cluster energy is then recalculated from the inner core with R = 0.2. The photon candidates are selected by requiring: (i) ≥ 97% of the cluster energy be deposited in the EM calorimeter layers; (ii) the calorimeter isola-tion I = [Etot(0.4) − EEM(0.2)]/EEM(0.2) < 0.10, where Etot(R) [EEM(R)] is the total [EM only] energy in a cone of radius R; (iii) the pT scalar sum of all tracks origi-nating from the PV in an annulus of 0.05 < R < 0.4 around the EM cluster be < 1.5 GeV; and (iv) the energy-weighted EM shower width be consistent with that ex-pected for an electromagnetic shower. To suppress elec-trons misidentified as photons, the EM clusters are re-quired to not be spatially matched to significant tracker activity, either a reconstructed track or a density of hits in the SMT and CFT consistent with that of an elec-tron [19]. In the following, this requirement will be re-ferred to as the “track-match veto”.
To further suppress jets misidentified as photons, an artificial neural network (NN) discriminant which ex-ploits differences in tracker activity and energy deposits in the calorimeter and in the CPS between photons and jets is defined [1]. The NN is trained using γ and jet pythia MC samples. The shapes of the NN output (ONN), normalized to unit area and obtained after ap-plying all data selection criteria, are shown in Figure 2, exhibiting a significant discrimination between pho-tons and jets. Photon candidates satisfy the requirement ONN > 0.3, which is ≈ 98% efficient for photons and re-jects ≈ 40% of the jets misidentified as photons. The ONNshape is validated in data. For photons a data sam-ple consisting of photons radiated from charged leptons in Z boson decays (Z → ℓ+ℓ−γ, ℓ = e, µ) [20] is used. The MC modeling of the ONNshape for jets is validated in a sample of photon candidates selected by inverting the photon isolation (I > 0.07), a requirement that sig-nificantly enriches the sample in jets. The data and MC ONN shapes are compared in Figures 2 and 3 and found to be in good agreement.
Finally, the two photon candidates are required to be
NN O 0 0.1 0.2 0.3 0.4 0.5 0.6 0.7 0.8 0.9 1 Fraction of events 0.05 0.1 0.15 0.2 0.25 0.3 0.35 -1 DØ, 4.2 fb ) data µ (l = e, γ -l + Z->l MC γ jet MC
FIG. 2: Comparison of the normalized ONN spectra for pho-tons from DPP MC and Z → ℓ+ℓ−γ data and for misidentified jets from dijet MC.
spatially separated from each other by a distance in η −φ space ∆R > 0.4 and to satisfy Mγγ > pγγT . The lat-ter requirement is satisfied by the majority (≈ 92%) of DPP events and, together with the photon isolation re-quirements, allows significant suppression of the contri-bution from the fragmentation diagrams, thus restricting the data-to-theory comparison to the region where the theoretical calculations should have smaller uncertainties [13].
After imposing all requirements, 10938 events with diphoton candidates are selected in data. This sam-ple includes instrumental background contributions from γ+jet and dijet production, where a jet is misidentified as a single photon as a result of fluctuations in the parton fragmentation into a well-isolated neutral meson (π0or η) decaying into a final state with two or more photons. An additional smaller background contribution results from Z-boson/Drell-Yan production events Z/γ∗ → e+e− (ZDY) in which both electrons are misidentified as pho-tons.
The contribution from ZDY events is estimated us-ing the MC simulation with pythia, normalized to the NNLO cross section [21]. The selection efficiencies de-termined from the MC simulation are corrected to those measured in the data. On average, each electron has a 2% probability of satisfying the photon selection cri-teria, mainly due to the inefficiency of the track-match veto requirements. The total ZDY contribution is es-timated to be 161 ± 20 events. Backgrounds due to γ+jet and dijet events are estimated from data by using a 4 × 4 matrix background estimation method [1]. Af-ter applying all of the selection criAf-teria described above, a tighter ONN requirement (ONN > 0.6) is used to classify the data events into four categories, depend-ing on whether both photon candidates, only the high-est pT one, only the next-to-highest pT one, or nei-ther of the two photon candidates pass (p) or fail (f ) this requirement. The corresponding number of events
(after subtraction of the estimated ZDY contribution) compose a 4-component vector (Npp, Npf, Nf p, Nf f). The difference in relative efficiencies of the ONN > 0.6 requirement between photons and jets allows es-timation of the sample composition by solving a lin-ear system of equations: (Npp, Npf, Nf p, Nf f)T = E × (Nγγ, Nγj, Njγ, Njj)T, where Nγγ (Njj) is the number of DPP (dijet) events and Nγj (Njγ) is the number of γ+jet events with the (next-to-)highest pT photon can-didate being a photon. The 4 × 4 matrix E contains the photon εγ and jet εjet efficiencies, estimated using photon and jet MC samples and validated in data. The efficiencies are parameterized as a function of the pho-ton candidate η and vary within (90 − 95)% for εγ and within (66 − 70)% for εjet. The systematic uncertainty on εγ is estimated to be 1.5% from a comparison of the efficiency as a function of η between data and MC using samples of electrons from Z boson decays and photons from radiative Z boson decays. In order to estimate the systematic uncertainty on εjet, two independent control data samples enriched in jets misidentified as photons are selected, either by inverting the photon isolation variable (I > 0.07), or by requiring at least one track in a cone of R < 0.05 around the photon, while keeping the re-maining photon selection criteria unchanged. In both cases the agreement with the MC prediction for εjet is found to be within 10%, which is taken as the system-atic uncertainty. The total number of DPP events is found to be Nγγ = 7307 ± 312(stat.), corresponding to an average DPP purity of ≈ 67%. Following this pro-cedure, the number of DPP events is estimated in each bin of the four kinematic variables considered (Mγγ, pγγT , ∆φγγ, and | cos θ∗|). The largest kinematic dependence of the DPP purity is in terms of Mγγ, with a variation between ≈ 60% at Mγγ ≈ 40 GeV and close to 100% for Mγγ > 200 GeV. As a function of the other kinematic variables, the DPP purity varies in the (60 − 70)% range. The relative systematic uncertainty on the purity results from the systematic uncertainties on εγand εjet, and typ-ically varies within (11−15)%. As a cross-check, the DPP purity was also estimated via a fit to the two-dimensional distribution in data of ONN,γ1 versus ONN,γ2 using
tem-plates constructed from photons and jets in MC. The result was found to be in good agreement with that from the 4 × 4 matrix method.
The estimated number of DPP events per bin is cor-rected for the DPP event selection efficiency and accep-tance. The selection efficiency is calculated using DPP events generated with pythia and processed through a geant-based simulation of the D0 detector. In order to accurately model the effects of multiple p¯p interactions and detector noise, data events from random p¯p cross-ings with a similar instantaneous luminosity spectrum as considered in the data analysis are overlaid on the MC events. These MC events are then processed using the same reconstruction code as for the data. Small
differ-NN O 0 0.1 0.2 0.3 0.4 0.5 0.6 0.7 0.8 0.9 1 Fraction of events 0.1 0.2 0.3 0.4 0.5 -1 DØ, 4.2 fb jet data jet MC
FIG. 3: Comparison of the normalized ONN spectra for jets misidentified as photons in data and in dijet MC.
ences between data and MC in the per-photon selection efficiencies are corrected for with suitable scale factors derived using control samples of electrons from Z boson decays, as well as photons from the radiative Z boson de-cays. The overall DPP selection efficiency after applying all selection criteria is estimated as a function of the vari-able of interest. In the case of pγγT , ∆φγγ, and | cos θ∗|, it is about 64% with a (2 - 3)% variation across the bins, while for Mγγ, the efficiency grows from about 60% at 30 < Mγγ < 50 GeV to 69% at Mγγ > 200 GeV. The to-tal relative systematic uncertainty on the DPP selection efficiency is 4.3%, dominated by the track-match veto and photon ONN selections. The acceptance is calculated us-ing DPP events generated with resbos and is driven by the selections in ηdet (|ηdet| < 0.9, applied to avoid edge effects in the central calorimeter region used for the mea-surement) and φdet(to avoid periodic calorimeter module boundaries [16] that bias the EM cluster energy and po-sition measurements), PV misidentification, photon en-ergy scale, and bin-to-bin migration effects due to the finite energy and angular resolution of the EM calorime-ter. The overall DPP acceptance varies within (45−64)% with a relative systematic uncertainty of (4 − 7)%.
The differential cross sections dσ/dMγγ, dσ/dpγγT , dσ/d∆φγγ, and dσ/d| cos θ∗| are obtained from the num-ber of data events corrected for the background contribu-tion, divided by the trigger, vertex and diphoton selec-tion efficiencies, acceptance, integrated luminosity, and the bin width for each kinematic variable. The measured differential cross sections, compared to the theoretical predictions from resbos, are presented in Table I. The average value for each variable in a bin was estimated us-ing resbos. The statistical uncertainty δstatcorresponds to the statistical precision on Nγγ estimated in the 4 × 4 matrix method, which can be sizable when values of ǫγ and ǫjetare numerically close.
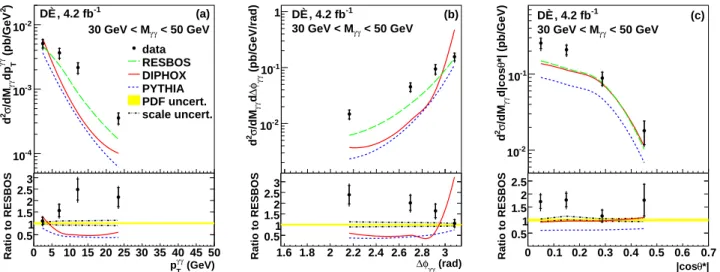
Figure 4 shows a comparison of the measured differ-ential cross sections to the theoretical predictions from resbos, diphox, and pythia. Systematic uncertainties
in the measured cross sections have large (> 90%) bin-to-bin correlations. There is a common 7.4% normalization uncertainty, resulting from the photon selection criteria (4.3%) and luminosity measurement (6.1%), that is not shown on the data points. The predictions from res-bos and diphox are computed using the CTEQ6.6M PDF set [12], the DSS set of fragmentation functions [22], and setting renormalization µR, factorization µF, and fragmentation µf scales as µR = µF = µf = Mγγ. The uncertainty due to the scale choice is estimated by simultaneous variation by a factor of two of all scales relative to the default choice and found to be about 10% for Mγγ and | cos θ∗| and up to (15 − 20)% for high pγγT and low ∆φγγ. The PDF uncertainty is esti-mated using diphox and the 44 eigenvectors provided with the CTEQ6.6M PDF set [12] and found to be within (3 − 6)% for all four cross sections. The pre-dictions from pythia are computed with “Tune A” [11], which uses the CTEQ5L PDF set. All theoretical predic-tions are obtained using diphoton event selection criteria equivalent to those applied in the experimental analy-sis. In particular, the photon isolation is required to be Eiso T = ETtot(0.4) − E γ T < 2.5 GeV, where E tot T (0.4) is the total transverse energy within a cone of radius R = 0.4 centered on the photon, and ETγ is the photon transverse energy. For resbos and diphox, Etot
T is computed at the parton level, whereas in the case of pythia, it is com-puted at the particle level. This requirement suppresses the contributions from photons produced in the fragmen-tation processes and leads to a more consistent compari-son with the experimental result. Studies performed us-ing diphox indicate that the contribution to the overall cross section from one- and two-fragmentation processes does not exceed 16% and significantly drops at large Mγγ, pγγT and small ∆φγγto (1–3)%. In order to allow a direct comparison to the data, the NLO QCD cross sections obtained with resbos and diphox are further corrected for contributions from multiple parton interactions and hadronization, both of which affect the efficiency of the isolation requirement. These corrections are estimated using DPP events simulated in pythia using Tunes A and S0 [11]. The corrections vary within (4.0 − 5.5)% as a function of the measured kinematic variables and are consistent for both tunes within 0.5%.
The results obtained show that none of the theoretical predictions considered is able to describe the data well in all kinematic regions of the four variables. resbos shows the best agreement with data, although systematic discrepancies are observed at low Mγγ, high pγγT , and low ∆φγγ. However, the agreement between resbos and data is fair at intermediate Mγγ (50 −80 GeV), and good at high Mγγ (> 80 GeV). The large discrepancy between resbosand diphox in some regions of the phase space is due to absence of all-order soft-gluon resummation and accounting gg → γγ contribution just at LO in diphox. Further insight on the dependence of the pγγT , ∆φγγ,
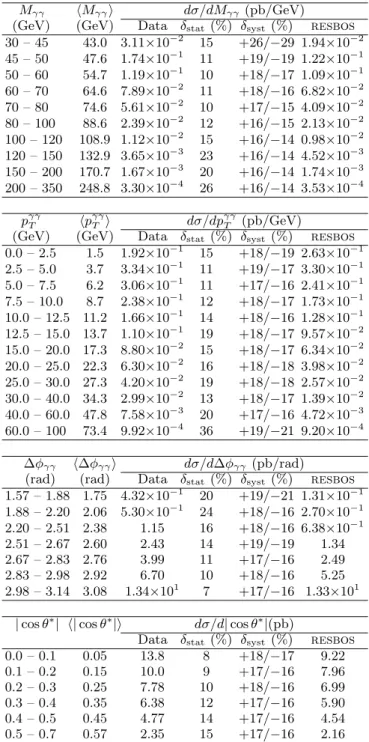
TABLE I: The measured differential cross sections in bins of Mγγ, pγγT , ∆φγγ, and | cos θ∗|. The columns δstat and δsyst represent the statistical and systematic uncertainties, respec-tively. Also shown are the predictions from resbos.
Mγγ hMγγi dσ/dMγγ (pb/GeV)
(GeV) (GeV) Data δstat (%) δsyst(%) resbos 30 – 45 43.0 3.11×10⁻² 15 +26/−29 1.94×10⁻² 45 – 50 47.6 1.74×10⁻¹ 11 +19/−19 1.22×10⁻¹ 50 – 60 54.7 1.19×10⁻¹ 10 +18/−17 1.09×10⁻¹ 60 – 70 64.6 7.89×10⁻² 11 +18/−16 6.82×10⁻² 70 – 80 74.6 5.61×10⁻² 10 +17/−15 4.09×10⁻² 80 – 100 88.6 2.39×10⁻² 12 +16/−15 2.13×10⁻² 100 – 120 108.9 1.12×10⁻² 15 +16/−14 0.98×10⁻² 120 – 150 132.9 3.65×10⁻³ 23 +16/−14 4.52×10⁻³ 150 – 200 170.7 1.67×10⁻³ 20 +16/−14 1.74×10⁻³ 200 – 350 248.8 3.30×10⁻⁴ 26 +16/−14 3.53×10⁻⁴ pγγT hp γγ T i dσ/dp γγ T (pb/GeV)
(GeV) (GeV) Data δstat (%) δsyst(%) resbos 0.0 – 2.5 1.5 1.92×10⁻¹ 15 +18/−19 2.63×10⁻¹ 2.5 – 5.0 3.7 3.34×10⁻¹ 11 +19/−17 3.30×10⁻¹ 5.0 – 7.5 6.2 3.06×10⁻¹ 11 +17/−16 2.41×10⁻¹ 7.5 – 10.0 8.7 2.38×10⁻¹ 12 +18/−17 1.73×10⁻¹ 10.0 – 12.5 11.2 1.66×10⁻¹ 14 +18/−16 1.28×10⁻¹ 12.5 – 15.0 13.7 1.10×10⁻¹ 19 +18/−17 9.57×10⁻² 15.0 – 20.0 17.3 8.80×10⁻² 15 +18/−17 6.34×10⁻² 20.0 – 25.0 22.3 6.30×10⁻² 16 +18/−18 3.98×10⁻² 25.0 – 30.0 27.3 4.20×10⁻² 19 +18/−18 2.57×10⁻² 30.0 – 40.0 34.3 2.99×10⁻² 13 +18/−17 1.39×10⁻² 40.0 – 60.0 47.8 7.58×10⁻³ 20 +17/−16 4.72×10⁻³ 60.0 – 100 73.4 9.92×10⁻⁴ 36 +19/−21 9.20×10⁻⁴ ∆φγγ h∆φγγi dσ/d∆φγγ (pb/rad)
(rad) (rad) Data δstat (%) δsyst(%) resbos 1.57 – 1.88 1.75 4.32×10⁻¹ 20 +19/−21 1.31×10⁻¹ 1.88 – 2.20 2.06 5.30×10⁻¹ 24 +18/−16 2.70×10⁻¹ 2.20 – 2.51 2.38 1.15 16 +18/−16 6.38×10⁻¹ 2.51 – 2.67 2.60 2.43 14 +19/−19 1.34 2.67 – 2.83 2.76 3.99 11 +17/−16 2.49 2.83 – 2.98 2.92 6.70 10 +18/−16 5.25 2.98 – 3.14 3.08 1.34×101 7 +17/−16 1.33×101
| cos θ∗| h| cos θ∗|i dσ/d| cos θ∗|(pb)
Data δstat (%) δsyst(%) resbos
0.0 – 0.1 0.05 13.8 8 +18/−17 9.22 0.1 – 0.2 0.15 10.0 9 +17/−16 7.96 0.2 – 0.3 0.25 7.78 10 +18/−16 6.99 0.3 – 0.4 0.35 6.38 12 +17/−16 5.90 0.4 – 0.5 0.45 4.77 14 +17/−16 4.54 0.5 – 0.7 0.57 2.35 15 +17/−16 2.16
and | cos θ∗| kinematic distributions on the mass scale can be gained through the measurement of double dif-ferential cross sections. For this purpose, the difdif-ferential cross sections as functions of pγγT , ∆φγγ, and | cos θ∗| are measured in three Mγγ bins: 30 − 50 GeV, 50 − 80 GeV and 80 − 350 GeV. The results are presented in Tables II – IV, corresponding to each of the three Mγγ
inter-50 100 150 200 250 300 350 (pb/GeV) γγ /dM σ d -3 10 -2 10 -1 10 data RESBOS DIPHOX PYTHIA PDF uncert. scale uncert. (a) -1 DØ, 4.2 fb (GeV) γ γ M 50 100 150 200 250 300 350 Ratio to RESBOS 0.5 1 1.5 2 0 10 20 30 40 50 60 70 80 90 100 (pb/GeV) γγ T /dp σ d -3 10 -2 10 -1 10 (b) -1 DØ, 4.2 fb (GeV) γ γ T p 0 10 20 30 40 50 60 70 80 90 100 Ratio to RESBOS 0.5 1 1.5 2 2.5 1.6 1.8 2 2.2 2.4 2.6 2.8 3 (pb/rad) γγ φ∆ /d σ d -1 10 1 10 2 10 -1 (c) DØ, 4.2 fb (rad) γ γ φ ∆ 1.6 1.8 2 2.2 2.4 2.6 2.8 3 Ratio to RESBOS 1 2 3 4 0 0.1 0.2 0.3 0.4 0.5 0.6 0.7 *| (pb) θ /d|cos σ d 10 (d) -1 DØ, 4.2 fb *| θ |cos 0 0.1 0.2 0.3 0.4 0.5 0.6 0.7 Ratio to RESBOS 0.5 1 1.5 2
FIG. 4: The measured differential diphoton production cross sections as functions of (a) Mγγ, (b) pγγT , (c) ∆φγγ, and (d) | cos θ∗|. The data are compared to the theoretical predictions from resbos, diphox, and pythia. The predictions from resbos, and diphoxuse the CTEQ6.6M PDF set [12] and renormalization, factorization, and fragmentation scales µR= µF = µf = Mγγ, while pythia uses the Tune A settings. Theoretical predictions are obtained using the following selections: two photons with pT > 21(20) GeV, |η| < 0.9, 30 <Mγγ< 350 GeV, Mγγ> pγγT , ∆R > 0.4, ∆φγγ > 0.5π, and ETiso < 2.5 GeV. The ratio of differential cross sections between data and resbos are displayed as black points with uncertainties in the bottom plots. The inner line for the uncertainties in data points shows the statistical uncertainty, while the outer line shows the total (statistical and systematic added in quadrature) uncertainty after removing the 7.4% normalization uncertainty. The solid (dashed) line shows the ratio of the predictions from diphox (pythia) to those from resbos. In the bottom plots, the scale uncertainties are shown by dash-dotted lines and the PDF uncertainties by shaded regions.
vals. Each table is split into three sub-tables, showing results separately for d2σ/dMγγdpγγT , d
2σ/dM
γγd∆φγγ, and d2σ/dM
γγd| cos θ∗|. The measured cross sections for the pγγT , ∆φγγ, and | cos θ∗| variables in the three mass bins are shown in Figures 5 − 7 and compared to the theoretical predictions. These results confirm that the largest discrepancies between data and resbos for each of the kinematic variables originate from the lowest Mγγ region (Mγγ < 50 GeV). As shown in Figure 1, this is the region where the contribution from gg → γγ is expected to be largest. The discrepancies between data and resbos are reduced in the intermediate Mγγ region (50 − 80 GeV), and a quite satisfactory description of
all kinematic variables is achieved for the Mγγ> 80 GeV region, the relevant region for the Higgs boson and new phenomena searches. However, it should be pointed out that at the Tevatron, DPP production at high masses is strongly dominated by q ¯q annihilation, in contrast with the LHC, where the contribution from gg and qg initiated process will be significant. It remains to be seen whether the addition of NNLO corrections to resbos, as done in [23], will improve the description of the high pγγT (low ∆φγγ) spectrum at low Mγγ.
In summary, we have presented measurements of sin-gle and double differential cross sections for DPP pro-duction in p¯p collisions at√s = 1.96 TeV. This analysis
0 5 10 15 20 25 30 35 40 45 50 ) 2 (pb/GeV γγ T dp γγ /dM σ 2 d -4 10 -3 10 -2 10 data RESBOS DIPHOX PYTHIA PDF uncert. scale uncert. (a) < 50 GeV γ γ 30 GeV < M -1 DØ, 4.2 fb (GeV) γ γ T p 0 5 10 15 20 25 30 35 40 45 50 Ratio to RESBOS 0.5 1 1.5 2 2.5 3 1.6 1.8 2 2.2 2.4 2.6 2.8 3 (pb/GeV/rad) γγ φ∆ d γγ /dM σ 2 d -2 10 -1 10 1 (b) < 50 GeV γ γ 30 GeV < M -1 DØ, 4.2 fb (rad) γ γ φ ∆ 1.6 1.8 2 2.2 2.4 2.6 2.8 3 Ratio to RESBOS 0.51 1.52 2.5 3 0 0.1 0.2 0.3 0.4 0.5 0.6 0.7 *| (pb/GeV) θ d|cos γγ /dM σ 2 d -2 10 -1 10 (c) < 50 GeV γ γ 30 GeV < M -1 DØ, 4.2 fb *| θ |cos 0 0.1 0.2 0.3 0.4 0.5 0.6 0.7 Ratio to RESBOS 0.5 1 1.5 2 2.5
FIG. 5: The measured double differential diphoton production cross sections as functions of (a) pγγT , (b) ∆φγγ, and (c) | cos θ∗| for 30 < M
γγ < 50 GeV. The notations for points, lines and shaded regions are the same as in Figure 4.
0 10 20 30 40 50 60 70 80 ) 2 (pb/GeV γγ T dp γγ /dM σ 2 d -4 10 -3 10 -2 10 data RESBOS DIPHOX PYTHIA PDF uncert. scale uncert. (a) < 80 GeV γ γ 50 GeV < M -1 DØ, 4.2 fb (GeV) γ γ T p 0 10 20 30 40 50 60 70 80 Ratio to RESBOS 0.5 1 1.5 2 2.5 1.6 1.8 2 2.2 2.4 2.6 2.8 3 (pb/GeV/rad) γγ φ∆ d γγ /dM σ 2 d -2 10 -1 10 1 (b) < 80 GeV γ γ 50 GeV < M -1 DØ, 4.2 fb (rad) γ γ φ ∆ 1.6 1.8 2 2.2 2.4 2.6 2.8 3 0.5 1 1.5 2 2.5 3 0 0.1 0.2 0.3 0.4 0.5 0.6 0.7 *| (pb/GeV) θ d|cos γγ /dM σ 2 d -1 10 (c) < 80 GeV γ γ 50 GeV < M -1 DØ, 4.2 fb *| θ |cos 0 0.1 0.2 0.3 0.4 0.5 0.6 0.7 Ratio to RESBOS 0.5 1 1.5 2
FIG. 6: The measured double differential diphoton production cross sections as functions of (a) pγγT , (b) ∆φγγ, and (c) | cos θ∗| for 50 < M
γγ < 80 GeV. The notations for points, lines and shaded regions are the same as in Figure 4.
0 10 20 30 40 50 60 70 80 90 100 ) 2 (pb/GeV γγ T dp γγ /dM σ 2 d -6 10 -5 10 -4 10 dataRESBOS DIPHOX PYTHIA PDF uncert. scale uncert. (a) < 350 GeV γ γ 80 GeV < M -1 DØ, 4.2 fb (GeV) γ γ T p 0 10 20 30 40 50 60 70 80 90 100 Ratio to RESBOS 0.5 1 1.5 2 1.6 1.8 2 2.2 2.4 2.6 2.8 3 (pb/GeV/rad) γγ φ∆ d γγ /dM σ 2 d -4 10 -3 10 -2 10 (b) < 350 GeV γ γ 80 GeV < M -1 DØ, 4.2 fb (rad) γ γ φ ∆ 1.6 1.8 2 2.2 2.4 2.6 2.8 3 Ratio to RESBOS 0.5 1 1.5 2 2.5 3 0 0.1 0.2 0.3 0.4 0.5 0.6 0.7 *| (pb/GeV) θ d|cos γγ /dM σ 2 d -2 10 (c) < 350 GeV γ γ 80 GeV < M -1 DØ, 4.2 fb *| θ |cos 0 0.1 0.2 0.3 0.4 0.5 0.6 0.7 Ratio to RESBOS 0.5 1 1.5 2
FIG. 7: The measured double differential diphoton production cross sections as functions of (a) pγγT , (b) ∆φγγ, and (c) | cos θ∗| for 80 < M
uses 4.2 fb−1 of D0 data, representing a twenty-fold in-crease in statistics relative to the last published Tevatron results [10]. The measured cross sections are compared to predictions from resbos, diphox and pythia, show-ing the necessity of includshow-ing higher order corrections beyond NLO as well as the resummation to all orders of soft and collinear initial state gluons. These results allow the tuning of the theoretical predictions for this process, which is of great relevance for improving the sensitivity of searches for the Higgs boson and other new phenomena at the Tevatron and the LHC.
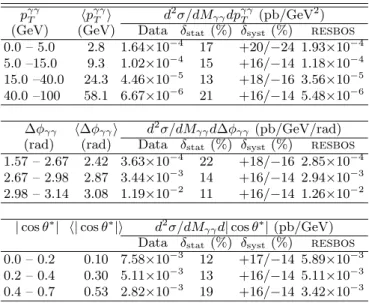
TABLE II: The measured double differential cross sections in bins of pγγT , ∆φγγ, and | cos θ∗|, in the region 30 < Mγγ < 50 GeV. The columns δstat and δsystrepresent the statistical and systematic uncertainties, respectively. Also shown are the predictions from resbos.
pγγ T hp γγ T i d 2σ/dM γγdpγγT (pb/GeV2) (GeV) (GeV) Data δstat (%) δsyst (%) resbos 0.0 – 5.0 2.4 5.11×10⁻³ 15 +17/−14 4.64×10⁻³ 5.0 – 10.0 7.0 3.65×10⁻³ 18 +16/−14 2.35×10⁻³ 10.0 – 15.0 12.2 2.17×10⁻³ 19 +16/−14 8.72×10⁻⁴ 15.0 – 50.0 23.4 3.58×10⁻⁴ 19 +16/−14 1.67×10⁻⁴
∆φγγ h∆φγγi d2σ/dMγγd∆φγγ (pb/GeV/rad) (rad) (rad) Data δstat (%) δsyst (%) resbos 1.57 – 2.51 2.16 1.48×10⁻² 18 +16/−14 6.16×10⁻³ 2.51 – 2.83 2.70 4.54×10⁻² 17 +16/−14 2.25×10⁻² 2.83 – 2.98 2.92 9.45×10⁻² 19 +16/−14 5.76×10⁻² 2.98 – 3.14 3.08 1.57×10⁻¹ 16 +16/−14 1.48×10⁻¹ | cos θ∗| h| cos θ∗|i d2σ/dM γγd| cos θ∗| (pb/GeV) Data δstat (%) δsyst (%) resbos 0.0 – 0.1 0.05 2.55×10⁻¹ 15 +17/−14 1.49×10⁻¹ 0.1 – 0.2 0.15 2.09×10⁻¹ 15 +16/−15 1.18×10⁻¹ 0.2 – 0.4 0.28 8.84×10⁻² 19 +16/−16 7.64×10⁻² 0.4 – 0.7 0.44 1.80×10⁻² 35 +19/−15 1.02×10⁻²
We thank C. Balazs, C.-P. Yuan and J.P. Guillet for their assistance with the theoretical predictions. We also thank F. Siegert and S. Schumann for useful dis-cussions. We thank the staffs at Fermilab and collab-orating institutions, and acknowledge support from the DOE and NSF (USA); CEA and CNRS/IN2P3 (France); FASI, Rosatom and RFBR (Russia); CNPq, FAPERJ, FAPESP and FUNDUNESP (Brazil); DAE and DST (In-dia); Colciencias (Colombia); CONACyT (Mexico); KRF and KOSEF (Korea); CONICET and UBACyT (Ar-gentina); FOM (The Netherlands); STFC and the Royal Society (United Kingdom); MSMT and GACR (Czech Republic); CRC Program and NSERC (Canada); BMBF and DFG (Germany); SFI (Ireland); The Swedish Re-search Council (Sweden); and CAS and CNSF (China).
TABLE III: The measured double differential cross sections in bins of pγγT , ∆φγγ, and | cos θ∗|, in the region 50 < Mγγ< 80 GeV. The notations are the same as in Table II.
pγγT hp γγ T i d 2σ/dM γγdpγγT (pb/GeV 2) (GeV) (GeV) Data δstat(%) δsyst(%) resbos 0.0 – 5.0 2.8 3.68×10⁻³ 14 +16/−15 5.07×10⁻³ 5.0 – 10.0 7.3 4.92×10⁻³ 12 +16/−14 4.06×10⁻³ 10.0 – 15.0 12.3 2.93×10⁻³ 14 +16/−14 2.33×10⁻³ 15.0 – 20.0 17.3 1.86×10⁻³ 18 +16/−14 1.29×10⁻³ 20.0 – 30.0 24.1 8.22×10⁻⁴ 18 +16/−14 5.81×10⁻⁴ 30.0 – 80.0 39.8 1.34×10⁻⁴ 17 +16/−14 6.81×10⁻⁵ ∆φγγ h∆φγγi d2σ/dMγγd∆φγγ (pb/GeV/rad) (rad) (rad) Data δstat(%) δsyst(%) resbos 1.57 – 2.20 1.98 6.19×10⁻³ 25 +16/−14 2.99×10⁻³ 2.20 – 2.51 2.38 1.94×10⁻² 20 +16/−14 1.16×10⁻² 2.51 – 2.67 2.60 4.49×10⁻² 19 +16/−14 2.56×10⁻² 2.67 – 2.83 2.76 6.64×10⁻² 16 +16/−14 4.87×10⁻² 2.83 – 2.98 2.92 1.18×10⁻¹ 14 +16/−14 1.04×10⁻¹ 2.98 – 3.14 3.07 2.30×10⁻¹ 10 +16/−14 2.47×10⁻¹ | cos θ∗| h| cos θ∗|i d2σ/dM γγd| cos θ∗| (pb/GeV) Data δstat (%) δsyst(%) resbos 0.0 – 0.1 0.05 1.77×10⁻¹ 13 +16/−14 1.58×10⁻¹ 0.1 – 0.2 0.15 1.50×10⁻¹ 14 +16/−14 1.41×10⁻¹ 0.2 – 0.3 0.25 1.53×10⁻¹ 13 +16/−14 1.29×10⁻¹ 0.3 – 0.4 0.35 1.15×10⁻¹ 16 +16/−14 1.14×10⁻¹ 0.4 – 0.5 0.45 1.06×10⁻¹ 17 +16/−14 9.52×10⁻² 0.5 – 0.7 0.58 5.08×10⁻² 20 +17/−14 4.50×10⁻²
TABLE IV: The measured double differential cross sections in bins of pγγ
T , ∆φγγ, and | cos θ∗|, in the region 80 < Mγγ< 350 GeV. The notations are the same as in Table II.
pγγ T hp γγ T i d 2σ/dM γγdpγγT (pb/GeV2) (GeV) (GeV) Data δstat(%) δsyst(%) resbos 0.0 – 5.0 2.8 1.64×10⁻⁴ 17 +20/−24 1.93×10⁻⁴ 5.0 –15.0 9.3 1.02×10⁻⁴ 15 +16/−14 1.18×10⁻⁴ 15.0 –40.0 24.3 4.46×10⁻⁵ 13 +18/−16 3.56×10⁻⁵ 40.0 –100 58.1 6.67×10⁻⁶ 21 +16/−14 5.48×10⁻⁶
∆φγγ h∆φγγi d2σ/dMγγd∆φγγ (pb/GeV/rad) (rad) (rad) Data δstat(%) δsyst(%) resbos 1.57 – 2.67 2.42 3.63×10⁻⁴ 22 +18/−16 2.85×10⁻⁴ 2.67 – 2.98 2.87 3.44×10⁻³ 14 +16/−14 2.94×10⁻³ 2.98 – 3.14 3.08 1.19×10⁻² 11 +16/−14 1.26×10⁻²
| cos θ∗| h| cos θ∗|i d2σ/dM
γγd| cos θ∗| (pb/GeV) Data δstat (%) δsyst(%) resbos 0.0 – 0.2 0.10 7.58×10⁻³ 12 +17/−14 5.89×10⁻³ 0.2 – 0.4 0.30 5.11×10⁻³ 13 +16/−14 5.11×10⁻³ 0.4 – 0.7 0.53 2.82×10⁻³ 19 +16/−14 3.42×10⁻³
[a] Visitor from Augustana College, Sioux Falls, SD, USA. [b] Visitor from The University of Liverpool, Liverpool, UK.
[c] Visitor from SLAC, Menlo Park, CA, USA. [d] Visitor from ICREA/IFAE, Barcelona, Spain.
[e] Visitor from Centro de Investigacion en Computacion -IPN, Mexico City, Mexico.
[f] Visitor from ECFM, Universidad Autonoma de Sinaloa, Culiac´an, Mexico.
[g] Visitor from Universit¨at Bern, Bern, Switzerland.
[1] V.M. Abazov et al. (D0 Collaboration), Phys. Rev. Lett. 102, 231801 (2009).
[2] G. Aad et al. (ATLAS Collaboration), arXiv:0901.0512 [hep-ex] (2009); G.L. Bayatian et al. (CMS Collabora-tion), J. Phys. G 34, 995 (2007).
[3] S. Mrenna and J. Wells, Phys. Rev. D 63, 015006 (2001), and references therein.
[4] M.C. Kumar, P. Mathews, V. Ravindran, and A. Tri-pathi, Phys. Lett. B 672, 45 (2009).
[5] G.F. Giudice and R. Rattazzi, Phys. Rep. 322, 419 (1999).
[6] E. Bonvin et al. (WA70 Collaboration), Z. Phys. C 41, 591 (1989); Phys. Lett. B 236, 523 (1990).
[7] M. Begel, Ph.D. Thesis, University of Rochester (1999), FERMILAB-THESIS-1999-05.
[8] C. Albajar et al. (UA1 Collaboration), Phys. Lett. B 209, 385 (1988).
[9] J. Alitti et al. (UA2 Collaboration), Phys. Lett. B 288, 386 (1992).
[10] F. Abe et al. (CDF Collaboration), Phys. Rev. Lett. 70,
2232 (1993); D. Acosta et al. (CDF Collaboration), Phys. Rev. Lett. 95, 022003 (2005).
[11] T. Sj¨ostrand, S. Mrenna, P. Z. Skands, JHEP 0605, 026 (2006). We use pythia version v6.420 with tune A. [12] W.K. Tung et al., JHEP 0702, 052 (2007).
[13] C. Balazs, E.L. Berger, S. Mrenna, and C.-P. Yuan, Phys. Rev. D 57, 6934 (1998); C. Balazs, E.L. Berger, P. Nadol-sky, and C.-P. Yuan, Phys. Rev. D 76, 013009 (2007). [14] T. Binoth, J.-Ph. Guillet, E. Pilon, and M. Werlen, Eur.
Phys. J. C 16, 311 (2000).
[15] The polar angle θ and the azimuthal angle φ are defined with respect to the positive z axis, which is along the proton beam direction. Pseudorapidity is defined as η = − ln[tan(θ/2)]. Also, ηdetand φdetare the pseudorapidity and the azimuthal angle measured with respect to the center of the detector.
[16] V.M. Abazov et al. (D0 Collaboration), Nucl. Instrum. Methods in Phys. Res. A 565, 463 (2006); M. Abolins et al., Nucl. Instrum. Methods in Phys. Res. A 584, 75 (2007); R. Angstadt et al., arXiv:0911.2522 [physics.ins-det] (2009), submitted to Nucl. Instrum. Methods in Phys. Res. A.
[17] R. Brun and F. Carminati, CERN Program Library Long Writeup W5013 (1993); we use geant version v3.21. [18] T. Andeen et al., FERMILAB-TM-2365 (2007).
[19] V.M. Abazov et al. (D0 Collaboration), Phys. Lett. B 659, 856 (2008).
[20] V.M. Abazov et al. (D0 Collaboration), Phys. Lett. B 653, 378 (2007).
[21] R. Hamberg, W.L. van Neerven, and T. Matsuura, Nucl. Phys. B359, 343 (1991) [Erratum-ibid. B644, 403 (2002)].
[22] D. de Florian, R. Sassot and M. Stratmann, Phys. Rev. D 75, 114010 (2007); Phys. Rev. D 76, 074033 (2007). [23] Q.-H. Cao, C.-R. Chen, C. Schmidt, and C.-P. Yuan,