Publisher’s version / Version de l'éditeur:
Vous avez des questions? Nous pouvons vous aider. Pour communiquer directement avec un auteur, consultez la
première page de la revue dans laquelle son article a été publié afin de trouver ses coordonnées. Si vous n’arrivez pas à les repérer, communiquez avec nous à [email protected].
Questions? Contact the NRC Publications Archive team at
[email protected]. If you wish to email the authors directly, please see the first page of the publication for their contact information.
https://publications-cnrc.canada.ca/fra/droits
L’accès à ce site Web et l’utilisation de son contenu sont assujettis aux conditions présentées dans le site LISEZ CES CONDITIONS ATTENTIVEMENT AVANT D’UTILISER CE SITE WEB.
Client Report (National Research Council of Canada. Construction Research Centre); no. A1-013766, 2020-03-20
READ THESE TERMS AND CONDITIONS CAREFULLY BEFORE USING THIS WEBSITE. https://nrc-publications.canada.ca/eng/copyright
NRC Publications Archive Record / Notice des Archives des publications du CNRC :
https://nrc-publications.canada.ca/eng/view/object/?id=49c98c92-e29e-46df-bada-e2846e9c6343 https://publications-cnrc.canada.ca/fra/voir/objet/?id=49c98c92-e29e-46df-bada-e2846e9c6343
NRC Publications Archive
Archives des publications du CNRC
For the publisher’s version, please access the DOI link below./ Pour consulter la version de l’éditeur, utilisez le lien DOI ci-dessous.
https://doi.org/10.4224/40001926
Access and use of this website and the material on it are subject to the Terms and Conditions set forth at
Level 1: Preliminary Seismic Risk Screening Tool (PST) for existing buildings. Part 2: supporting technical documentation
Level 1
– Preliminary Seismic Risk Screening Tool
(PST) for Existing Buildings
Part 2: Supporting Technical Documentation
Reza Fathi-Fazl, Zhen Cai, Eric Jacques, and Bessam Kadhom
Published by:
LEVEL 1
– PRELIMINARY SEISMIC RISK SCREENING
TOOL (PST) FOR EXISTING BUILDINGS
PART 2: SUPPORTING TECHNICAL DOCUMENTATION
Prepared by:
Civil Engineering Infrastructure Unit Construction Research Centre National Research Council Canada Ottawa
Funded by:
Public Services and Procurement Canada
Disclaimer:
Public Services and Procurement Canada (PSPC) may reproduce this tool and may distribute such reproductions to its employees and contractors for PSPC use only.
Users other than PSPC wishing to use this tool must seek written permission from the National Research Council Canada (NRC) to do so.
© National Research Council Canada March 2020
ACKNOWLEDGEMENTS
The authors wish to acknowledge the financial support from Public Services and Procurement Canada (PSPC), which led to development of the Level 1 – Preliminary Seismic Risk Screening
Tool (PST). Support from Parviz Afrooz, Brian Boyd, Peter Campbell, Bruno Coté, Dextor
Edwards, Simon Foo, Clive Kamichaitis, Jocelyn Paquette, Doug Stephenson, Jack Vandenberg, Dave Weidelich, and Andrew Werblinski is also gratefully acknowledged.
The authors appreciate the effort made by Professor Dariush Motazedian from the Department of Earth Science at Carleton University in developing the site seismic categories for the
Level 1 – PST. The authors acknowledge the contributions by Professor Ghasan Doudak from the
Department of Civil Engineering at the University of Ottawa. Professor Doudak provided technical comments and inputs regarding definitions and descriptions of wood buildings.
The authors appreciate the editorial and technical feedback provided by Zoubir Lounis, Leonardo Cortés-Puentes, and Daniel Cusson from the NRC Construction Research Centre and the technical advices provided by Jitender Singh from the NRC Codes Canada.
TABLE OF CONTENTS
ACKNOWLEDGEMENTS ... iii TABLE OF CONTENTS ... v LIST OF TABLES ... ix LIST OF FIGURES ... xi 1.0 Introduction ... 1 1.1 Background ... 1 1.2 Intent ... 2 1.3 Organization ... 22.0 Development of seismic risk acceptance criteria ... 3
2.1 Seismicity ... 3
MMI scale and anticipated building damage level ...3
Relationship between MMI scale and peak ground motion parameters ...4
Relationships between spectral response accelerations and peak ground velocity ....9
Relationships between MMI scale and spectral response accelerations ...11
Adjustment of spectral acceleration thresholds of site seismic categories ...12
An example of determining site seismic category ...14
2.2 Benchmark NBC edition ... 15
Model building type ...15
Identification of benchmark NBC editions ...16
2.3 Remaining occupancy time ... 19
2.4 Consequences of failure ... 22
2.5 Summary of seismic risk acceptance criteria ... 22
2.6 Building deterioration and damage ... 23
2.7 Special conditions triggering the Level 3 – SEG ... 23
Unknown model building type ...23
Federal heritage designation ...23
Change of occupancy increasing structural loads ...24
Site Class F ...24
Geologic hazards ...24
3.0 Evaluation of seismic risk acceptance criteria ... 25
3.1 General ... 25
3.2 Overview of the Level 2 – SQST ... 25
3.3 Evaluation of seismic risk acceptance criteria based on seismicity ... 26
Structural seismic risk ...26
Seismic risk of non-structural components ...26
3.4 Evaluation of seismic risk acceptance criteria based on remaining occupancy time28 4.0 References ... 29
APPENDIX A Existing preliminary seismic screening methodologies ... A-1
A.1 Existing seismic screening methodologies ... A-1 A.1.1 Canada... A-1 A.1.2 United States ... A-1 A.1.3 New Zealand ... A-2 A.2 Definition of low seismicity ... A-3
A.2.1 Canada... A-3 A.2.2 United States ... A-7 A.2.3 New Zealand ... A-13 A.3 Benchmark NBC editions of model building types ... A-13
A.3.1 Benchmark NBC editions for wood buildings ... A-17 A.3.2 Benchmark NBC editions for concrete buildings ... A-19 A.3.3 Benchmark NBC editions for steel buildings ... A-25 A.3.4 Benchmark NBC editions for masonry buildings ... A-29 A.3.5 Benchmark NBC edition for other building types ... A-33 APPENDIX B Characteristics and earthquake performance of model building types in the Level 1 – PST B-1
B.1 Wood buildings ... B-1 B.1.1 Wood light frame (WLF) ...B-1 B.1.2 Wood post-and-beam (WPB) ...B-2
B.2 Steel buildings ... B-3 B.2.1 Steel frame buildings ...B-3 B.2.2 Steel light frame (SLF) ...B-5 B.2.3 Steel frame with concrete shear walls (SCW) ...B-6 B.2.4 Steel frame with infill masonry shear walls (SIW) ...B-7 B.3 Concrete buildings... B-8
B.3.1 Concrete moment frame (CMF) ...B-8 B.3.2 Concrete shear walls (CSW) ...B-9 B.3.3 Concrete frame with infill masonry shear walls (CIW) ...B-10 B.3.4 Precast concrete walls (PCW) ...B-11 B.3.5 Precast concrete frame (PCF) ...B-12 B.4 Masonry buildings ... B-13
B.4.1 Reinforced masonry bearing walls with light wood or metal deck diaphragms (RML) B-13
B.4.2 Reinforced masonry bearing walls with concrete diaphragms (RMC) ...B-14 B.4.3 Unreinforced masonry bearing wall building (URM) ...B-15 B.5 Other buildings ... B-17
B.5.1 Cold-formed steel buildings ...B-17 B.5.2 Manufactured homes ...B-17 APPENDIX C Evolution of North American model building codes throughout the last century
LIST OF TABLES
Table 2.1: Relationship between anticipated building damage and MMI scale ... 3
Table 2.2: MMI damage level thresholds (Wald et al., 1999) ... 4
Table 2.3: Coefficients for relationship between ground motion and MMI (Worden et al., 2012) 5 Table 2.4: MMI damage level thresholds (Worden et al., 2012) ... 6
Table 2.5: Coefficients for relationship between ground motion and MMI (Caprio et al., 2015) . 6 Table 2.6: Statistical information for different MMI and PGV relationships ... 7
Table 2.7: Building damage levels correlated to PGV thresholds ... 9
Table 2.8: Sa-PGV relationships based on the Geological Survey of Canada’s (GSC) “Fifth Generation Seismic Hazard Model Input Files” databases (Halchuk et al., 2015) ... 10
Table 2.9: MMI-Sa thresholds based on PGV and Sa bounds ... 12
Table 2.10: Site seismic categories and associated MMI scales ... 13
Table 2.11: List of model building types in the Level 1 – PST ... 16
Table 2.12: Benchmark NBC editions and key justifications for seventeen model building types ... 18
Table 2.13: Annual Probability of Exceedance and Probability Factor kp (AS1170.4, 2007) ... 20
Table 2.14: Seismic risk acceptance criteria ... 23
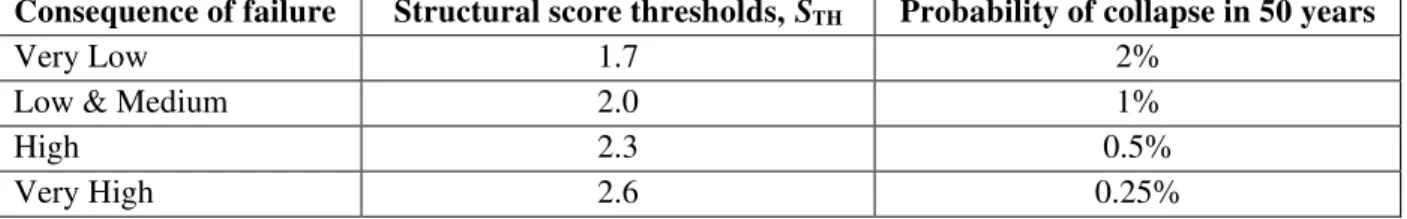
Table 3.1. Structural score thresholds and corresponding probability of collapse in 50 years .... 26
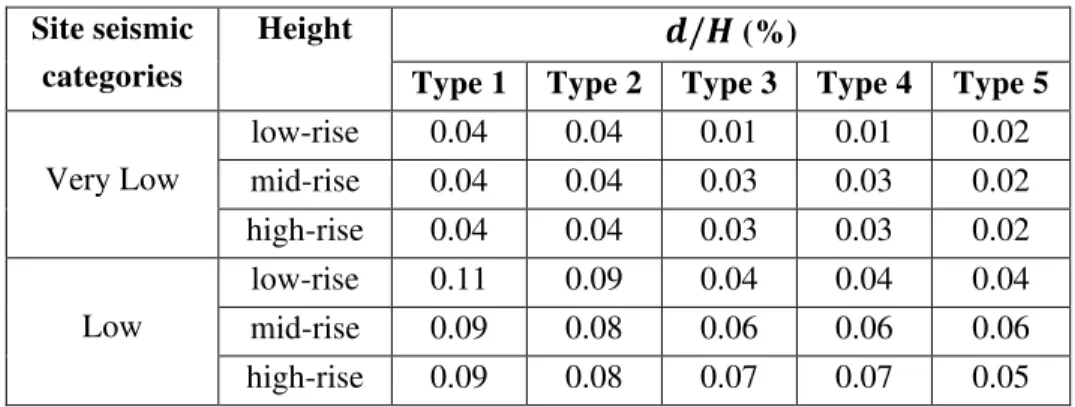
Table 3.2. Minimum structural scores for existing buildings located in Very Low and Low site seismic categories ... 26
Table 3.3: Maximum drift ratios of all five generalized building types ... 28
Table A.1: Height-to-thickness limits for unreinforced masonry parapets (from CSA S832-14)A-6
Table A.2: Height-to-thickness limits for unreinforced masonry walls (from CSA S832-14) .. A-7
Table A.4: Design spectral acceleration parameters for ordinary occupancy (from ASCE 7-16) ... A-9
Table A.5: Height-to-plan dimension limits for unreinforced chimneys (from NZSEE, 2017)A-13
Table A.6: Benchmark years for different building types ... A-14 Table A.7: A mapping of building types in FEMA P-154 and the Level 1 – PST ... A-17 Table C.1: Evolution of the NBC from 1941 to 2015 for seismic design provisions ... C-1
LIST OF FIGURES
Figure 2.1: Relationship between PGV and Sa(T) for T= 0.2, 0.5, and 1.0 seconds ... 11
Figure 2.2: Site seismic category map for Canada assuming Site Class C ... 14
Figure 2.3: Relationship between κ and the hazard with 2% in n years remaining occupancy time ... 21
Figure B.1: Engineered wood light frame (WLF) building (reproduced from FEMA 547, FEMA, 2006) ... B-1
Figure B.2: Engineered wood post-and-beam (WPB) building (reproduced from FEMA 547, FEMA, 2006) ... B-2
Figure B.3: Steel moment frame (SMF) building (reproduced from FEMA 547, FEMA, 2006) B-3
Figure B.4: Steel braced frame (SBF) building (reproduced from FEMA 547, FEMA, 2006) .. B-4
Figure B.5: Steel light frame (SLF) building (reproduced from British Constructional Steelwork Association, Ltd, 2017) ... B-5
Figure B.6: Steel frame with concrete shear walls (SCW) building (reproduced from FEMA 547, FEMA, 2006) ... B-6
Figure B.7: Steel frame with infill masonry shear walls (SIW) building (reproduced from FEMA 547, FEMA, 2006) ... B-7
Figure B.8: Concrete moment frame (CMF) building (reproduced from FEMA 547, FEMA, 2006) ... B-8
Figure B.9: Concrete shear walls (CSW) building (reproduced from FEMA 547, FEMA, 2006)B-10
Figure B.10: Concrete frame with infill masonry shear walls (CIW) building (reproduced from FEMA 547, FEMA, 2006) ... B-11
Figure B.11: Precast concrete walls (PCW) building (reproduced from FEMA 547, FEMA, 2006) ... B-12
Figure B.12: Precast concrete frame (PCF) building (reproduced from FEMA 547, FEMA, 2006) ... B-13
Figure B.13: Reinforced masonry bearing walls with light wood or metal deck diaphragms (RML) (reproduced from FEMA 547, FEMA, 2006) ... B-14
Figure B.14: Reinforced masonry bearing walls with concrete diaphragms (RMC) building (reproduced from FEMA 547, FEMA, 2006) ... B-15
Figure B.15: Unreinforced masonry bearing wall building (URM) building (reproduced from FEMA 547, FEMA, 2006) ... B-16
Figure B.16: Cold-formed steel (CFS) buildings (photo from BuildUsingSteel, 2018) ... B-17
1.0 INTRODUCTION
1.1 Background
There are thousands of existing buildings in Canada that could potentially suffer severe damage or collapse in the event of strong ground shaking. Assessing and mitigating seismic risk in large portfolios of existing buildings present technical and economic challenges to building owners. To address these challenges, the National Research Council Canada (NRC) developed a series of manuals and technical guidelines for seismic screening (NRC, 1993a), evaluation (NRC, 1993b), and upgrading (NRC, 1995) of existing buildings, based on the 1990 edition of the National Building Code of Canada (NBC 1990). The NRC screening manual (NRC, 1993a) was specifically developed to provide a quick and inexpensive screening procedure to identify and rank Canadian buildings in an inventory for further seismic evaluation. In 2001, Public Services and Procurement Canada (PSPC) issued the Real Property Services (RPS) Policy, which referred to the three aforementioned NRC technical guidelines. The RPS policy provides a seismic risk management approach for existing PSPC buildings.
The existing NRC technical guidelines should capture the current seismic requirements in the NBC as well as recent developments in seismic screening. The seismic code requirements in the 2015 edition of the NBC (NBC 2015) are significantly more stringent than those in the NBC 1990, on which the NRC technical guidelines and PSPC RPS Policy were based. Moreover, new methodologies for seismic screening, evaluation and retrofitting of existing buildings in the U.S. and around the world have emerged based on new data and research. A review of the state of practice and art of seismic risk screening of existing buildings is provided in APPENDIX A.
To update the existing PSPC seismic risk management approach, the NRC developed a multi-criteria and multi-level seismic risk management framework (Lounis et al., 2016). The framework consists of three key levels:
Level 1 – PST: Preliminary Seismic Risk Screening Tool (PST);
Level 2 – SQST: Semi-Quantitative Seismic Risk Screening Tool (SQST); and Level 3 – SEG: Seismic Evaluation Guidelines.
Level 1 – PST and Level 2 – SQST correspond to the first and second volumes of the framework. Level 1 – PST is published in Volume I: Level 1 – Preliminary Seismic Risk Screening Tool (PST)
for Existing Buildings, while Level 2 – SQST is published in Volume II: Level 2 – Semi-Quantitative Seismic Risk Screening Tool (SQST) for Existing Buildings. Each Volume consists of two parts: Part 1: User’s Guide and Part 2: Supporting Technical Documentation. Part 2 of Volume I is provided in this document. Level 3 – SEG is under development and will be included in Volume III of the framework.
1.2 Intent
This document, Level 1 – PST, Part 2: Supporting Technical Documentation, complements Part 1: User’s Guide. It provides details for developing the seismic risk screening procedure in the
Level 1 – PST. Specifically, it describes the key seismic risk acceptance criteria, namely (1) seismicity, (2) benchmark NBC edition, (3) remaining occupancy time, and (4) consequence of failure. Furthermore, it includes the evaluation of these key criteria using Level 2 – SQST (Volume
II) and HAZUS criteria (FEMA, 2003).
1.3 Organization
Chapter 2 presents and discusses the seismic risk acceptance criteria in Level 1 – PST, including the special conditions that immediately trigger Level 3 – SEG. Chapter 3 validates the seismic risk acceptance criteria by using the Level 2 – SQST. Chapter 4 provides details regarding the implementation of the Level 1 – PST to seventeen (17) existing buildings provided by PSPC.
2.0 DEVELOPMENT OF SEISMIC RISK ACCEPTANCE CRITERIA
This chapter provides the underlying methodology for establishing the seismic risk acceptance criteria used to assess if existing PSPC buildings covered by Part 4 of the National Building Code of Canada (NBC) are acceptable. In addition, special conditions that immediately trigger
Level 3 – SEG are discussed.
2.1 Seismicity
Six site seismic categories (SSCs) – Very Low (SSC-0), Low (SSC-1), Moderate (SSC-2), Moderately High (SSC-3), High (SSC-5), and Very High (SSC-5) – have been developed to describe the lowest to highest seismicity across Canada. Development of the site seismic
categories (SSCs) was a joint research effort between the NRC and the Department of Earth
Science at Carleton University. The term “site seismic category” is adopted to distinguish it from the term “seismic zone” used in 1993 NRC screening manual. “Site” is included in the term because site conditions are incorporated in the seismic categorization. The following sections describe the rationale for developing the six site seismic categories.
MMI scale and anticipated building damage level
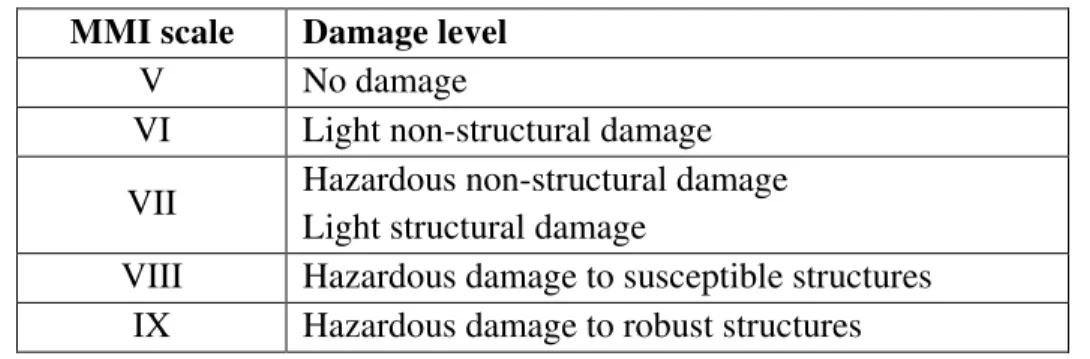
The Modified Mercalli Intensity (MMI) scale has long been used in seismic design practice to associate the perceived level of shaking with anticipated building damage. A coarse relationship between the anticipated building damage level and the MMI scale is presented in Table 2.1 (ASCE, 2016). MMI VI is generally considered to be the threshold for non-structural component damage, and MMI VII is considered to be the threshold for structural damage (Onur et al., 2008). Therefore, the MMI scale with damage level is a useful benchmark for identifying regions of low seismicity and can be used to exempt existing buildings from Level 2 – SQST.
Table 2.1: Relationship between anticipated building damage and MMI scale
Anticipated building damage level MMI scale
No damage V
Light non-structural damage VI Hazardous non-structural damage
Light structural damage VII Hazardous damage to susceptible structures VIII Hazardous damage to robust structures IX+
The definition of low seismicity should be linked to the perceived level of shaking that corresponds to MMI level V and VI, for which no damage to structural components and no to light damage to non-structural components is expected.
Relationship between MMI scale and peak ground motion parameters
The MMI scale is qualitative and correlated to the anticipated building damage level. Several researchers have proposed empirical relationships between the MMI scale and peak ground motion (PGM) parameters. PGA and PGV are the primary PGM parameters used to delineate MMI
damage levels, since they can easily be obtained from unprocessed accelerograms. A brief
summary of some key studies are presented in this regard.
Wald et al. (1999) characterized relationships between MMI, PGA (in cm/s/s) and PGV (in cm/s) values, which are used for USGS ShakeMap program definitions in the ShakeMap Manual (Wald
et al., 2006), as shown in Table 2.2. They found a good fit with Eq. (2.1) for an MMI range of V
to VIII, and with Eq. (2.2) for the IV to IX range. These relationships have been used widely in ShakeMap programs throughout the world. Note that lo� is the common logarithm.
= . × lo� � − . , for (2.1) = . × lo� − . , for I (2.2)
Table 2.2: MMI damage level thresholds (Wald et al., 1999)
Atkinson and Kaka (2004) studied the relationship between MMI and PGV values (instrumentally recorded and inferred form historical reports) for 18 earthquakes that occurred in eastern North America. They compared their results with the relationships presented by Wald et al. (1999) and concluded that the empirical relationships in eastern North America are different than in California. These differences are due to differences in the stress drop, regional attenuation, fault sizes, etc. Detailed discussion of the differences can be found elsewhere (Atkinson and Morrison, 2009). Atkinson and Kaka established the relationship between PGV and MMI as follows:
= . + . lo� (2.3) = . − . + . lo� − . lo� (2.4) where PGV is the peak ground velocity in cm/s and D is the source-to-site distance in km.
Note that the relationship proposed by Atkinson and Kaka (Eq. 2.4) is distance (D) dependent and it is not applicable to Appendix C of NBC 2015; however, for comparison, Atkinson and Kaka proposed relationships independent of distance, based on D = 1 km, D = 100 km, and D = 300 km.
Atkinson and Kaka (2007) determined relationships between ground motion and MMI that are applicable to earthquakes in the Central United States (CUS) by using data from felt moderate earthquakes in the CUS and in the New Madrid region for ShakeMap Program. They calibrated their data based on observations in California. They established the following relationship:
= . + . × lo� + . × lo� (2.5) where PGV is the peak ground velocity in cm/s, applicable both in the New Madrid region and in California, with a standard deviation of 0.78 MMI units.
Worden et al. (2012) updated the relationships established by Wald et al. (1999) and determined probabilistic relationships between ground-motion parameters and MMI in California, based on approximately 200,000 MMI observations. The earthquakes in their study ranged in magnitude from 3.0 to 7.3, and the distances from the source ranged from less than a kilometer to approximately 400 km. For intensities MMI ≥ 5, their results are in close agreement with the relations proposed by Wald et al. (1999). For lower intensities, their results fall midway between the relationships proposed by Wald et al. (1999) and those proposed by Atkinson and Kaka (2007).
= + lo� , for lo� (2.6) = + lo� , for lo� > (2.7) where is the ground-motion amplitude of the selected type, through are the fitted parameters, and is the lo� condition. Table 2.3 provides the coefficients for the above equations and the standard deviations of the residuals. Table 2.4 shows the relationship between peak ground motions and MMI scales, which is proposed by Worden et al. (2012) and used in the ShakeMap program. Note that the values in Table 2.4 are thresholds for each of MMI scales.
Table 2.3: Coefficients for relationship between ground motion and MMI (Worden et al.,
2012) Parameter � [��� � ] � � ���� � � 1.78 1.55 -1.60 3.70 1.57 4.22 0.73 0.39 3.78 1.47 2.89 3.16 0.53 4.56 0.65 0.40 � . 1.26 1.69 -4.15 4.14 2.21 4.99 0.84 0.46 � . 2.50 1.51 0.20 2.90 1.65 4.98 0.80 0.51 � . 3.81 1.17 1.99 3.01 0.99 4.96 0.95 0.69
Table 2.4: MMI damage level thresholds (Worden et al., 2012)
Caprio et al. (2015) derived a new global relationship by merging several databases collected in different geographical regions to highlight any systematic regional effects in the relationship between MMI and other ground motion parameters for the ShakeMap programs. They studied California, Italy, Greece, central eastern United States, and the global active crust. Within one standard deviation, their regional and global results are in agreement with the relations proposed by Worden et al. (2012) for California, Faenza and Michelini (2010) for Italy, Tselentis and Danciu (2008) for Greece, and Atkinson and Kaka (2007) for central eastern United States. The earthquakes in their study ranged in magnitude from 2.5 to 7.3, and the distances up to 200 km from the epicenter. They proposed the following two equations where coefficients are given in Table 2.5:
= + lo� , if lo� ��� (2.8)
= + lo� , if lo� > ��� (2.9)
Table 2.5: Coefficients for relationship between ground motion and MMI (Caprio et al.,
2015)
Region �� [��� � ] � � � � � �
Global . ± . 4.424 1.589 0.6 0.9 4.018 2.671 0.5 1.3 4.92±0.3
� . ± . 2.270 1.647 0.4 0.7 -1.361 3.822 0.4 1.4 4.87±0.3
Table 2.6 shows statistical information of calculated MMI values for all the 679 locations in Appendix C of NBC 2015. The MMI values are calculated using the relationships proposed by the aforementioned researchers: Wald et al. (1999), Atkinson and Kaka (2007), Worden et al. (2012), and Caprio et al. (2015). Worden et al. (2012) is an updated version of Wald et al. (1999) with almost the same researcher group, and therefore, it supersedes Wald et al. (1999), which has a limited database. Atkinson and Kaka (2007) includes central and eastern North America using the database from Wald et al. (1999). Caprio et al. (2015) has a larger database for California, Italy, Greece, Central-eastern United States, and the global active crust. Thus, in the following sections, the MMI values are based on Atkinson and Kaka (2007), Worden et al. (2012), and Caprio et al. (2015). Table 2.6 indicates that the difference between the MMI values based on these three studies is just one unit on the MMI scale. The results in Table 2.6 show that the considered models all predict similar MMI levels, with a minimum MMI between III and V (no real damage) over much
of central Canada, and peak MMI values of IX and X+ (hazardous damage to robust structures) for parts of Canada near the Cascadia subduction zone. The mean MMI calculated for all 679 locations in Appendix C of NBC 2015 corresponds to a damage level of no to light non-structural damage. The results shown in Table 2.6 indicate that, assuming Site Class C, a large portion of Canada is expected to experience no to light non-structural damage in the event of a design earthquake with a 2% probability of exceedance in 50 years.
Table 2.6: Statistical information for different MMI and PGV relationships
PG V (m /s) PG A (g) W1999 KA 2004-0 KA 2004-1 KA 2004-2 KA 2004-3 AK 2007 W2012 C2015 Minimum 0.020 0.030 3 4 4 4 3 5 4 4 Maximum 0.989 1.040 8 7 7 7 6 9 9 10 Median 0.079 0.085 5 5 5 5 4 6 5 6 Mean 0.147 0.153 5.2 5.2 5.3 4.8 4.6 6.1 5.6 6.2 Std. Dev. 0.178 0.153 1.4 0.8 0.8 0.7 0.7 1.0 1.3 1.2 W1999 (Wald et al., 1999), KA2004-0 (Kaka and Atkinson, 2004, with no distance term); KA2004-1 (Kaka and Atkinson, 2004, with D=1 km); KA2004-2 (Kaka and Atkinson, 2004, with D=100 km); KA2004-3 (Kaka and Atkinson, 2004, with D=300 km); AK2007 (Atkinson and Kaka, 2007); W2012 (Worden et al., 2012), and C2015 (Caprio et al., 2015).
It should be added that the the relationship proposed by Worden et al. (2012) is an updated version of that proposed by Wald et al. (1999). Worden et al. (2012) determined probabilistic relationships between ground-motion parameters and MMI in California based on approximately 200,000 MMI observations. The earthquakes in Worden et al. (1999) ranged in magnitude from 3.0 to 7.3, and the distances from the source ranged from less than a kilometer to approximately 400 km. For intensities of MMI ≥ 5, their results closely agreed with the relationships proposed by Wald et al. (1999). For lower intensities, their results fall midway between the relationships proposed by Wald
et al. (1999) and those proposed by Atkinson and Kaka (2007).
The results in Table 2.6 indicate that the MMI for Eastern Canada calculated with the relationships proposed by Kaka and Atkinson (2004) for D = 1 km and D = 100 km are similar, but the MMI for D = 300 km are slightly lower.
The results also indicate that the MMI relationships by Wald et al. (1999), Atkinson and Kaka (2007), Worden et al. (2012), and Caprio et al. (2015) were self-consistent within one MMI unit over the entire range of Canadian seismicity considered, approximately 4.5 ≤ MMI ≤ 9.5. The MMI values calculated with the relationship by Wald et al. (1999) deviated significantly from the average for MMI < 5. Therefore, it was concluded that the relationships proposed by Atkinson and Kaka (2007), Worden et al. (2012), and Caprio et al. (2015) were reasonably consistent in predicting MMI over the entire range of Canadian seismicity. In this study, the empirical
PGV-MMI correlations proposed by Worden et al. (2012) were adopted to ensure consistency with practicing engineers familiar with the USGS ShakeMap program (Worden and Wald, 2016), and the given good agreement noted with other empirical relationships. There is no need to apply the differences in calculated MMI values for Eastern and Western Canada given that the NBC 2015 separates low seismicity areas (Eastern Canada and low seismic areas) from high seismic areas (mainly Western Canada), based on reference peak ground accelerations (PGAref).
It is also important to note that the relationship between MMI damage level and peak ground motion parameters are empirical, and are affected by factors such us density of records and building practices. Since the current study is consistent with the NBC 2015, the relationships developed by the authors can be revisited for consistency with subsequent revisions to the NBC, in order to check the possible effects of such changes on their applicability.
From the comparison with observed intensity maps, USGS (2005) finds that a regression based on peak velocity for intensity for MMI greater than VII and on peak acceleration for intensity less than VII is most suitable. This is consistent with the notion that low intensities are determined by felt accounts (sensitive to acceleration). Moderate damage, at intensity VI-VII, typically occurs in rigid structures (masonry walls, chimneys, etc.) that also are sensitive to high-frequency (acceleration) ground motions. As damage levels increase, damage also occurs in flexible structures in proportion to ground velocity, not acceleration. In the literature, PGV is more often cited as being a better indicator of potential damage than PGA (Sweny, 2012), and hence peak ground velocity was selected to delineate MMI levels in the present study.
The threshold PGV values demarcating different MMI damage levels adopted as the basis for defining the site seismic categories in the Level 1 – PST were proposed by NRCan (Halchuk, 2017). These thresholds, listed in Table 2.7, were mapped onto the MMI scale based on the work of Worden et al. (2012). For comparison, Table 2.7 also shows the PGV thresholds used to define seismic categorization as per NRCan (Halchuk, 2017) and Heidebrecht et al. (1983), and converted to MM. The NRCan (Halchuk, 2017) and Heidebrecht et al. (1983) PGV thresholds are similar. However, the NRCan thresholds are more convenient for practicing engineers since there are fewer regions to consider.
Table 2.7: Building damage levels correlated to PGV thresholds
Building damage level MMI
scale
Threshold PGV (m/s) mapped to MMI scale (Worden et al., 2012) NRCan (Halchuk, 2017) Heidebrecht et al. (1983) > > No damage V 0.050 0.05
Light non-structural damage VI 0.050 0.100 0.05 0.10
Hazardous non-structural damage
Light structural damage VII 0.100 0.200
0.10 0.15
0.15 0.20
Hazardous damage to susceptible
structures VIII 0.200 0.450
0.20 0.30
0.30 0.40
Hazardous damage to robust
structures IX+ 0.450 0.40
Relationships between spectral response accelerations and peak ground velocity The threshold values given in Table 2.7 correlate peak ground velocity – PGV – to damage level defined by the MMI scale. However, in seismic design, seismic hazard is commonly described through the use of a uniform hazard spectrum with respect to a specified probability of exceedance in 50 years; therefore it would be desirable to relate MMI damage level to code level spectral response accelerations. Using MMI-Sa thresholds has a number of advantages, including: (1) a
better representation of building response, (2) familiarity of response spectrum to practicing engineers, and (3) the ability to readily incorporate the influence of soil conditions through existing site coefficients.
Seismic categorization is commonly conducted in terms of spectral acceleration parameters at short periods and long periods. For example, in ASCE 7, seismic design categories (SDCs) are tied to specific threshold values � and , which are comparable to F(0.2)Sa(0.2) and F(1.0)Sa(1.0)
in the NBC 2015. Although the NBC 2015 utilizes 5% damped spectral response accelerations at 0.2, 0.5, 1.0, 2.0, 5.0, and 10 seconds to cover the full spectral shape, it places restrictions on using different seismic force-resisting systems based on IEF(0.2)Sa(0.2) and IEF(1.0)Sa(1.0); respecting
these indices would facilitate the applicability and practicality of any screening tool developed for the Canadian context.
As part of research collaboration with the Department of Earth Science at Carleton University, the MMI-PGV limits given in Table 2.7 were converted into MMI-Sa thresholds. This conversion was
conducted by developing intermediate relationships between PGV and each of � . , � . , and � . , based on the Geological Survey of Canada’s (GSC) “Fifth Generation Seismic Hazard Model Input Files” (Halchuk et al., 2015) used to produce the NBC 2015 uniform hazard spectra with 2% probability of exceedance in 50 years, assuming Site Class C.
= + (2.10)
= + + (2.11)
= + + + (2.12)
= + 2 (2.13)
The quadratic Eq. (2.11) provides the best fit to the GSC database (Table 2.8), and therefore, it is used in the present study.
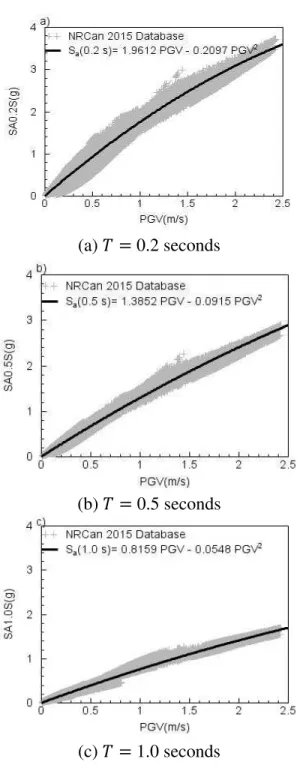
Table 2.8: Sa-PGV relationships based on the Geological Survey of Canada’s (GSC) “Fifth Generation Seismic Hazard Model Input Files” databases (Halchuk et al., 2015)
Y=c1+c2×PGV+c3×PGV2 Y Sa(0.2) Sa(0.5) Sa(1.0) c1 0 0 0 c2 1.9621 1.3852 0.8159 c3 -0.2097 -0.0915 -0.0548 R2 0.97 0.99 0.99
Figure 2.1 (a), (b) and (c) show the distribution of spectral response accelerations versus PGV for 0.2, 0.5 and 1.0 seconds, respectively, along with the curve fitting expressions of the form given in Table 2.8.
(a) = 0.2 seconds
(b) = 0.5 seconds
(c) = 1.0 seconds
Figure 2.1: Relationship between PGV and Sa(T) for T= 0.2, 0.5, and 1.0 seconds
Relationships between MMI scale and spectral response accelerations
The relationships developed for PGV- � shown in Figure 2.1 were mapped to the MMI-PGV bounds listed in Table 2.7. The results of the mapping process are shown in
The calculated mean MMI for each site seismic category is in good agreement with the established MMI damage levels. Furthermore, of the 679 locations listed in Appendix C of Division B of the NBC 2015, 153 locations are expected to experience ground shaking equal to MMI V generating no damage, and another 233 are expected to experience ground shaking equal to MMI VI generating light damage in non-structural elements. Similarly, the seismic hazard at 53 locations is consistent with MMI IX causing hazardous damage to robust structures.
Table 2.9: MMI-Sa thresholds based on PGV and Sa bounds
MMI scale Halchuk (2017) Thresholds PGV (m/s) Mean MMI Max[Sa(0.2), Sa(0.5)] Sa(1.0) No. of locations† (679 total) > > > MMI V 0.050 <5.8 0.098 g 0.041 g 153 MMI VI 0.050 0.100 6.2 0.098 g 0.194 g 0.041 g 0.081 g 233 MMI VII 0.100 0.200 7.0 0.194 g 0.384 g 0.081 g 0.161 g 131 MMI VIII 0.200 0.450 7.8 0.384 g 0.840 g 0.161 g 0.356 g 109 MMI IX+ 0.450 >8.3 0.840 g 0.356 g 53
† – Calculated for Site Class C
Adjustment of spectral acceleration thresholds of site seismic categories
The MMI- � thresholds were found to show a striking similarity to the system restrictions placed on seismic force-resisting systems listed in Table 4.1.8.9 of the NBC 2015. Therefore, to maintain consistency with the NBC to the benefit of practising engineers, the MMI- � thresholds in Table 2.9 were adjusted to align with NBC 2015 as follows:
1. A new region of Very Low site seismic category (SSC-0) was defined [corresponding to MMI V]. The threshold of the maximum of Sa(0.2) and Sa(0.5) was rounded to 0.1 g. The
threshold of Sa(1.0) was back-calculated based on the PGV- � . relationship. This
region of Very Low site seismic category (SSC-0) was developed to reflect the need for
buildings such as emergency facilities to remain operational and functional after a seismic
event;
2. The threshold of the maximum of Sa(0.2) and Sa(0.5) for MMI VI, VII and VIII were
slightly adjusted to 0.2 g, 0.35 g and 0.75 g, respectively, to suit the SFRS restrictions in the NBC 2015, with corresponding values of Sa(1.0) being back-calculated from the
PGV-� . relationships;
3. To reduce the ground motion variability and to provide a more uniform representation of regions of high seismicity in Canada, the MMI IX+ category was subdivided into two regions with intermediate bound applied to the maximum of Sa(0.2) and Sa(0.5) of 1.15 g
and Sa(1.0) of 0.50 g; and
It is noteworthy that the NBC 2015 only specifies one threshold of Sa(1.0) for seismic design
restrictions in Table 4.1.8.9. The adjusted thresholds for the six site seismic categories are shown in
Table 2.10, alongside the the approximate MMI scales.
Table 2.10: Site seismic categories and associated MMI scales
Site seismic category S(0.2) S(1.0) MMI Scale
> >
Very Low (SSC-0) 0.10 g 0.05 g MMI V
Low (SSC-1) 0.10 g 0.20 g 0.05 g 0.10 g MMI VI
Moderate (SSC-2) 0.20 g 0.35 g 0.10 g 0.15 g MMI VI½
Moderately High (SSC-3) 0.35 g 0.75 g 0.15 g 0.30 g MMI VII½
High (SSC-4) 0.75 g 1.15 g 0.30 g 0.50 g
MMI VIII+
Very High (SSC-5) 1.150 g 0.500 g
The site seismic category based on S(0.2) [maximum of F(0.2)Sa(0.2) and F(0.5)Sa(0.5)] may be
different from the seismic category based on S(1.0) [F(1.0)Sa(1.0)]. In this case, select the higher
as the site seismic category.
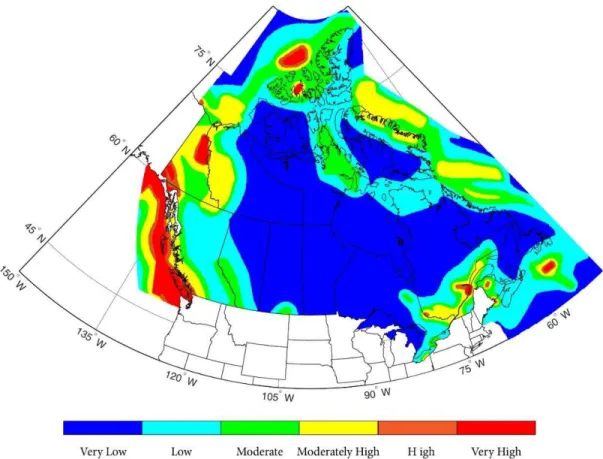
Figure 2.2 shows a site seismic category map assuming Site Class C. Based on this map, 406 out of 679 locations in Appendix C of the NBC 2015 fall into regions of Very Low and Low site
seismic categories (SSC-0 and SSC-1), corresponding to anticipated damage levels of light
non-structural damage or less. A small number of locations, predominately on the west coast, would be tagged as having Very High site seismic category (SSC-5), with very severe levels of damage expected. The map also shows that under typical soil condition (i.e., Site Class C), much of central Canada and portions of Eastern Canada would be exempt from the Level 2 – SQST, based on the threshold values defined by SSC-0 (no damage) and SSC-1 (light non-structural damage).
Figure 2.2: Site seismic category map for Canada assuming Site Class C
An example of determining site seismic category
Determination of the site seismic category of Alberni, British Columbia is presented as an example. The PGA, Sa(0.2), Sa(0.5), and Sa(1.0) values for Alberni are 0.434 g, 0.955 g, 0.915 g
and 0.594 g, respectively, for reference Site Class C, from Appendix C of Division B of the NBC 2015. Since Sa(0.2)/PGA = 0.955/0.434 ≥ 2, PGAref = 0.434 g. In the NBC 2015, spectral
response accelerations are adjusted for different Site Classes by multiplying Sa(T) by site
coefficients F(T). F(T) for Site Classes A, B, C, D, and E are provided in the NBC 2015. Note that the site coefficients for Site Class C are set to be unity.
If the location is in Site Class A, the procedure to determine the site seismic category is presented below:
1. Calculate S(0.2) = Sa(0.2) × F(0.2) = 0.955 g × 0.69 = 0.659 g;
2. Calculate S(0.5) = Sa(0.5) × F(0.5) = 0.915 g × 0.57 = 0.522 g;
3. Determine Max [S(0.2), S(0.5)] = 0.659 g, which is in the range of SSC-3;
4. Calculate S(1.0) = Sa(1.0) × F(1.0) = 0.594 g × 0.57=0.339 g, which is in the range of
The calculated Max [S(0.2), S(0.5)] and S(1.0) are in the ranges of SSC-3 and SSC-4, respectively. Thus, the site seismic category is the higher of SSC-3 and SSC-4, which is SSC-4.
If the same location is in Site Class C, then the site coefficients for Site Class C are unity because the site effect is already included in Sa(0.2) and Sa(1.0). The procedure to determine the site seismic
category is presented below:
1. Calculate S(0.2) = Sa(0.2) × F(0.2) = 0.955 g × 1.00 = 0.955 g;
2. Calculate S(0.5) = Sa(0.5) × F(0.5) = 0.915 g × 1.00 = 0.915 g;
3. Determine Max [S(0.2), S(0.5)] = 0.955 g, which is in the range of SSC-4;
4. Calculate S(1.0) = Sa(1.0) × F(1.0) = 0.594 g × 1.00 = 0.594 g, which is in the range of
SSC-5;
The calculated Max [S(0.2), S(0.5)] and S(1.0) are in the ranges of SSC-4 and SSC-5, respectively. Thus, the site seismic category is the higher of SSC-4 and SSC-5, which is SSC-5.
If the same location is in Site Class E, then:
1. Calculate S(0.2) = Sa(0.2) × F(0.2) = 0.955 g × 0.90 = 0.860 g;
2. Calculate S(0.5) = Sa(0.5) × F(0.5) = 0.915 g × 1.26 = 1.153 g;
3. Determine Max [S(0.2), S(0.5)] = 1.153 g, which is in SSC-5;
4. Calculate S(1.0) = Sa(1.0) × F(1.0) = 0.594 g × 1.53 = 0.909 g, which is in SSC-5.
The calculated Max [S(0.2), S(0.5)] and S(1.0) are both in the SSC-5 range. Thus, the site seismic
category is SSC-5.
2.2 Benchmark NBC edition
Model building type
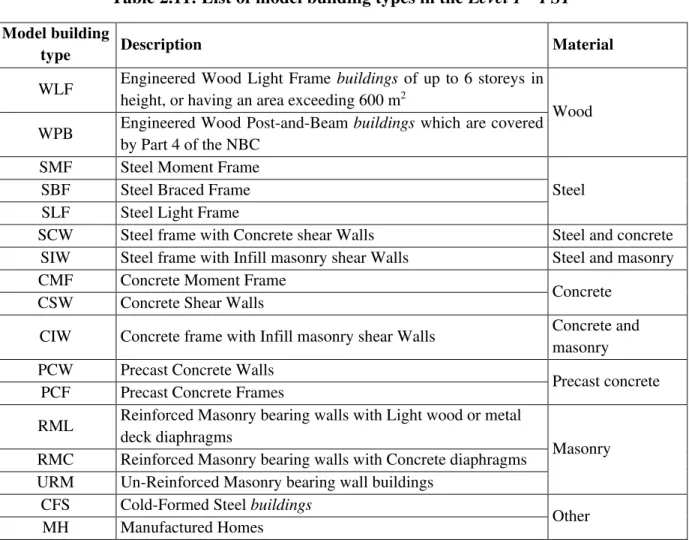
One of the key factors that influences a building’s seismic performance is the model building type defined in terms of the construction materials and type of seismic force-resisting system (SFRS). In the Level 1 – PST, model building types are largely based on the 1993 NRC screening manual, with two additional model building types, namely cold-formed steel (CFS) buildings and manufactured homes (MH). Including these two new model building types reflects the advances in seismic design/construction practices in the last two decades. Table 2.11 provides a summary of the names and descriptions used to define the model building types. The details of characteristics and typical damage of each model building type are provided in APPENDIX B.
Table 2.11: List of model building types in the Level 1 – PST
Model building
type Description Material
WLF Engineered Wood Light Frame buildings of up to 6 storeys in height, or having an area exceeding 600 m2
Wood WPB Engineered Wood Post-and-Beam buildings which are covered
by Part 4 of the NBC
SMF Steel Moment Frame
Steel
SBF Steel Braced Frame
SLF Steel Light Frame
SCW Steel frame with Concrete shear Walls Steel and concrete
SIW Steel frame with Infill masonry shear Walls Steel and masonry
CMF Concrete Moment Frame
Concrete
CSW Concrete Shear Walls
CIW Concrete frame with Infill masonry shear Walls Concrete and
masonry
PCW Precast Concrete Walls
Precast concrete
PCF Precast Concrete Frames
RML Reinforced Masonry bearing walls with Light wood or metal deck diaphragms
Masonry RMC Reinforced Masonry bearing walls with Concrete diaphragms
URM Un-Reinforced Masonry bearing wall buildings
CFS Cold-Formed Steel buildings
Other
MH Manufactured Homes
Identification of benchmark NBC editions
Generally, the NBC publishes periodic editions (i.e., every five years), which include revisions regarding seismic design requirements for new buildings. The NBC edition in which significantly improved seismic code requirements were adopted and enforced (which varies depending on
model building type) is referred to as the benchmark NBC edition. Any building originally designed
to or fully seismically upgraded to an applicable benchmark NBC edition or newer is referred to as a post-benchmark building.
The benchmark NBC edition varies depending on the model building type because the major improvements to the seismic provisions for different model building types may be adopted and enforced in different code editions. The identification of benchmark NBC editions is complex because it requires tracking the evolution of seismic design provisions in NBC editions and relevant standards to determine the specific code edition in which significantly improved seismic code provisions for a specific building type were adopted and enforced. Karbassi and Nollet (2008) identified the NBC 1970 as the benchmark NBC edition for all building types. The NBC 1970 was chosen because major changes were made in it. For example, the probabilistic seismic zoning maps
were first introduced, and the base shear was expressed as a function of building period. However, additional significant changes were made after the NBC 1970. For example, in the NBC 2005, uniform hazard spectra with a probability of 2% in 50 years were used for designing new buildings, and limitations and additional requirements for weak storey and other structural irregularities were introduced. Tischer (2014) adopted the NBC 1990 from the NRC screening manual (NRC, 1993a) as the benchmark NBC edition for all building types in an adapted seismic screening method. It is noteworthy that the NRC screening manual was qualitative based on seismic demand of existing
buildings; the NBC 1990 was selected because the manual was made compatible with the
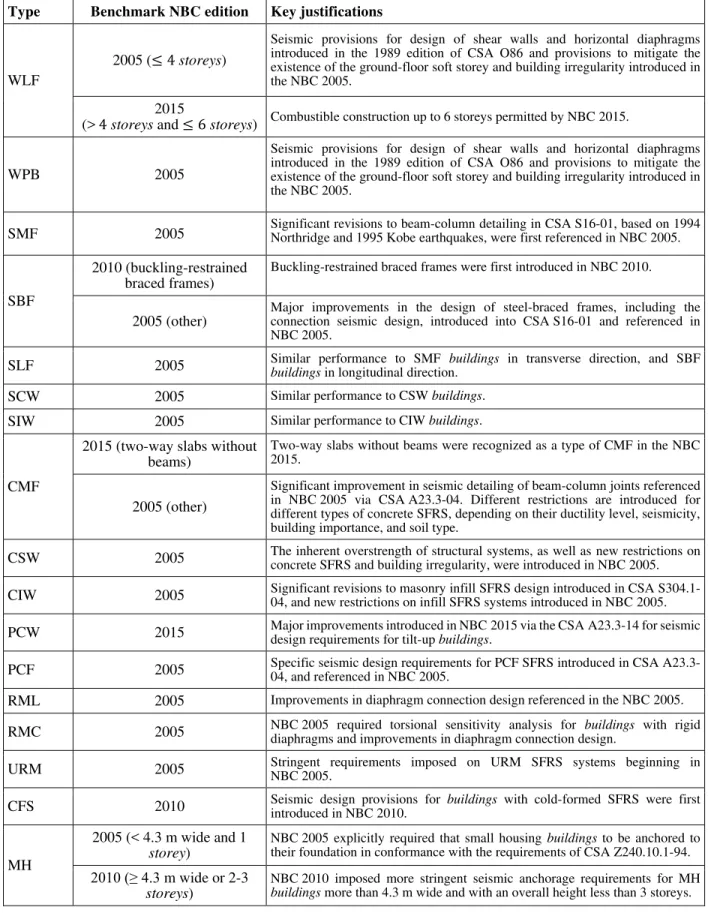
NBC 1990. Saatcioglu et al. (2013) developed seismic screening software based on the NRC screening manual. The software is compatible with the seismic requirements set out in the NBC 2010, which was selected as the benchmark NBC edition. It is noteworthy that the studies by Tischer (2014) and Saatcioglu et al. (2013) did not investigate the major changes made in the seismic provisions in the NBC and relevant design standards for each specific model building type. Hence, the benchmark NBC editions in these studies could not be adopted in the Level 1 – PST. In the United States, the benchmark NBC editions for different building types are determined by identifying the model building code editions in which significantly improved seismic requirements were adopted and enforced. Given the close technical cooperation that exists between Canadian and American engineers, many aspects of the NBC are essentially identical to those in the Uniform Building Code (UBC) (Uzumeri et al., 1978). The evolution of the UBC and NBC is provided in APPENDIX C of this document. After determining the edition of the applicable UBC in which major seismic design improvements were adopted and enforced for a specified building type, the corresponding changes are tracked down in the NBC and relevant standards to determine the applicable benchmark NBC edition for the corresponding model building type in Canada. Table 2.12 presents the benchmark NBC editions and key detailed justifications for the seventeen
model building types. More details on the determining the benchmark NBC editions can be found
Table 2.12: Benchmark NBC editions and key justifications
for seventeen model building types
Type Benchmark NBC edition Key justifications
WLF
2005 ( storeys)
Seismic provisions for design of shear walls and horizontal diaphragms introduced in the 1989 edition of CSA O86 and provisions to mitigate the existence of the ground-floor soft storey and building irregularity introduced in the NBC 2005.
2015
(> storeys and storeys) Combustible construction up to 6 storeys permitted by NBC 2015.
WPB 2005
Seismic provisions for design of shear walls and horizontal diaphragms introduced in the 1989 edition of CSA O86 and provisions to mitigate the existence of the ground-floor soft storey and building irregularity introduced in the NBC 2005.
SMF 2005 Significant revisions to beam-column detailing in CSA S16-01, based on 1994 Northridge and 1995 Kobe earthquakes, were first referenced in NBC 2005.
SBF
2010 (buckling-restrained braced frames)
Buckling-restrained braced frames were first introduced in NBC 2010.
2005 (other)
Major improvements in the design of steel-braced frames, including the connection seismic design, introduced into CSA S16-01 and referenced in NBC 2005.
SLF 2005 Similar performance to SMF buildings in transverse direction, and SBF buildings in longitudinal direction. SCW 2005 Similar performance to CSW buildings.
SIW 2005 Similar performance to CIW buildings.
CMF
2015 (two-way slabs without beams)
Two-way slabs without beams were recognized as a type of CMF in the NBC 2015.
2005 (other)
Significant improvement in seismic detailing of beam-column joints referenced in NBC 2005 via CSA A23.3-04. Different restrictions are introduced for different types of concrete SFRS, depending on their ductility level, seismicity, building importance, and soil type.
CSW 2005 The inherent overstrength of structural systems, as well as new restrictions on concrete SFRS and building irregularity, were introduced in NBC 2005. CIW 2005 Significant revisions to masonry infill SFRS design introduced in CSA S304.1-04, and new restrictions on infill SFRS systems introduced in NBC 2005. PCW 2015 Major improvements introduced in NBC 2015 via the CSA A23.3-14 for seismic design requirements for tilt-up buildings. PCF 2005 Specific seismic design requirements for PCF SFRS introduced in CSA A23.3-04, and referenced in NBC 2005. RML 2005 Improvements in diaphragm connection design referenced in the NBC 2005. RMC 2005 NBC 2005 required torsional sensitivity analysis for buildings with rigid diaphragms and improvements in diaphragm connection design. URM 2005 Stringent requirements imposed on URM SFRS systems beginning in NBC 2005. CFS 2010 Seismic design provisions for buildings with cold-formed SFRS were first introduced in NBC 2010.
MH
2005 (< 4.3 m wide and 1
storey)
NBC 2005 explicitly required that small housing buildings to be anchored to their foundation in conformance with the requirements of CSA Z240.10.1-94. 2010 (≥ 4.3 m wide or 2-3
storeys)
NBC 2010 imposed more stringent seismic anchorage requirements for MH
In the Level 1 – PST, benchmark NBC editions do not apply to non-structural components because non-structural components have been found to have been designed, installed, or modified without enforcement of applicable building code provisions (Masek and Ridge, 2009; ASCE, 2013).
The benchmark NBC editions in Table 2.12 correspond to the applicable NBC editions. It is typical that the provincial or municipal building code release dates in the areas screened lag behind the applicable NBC editions, and that the design and construction of a building lag behind the provincial or municipal building code release dates. In the seismic screening process, benchmark
NBC editions shall only be identified based on well-documented sources, such as original
structural drawings or by consulting with the local authority having jurisdiction.
2.3 Remaining occupancy time
An existing building with a shorter remaining occupancy life has a smaller chance of experiencing a code-level earthquake event over its remaining life (ASCE, 2017). Furthermore, for many publicly owned buildings, the time required for planning, conducting and completing a seismic retrofit may be greater than the remaining planned occupancy time of the building; hence a detailed evaluation of these structures is not warranted. A building is exempt from detailed seismic risk assessment if it can be shown that the remaining occupancy time is short enough to drop the seismic design spectra to an appreciably low level. This section describes the development of the
seismic risk acceptance criterion based on the building’s remaining occupancy time.
If a building is designed for an earthquake hazard with a constant probability of exceedance over its original design service life (i.e., 50 years), it becomes increasingly less likely that the building will experience the design earthquake hazard as it nears the end of its design service life. To demonstrate this concept, consider the expression for the probability of exceedance in years, based on the Poisson process (Commentary J of User’s Guide – Part 4 of Division B of NBC 2010 Structural Commentaries), given below:
= − −� pe yea ∙ (2.14)
where per year = /return period denotes the probability of exceedance per year.
New buildings in Canada are designed for the effects of an earthquake with a probability of exceedance = % over a service life of 50 years. This yields an annual probability of exceedance per year = . % and a return period of 2,475 years. Assuming a constant probability of exceedance of 2%, the corresponding per year for an existing building with =
years remaining occupancy time is 0. 202%, which is equal to a return period of 495 years. This is roughly equivalent to a 10% in 50 years seismic event, which corresponds to a return period of 475 years. Similarly, the return period for a building with 2 years of remaining occupancy time
– for a hazard with a 2% chance of exceedance – is 97 years, which is equivalent to a 40% in 50
probability of exceedance over a 50 year period, reducing the time horizon to less than the original service life of 50 years implies a reduction in the equivalent earthquake return period, and consequently, a reduction in the anticipated design response spectra.
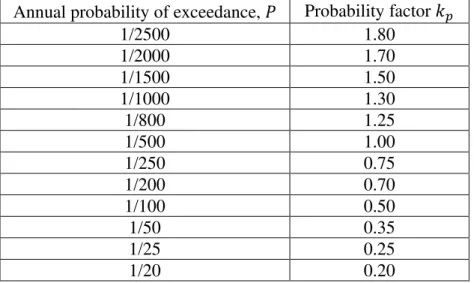
In Australian Standard AS 1170.4 (2007), a probability factor � is introduced for the earthquake annual probability of exceedance (Table 2.13), which is applied to a baseline seismic hazard value with a return period of 500 years, in order to adjust the seismicity for different return periods between 20 and 2500 years. The use of a factor similar to � was of interest in developing the
Level 1 – PST for buildings with a remaining occupancy time less than 50 years (by multiplying
� to � thresholds for different site seismic categories). However, the applicability in
Canada of the values for � proposed in Australian Standard AS 1170.4 (2007) needs further investigation.
Table 2.13: Annual Probability of Exceedance and Probability Factor kp (AS1170.4, 2007)
Annual probability of exceedance, Probability factor �
1/2500 1.80 1/2000 1.70 1/1500 1.50 1/1000 1.30 1/800 1.25 1/500 1.00 1/250 0.75 1/200 0.70 1/100 0.50 1/50 0.35 1/25 0.25 1/20 0.20
Based on the preceding discussion, a remaining occupancy time factor, �, was developed to account for the reduction in the probability of experiencing a Code-level earthquake for a building with a remaining occupancy time less than the design life of 50 years. The � factor is used to scale response spectra to return periods other than 2 475 years following:
%⁄ = � ∙ %⁄ (2.15)
where %⁄ is the design spectral acceleration for a hazard with a probability of exceedance of 2% in 50 years, and %⁄ is the reduced design spectral acceleration for a hazard with a probability of exceedance of 2% in years.
The remaining occupancy time reduction factor � is a function of remaining occupancy time and was developed by analyzing the variation in design spectral accelerations at = 0.2 and 1.0 seconds, for four different probabilities of exceedance values: 2% in 50 years, 5% in 50 years,
10% in 50 years, and 40% in 50 years. These data were obtained from Halchuk et al. (2015) for all 679 locations listed in NBC 2015. Using Eq. (2.15), these hazards with a given probability of exceedance such as 10% in 50 years may be converted into equivalent hazards with a 2% probability of exceedance in years. Therefore, a hazard with a probability of exceedance of 5% in 50 years is equivalent to 2% in 20 years. Likewise, 10% in 50 years is equivalent to 2% in 10 years, and 40% in 50 years is equivalent to 2% in 2 years.
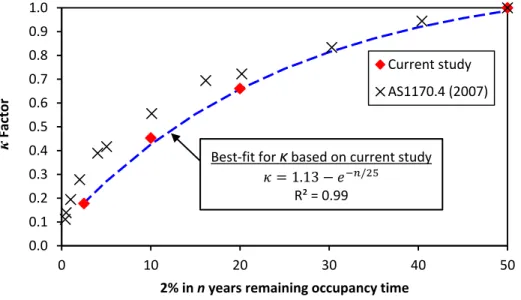
For each location and for each of the four annual probability of exceedance values considered, the design spectral accelerations for Site Class A through E are calculated for = 0.2 and 1.0 seconds by multiplying � values by corresponding site coefficients. Then, for each location and for each Site Class, the � factor is computed respectively for both . and . as the ratio of the design spectral accelerations for a hazard with 5% in 50 years, 10% in 50 years and 40% in 50 years, relative to a baseline hazard of 2% in 50 years. The � factors obtained for both = 0.2 and 1.0 seconds for all locations and Site Classes within each of the four probability of exceedance values were averaged to construct the relationship between � and 2% in years of remaining
occupancy time, as shown in Figure 2.3. The coefficient of variations applied to � were 7%, 13%,
and 26% for an equivalent hazard with a probability of 2% in 20 years, 2% in 10 years, and 2% in 2 years, respectively. Based on the input hazard values for each of the four probabilities, � was found to vary as a function of remaining occupancy time between � = 1.00 for =50 years, and � = 0.17 for =2 years.
Figure 2.3: Relationship between κ and the hazard with 2% in n years remaining occupancy time
Figure 2.3 also shows a comparison of the AS1170.4 (2007) � factor, adjusted for a baseline corresponding to a return period of 2475 years, with the � term of the current study. The
0.0 0.1 0.2 0.3 0.4 0.5 0.6 0.7 0.8 0.9 1.0 0 10 20 30 40 50 κ Factor
2% in n years remaining occupancy time
Current study AS1170.4 (2007)
Best-fit for κbased on current study � = . − − /
comparison shows that both seismicity adjustment factors yield similar estimates of reduced seismicity for different return periods. While both � and � may be used to correlate seismic hazard values having different return periods, the � factor was used to develop the seismic risk acceptance criteria based on remaining occupancy time in the Level 1 – PST since it is developed using Canadian earthquake records.
2.4 Consequences of failure
The failure of buildings can pose different levels of consequences associated with seismic risk to life safety. In the NBC 2015, low, normal, high, and post-disaster importance categories, which are defined based on use and occupancy, are used to address different building’ consequences of failure. For example, schools are classified in the high importance category and therefore an importance factor of IE = 1.3 is taken to increase the building capacity and in turn reduce the
probability of failure with code-level earthquake shaking. However, the importance categories do not take into consideration other applicable key factors that contribute to the consequences of failure, such as building size, accessibility to escape, etc. For example, although a one-storey office
building and a twenty-storey office building are classified in the same importance category
(normal), the levels of consequences of failure for these two buildings differ significantly, given that the taller office building can accommodate far more occupants and requires more time to evacuate its occupants. In the Level 1 – PST, the consequence classification system proposed by Fathi-Fazl and Lounis (2017a) is adopted to consider existing buildings’ consequences of failure. The system is based on the synthesis of different building consequences of failure classifications in existing codes, standards and guidelines in Canada and other countries. The proposed consequences of failure consist of three classes, namely: (i) Consequence Class – Low (CC-L), (ii) Consequence Class – Medium (CC-M), and (iii) Consequence Class - High (CC-H). These three classes are further divided into five levels, namely: Very Low Consequences, Low Consequences, Medium Consequences, High Consequences, and Very High Consequences. The key requirements that govern the consequence classification depend on the type of occupancy, building size, ability and mobility to escape, etc. Consequences of failure for different building occupancies are stipulated in Part 1: User’s Guide of the Level 1 – PST.
2.5 Summary of seismic risk acceptance criteria
Table 2.14 presents a summary of the seismic risk acceptance criteria. The remaining occupancy
time should not be applied to buildings of Very High Consequences, given the extremely high
Table 2.14: Seismic risk acceptance criteria
Site seismic category (SSC)
Post-benchmark building NOT post-benchmark building Structure Non-structural components Structure and non-structural components
COF Consequences of failure (COF) Consequences of failure (COF)
Any level Any except VHC VHC VLC LC & MC HC VHC
SSC-0 Met Met Met Met SSC-1 Not Met Met Met if n ≤ 10; Not Met if n >10 Not Met SSC-2 Not Met
Met if n ≤ 10; Not Met if n >10 Met if n ≤ 5;
Not Met if n >5
SSC-3 Met if n ≤ 5; Not Met if n >5
Not Met
SSC-4 & SSC-5 Not Met
Note: n refers to the remaining occupancy time (years).
2.6 Building deterioration and damage
Building deterioration and damage have the potential to impact an existing building’s expected
performance. Therefore, it is critical to consider this matter during seismic risk assessment. In the presence of any deterioration or damage (e.g., extensive dry rot, deformation, corrosion, or concrete spalling), the building is required to be further assessed using the Level 2 – SQST. In other words, the Level 1 – PST can only be used in cases where there is no history of deterioration or
damage that has not been repaired at the time of screening.
2.7 Special conditions triggering the Level 3 – SEG
Unknown model building type
An existing building’s seismic performance highly depends on its model building type, which is defined according to its construction materials and type of seismic force-resisting system (SFRS). If the model building type is unknown, the building’s seismic resistance is largely uncertain. Consequently, the Level 3 – SEG should be triggered to further investigate the building’s seismic
risk.
Federal heritage designation
A building identified as federal heritage designation is one that has a profound importance to Canada by virtue of its direct association with a nationally significant aspect of Canadian history (Historic Sites and Monuments Board of Canada 2008). Given the potential social consequences resulting from the failure of such highly regarded buildings, buildings identified as federal heritage
Change of occupancy increasing structural loads
An existing building’s occupancy may change for different reasons during its service life. This change may increase structural loads other than seismic. If this is the case, the Level 3 – SEG should be triggered to assess the effect that the change in structural loads has on the building’s seismic performance.
Consequences of failure higher than original consequences of failure
The change in building occupancy may result in increased consequences of failure. Consequences of failure may also increase as a result of building addition(s) that affects the number of storeys and total floor area. The Level 1 – PST does not address the effect of increased consequences of failure. Level 3 – SEG should be triggered to assess the effect of increased consequences of failure in existing buildings.
Site Class F
According to the current edition of the NBC, no site coefficients are provided for Site Class F (such as liquefiable soils and quick and highly sensitive clays), and site-specific evaluation is required. Since Site Class F’s effect on buildings’ seismic performance is highly uncertain, the
Level 1 – PST flags buildings with Site Class F for the Level 3 – SEG.
Geologic hazards
Geologic hazards are conditions present at or near the building foundation with the potential to
significantly increase the building’s seismic vulnerability. Given the potential negative effect,
buildings located on or near any geologic hazards should be immediately flagged for the Level 3 – SEG. In the Level 1 – PST, geologic hazards include liquefaction, landslide potential,
3.0 EVALUATION OF SEISMIC RISK ACCEPTANCE CRITERIA
3.1 General
The Level 1 – PST provides seismic risk acceptance criteria that can be used to exempt existing
buildings from the Level 2 – SQST. This section presents the evaluation of the seismic risk
acceptance criteria using the Level 2 – SQST and HAZUS criteria.
3.2 Overview of the Level 2 – SQST
The Level 2 – SQST developed by Fathi-Fazl et al. (2018) is intended to be the second level of a
seismic risk management framework proposed by Lounis et al. (2016). It is preceded by the Level 1 – PST. The Level 2 – SQST consists of a quantitative structural seismic risk scoring system
and a qualitative seismic risk scoring system for non-structural components. Structural scores and non-structural component scores are calculated separately and compared with the corresponding structural and non-structural component thresholds to determine whether a building’s seismic risk is acceptable.
In the Level 2 – SQST, structural score, , is defined as the negative common logarithm of the probability of collapse given a code level earthquake (CLE) associated with a specified seismic
zone, i.e.,
= − lo� [ | ] (3.1)
Note that the seismic zones in the Level 2 – SQST correspond to the site seismic categories for
Site Class C in the Level 1 – PST.
The structural score can be also expressed as:
= �+ ∑ � �
(3.2)
where: � is a basic structural score that is related to the probability of collapse for a given model
building type and seismic zone, and � is the structural score modifier accounting for the effect of
ith parameter on the building’s seismic performance.
The structural score is compared with a corresponding structural score threshold H in Table 3.1 to determine whether the structural seismic risk is acceptable (Fathi-Fazl et al., 2018).