Publisher’s version / Version de l'éditeur:
Vous avez des questions? Nous pouvons vous aider. Pour communiquer directement avec un auteur, consultez la
première page de la revue dans laquelle son article a été publié afin de trouver ses coordonnées. Si vous n’arrivez pas à les repérer, communiquez avec nous à [email protected].
Questions? Contact the NRC Publications Archive team at
[email protected]. If you wish to email the authors directly, please see the first page of the publication for their contact information.
https://publications-cnrc.canada.ca/fra/droits
L’accès à ce site Web et l’utilisation de son contenu sont assujettis aux conditions présentées dans le site LISEZ CES CONDITIONS ATTENTIVEMENT AVANT D’UTILISER CE SITE WEB.
ICANM 2019: International Conference and Exhibition on Advanced and Nano
Materials, 2019-08-14
READ THESE TERMS AND CONDITIONS CAREFULLY BEFORE USING THIS WEBSITE. https://nrc-publications.canada.ca/eng/copyright
NRC Publications Archive Record / Notice des Archives des publications du CNRC :
https://nrc-publications.canada.ca/eng/view/object/?id=7a58bd8d-91bf-453e-880a-e5f94d9b4159 https://publications-cnrc.canada.ca/fra/voir/objet/?id=7a58bd8d-91bf-453e-880a-e5f94d9b4159
NRC Publications Archive
Archives des publications du CNRC
This publication could be one of several versions: author’s original, accepted manuscript or the publisher’s version. / La version de cette publication peut être l’une des suivantes : la version prépublication de l’auteur, la version acceptée du manuscrit ou la version de l’éditeur.
Access and use of this website and the material on it are subject to the Terms and Conditions set forth at
Microscopic characterization of antifouling membrane coated by
core-shell star block copolymers
MICROSCOPIC CHARACTERIZATION OF ANTIFOULING MEMBRANE COATED BY CORE-SHELL STAR BLOCK COPOLYMERS
J.-Y. Cho1, M. A. Islam2, V, A. Piunova3, Y.-H. La3, M. Sadrzadeh2 and A. Myles1
1National Research Council CANADA - Nanotechnology Research Centre, 11421 Saskatchewan Drive,
Edmonton, Alberta T6G 2M9, Canada
(*Corresponding author: [email protected])
2
Department of Mechanical Engineering, 10-367 Donadeo Innovation Centre for Engineering, University of Alberta, Edmonton, AB T6G 1H9, Canada
3 IBM Almaden Research Center, 650 Harry Road, San Jose, CA 95120, USA
ABSTRACT
Nano-sized core shell star block copolymers which have a hydrophobic core and hydrophilic arms have attracted considerable attention in recent years since their high areal density generate a thin and stable coating on various membrane surfaces through a self-assembly process for better antifouling properties of ultrafiltration system. This unique structure of star block copolymers makes it stick to the hydrophobic surface and render highly hydrophilic membrane surface for the better antifouling property. Therefore, complete understanding of its detail structures depending on temperature is the key of utilizing this product in membrane applications. In this study, a novel ultra-thin coating consisting of self-assembled star-shaped block copolymers which have different types of arms was used to increase the antifouling properties of membrane. In order to understand the relationship between the surface structure of coating and antifouling properties, various cutting-edge microscopic characterization methods such as scanning electron microscopy (SEM), focused ion beam (FIB), transmission electron microscopy (TEM) and atomic force microscopy (AFM) were used. Especially, new phase mode AFM imaging was introduced for the illustration of local hydrophobicity/hydrophilicity on the surface of star polymer (SP) coated membrane.
KEYWORDS: water membrane, antifouling coating, star block copolymer, SEM, FIB, TEM, AFM, HT-TEM, HT-AFM
1 INTRODUCTION
The most common requirement for water membrane system is a high-performance engineering thermoplastic with resistance to degradation, good gas permeability and selectivity values, low cost, and high critical pressure of plasticization. Furthermore, it should have an outstanding ability to withstand exposure to elevated temperatures in air and water for prolonged periods (i.e. phase inversion polyethersulfone membrane). However, the hydrophobic nature of these polymeric membrane makes them highly susceptible to fouling by water contaminants. It is well known that water membrane fouling is a major obstacle to the widespread use of this technology since it can cause severe flux decline and affect the quality of the water produced. Fouled membranes are needed to be cleaned by intense chemical cleaning or membrane replacement which generate the significant increase in the operating cost of water treatment.
Hence, improving the antifouling properties of membranes by modifying their surface characteristics has been an increasing interest in last few years (Kim, D.-S. et al., 2012; Diep, J. et al., 2016). One of interesting surface modification is applying nanoparticles to make hydrophilic membrane surface (Ren, J.M. et al., 2016; Lee, V.Y. et al., 2011). In order to do that, it is critical to understand the local hydrophilicity/hydrophobicity on the surface of membrane since contact angle measurement which is the most commonly used method is only showing the average of hydrophilicity which can be affected by roughness and surface structures, such as pores (Li, D. et al., 2018). Many different microscopic characterization techniques including SEM and TEM have been used to reveal the nanostructured star block copolymers structures which can be related with local hydrophilicity (Liu, J. et al., 2012; Fu, Q. et al., 2012). However, major drawbacks of these techniques in this field is that it is almost impossible to see the detail structure of individual star shaped polymers on the surface of membrane since their weak structure can be easily damaged by strong electron beam during imaging. In addition, there is no direct characterization method to see its thermal stability on membrane which is critical for further applications in water treatment.
Therefore, the main objectives of this study are to determine the detail structure of star polymers (SPs) using SEM, STEM, TEM and AFM, to develop an understanding of the local hydrophilicity/hydrophobicity of SPs by phase mode AFM imaging and to assess the thermal stability of SPs including bilayer coating on hydrophobic phase inversion (PI) membrane at high temperature by HT-TEM and HT-AFM.
2 EXPERIMENTAL 2.1 Materials
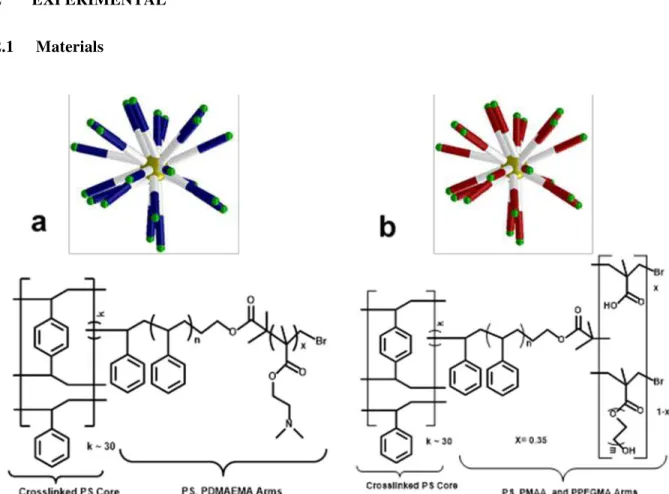
Figure 1. Scheme and examples of chemical formula of the star-shaped block copolymers with polystyrene (PS) core and arms of a) DMAEMA. SP1: 100 mol % DMAEMA and (b) PEGMA and
The SPs used in this study comprised of a hydrophobic polystyrene (PS) core and different types of hydrophilic arms including polyethylene glycol methacrylate (PEGMA), polydimethylaminoethyl methacrylate (PDMAEMA), and polymethacrylic acid (PMAA). The chemical structure of these SPs is shown in Figure 1.
2.2 Sample preparation for microscopic characterization
Two different concentrations (0.1 and 0.01%) of SPs in water were prepared and used for this study. For the EM studies, 0.01% of SPs solution were deposited on a carbon-coated 400-mesh copper TEM grid (Electron Microscopy Sciences), the excess solution was blotted after 10 s. The staining of samples for STEM/TEM was performed by depositing one droplet of a 2% uranyl acetate (UA) solution for 120 s. The grid was then blotted and dried in air.
For AFM measurement of SPs, clean silica substrate (1 × 1 cm2) was prepared and pretreated by
UV-Ozone cleaner (Novascan). Then, the samples surface were coated by dipping in 0.1% solution for 15 minutes, then rinsed by DI water. These samples were dried in the air for a day. The bilayer sample on the PI membrane was prepared by repeating the above coating process.
2.3 EM characterization: SEM, STEM, FIB, TEM and High-temperature TEM
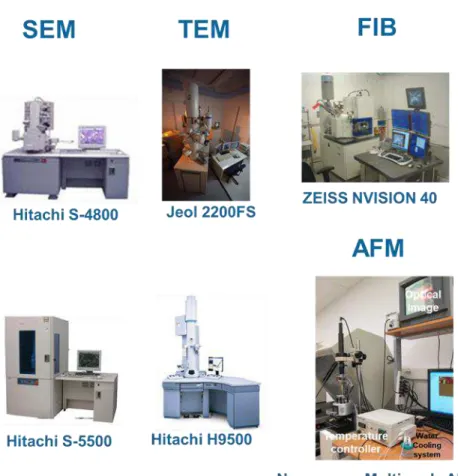
Many different microscopic techniques were used for this study, as shown in Figure 2. SEM images were obtained without negative staining, at an accelerating voltage of 5 kV and 10 µA and a working distance of 5-8 mm on high resolution Hitachi S-4800 cold field emission SEM. scanning transmission electron microscopy (STEM) images were obtained with UA staining, at 30 kV accelerating voltage and 30 µA emission current on a ultra high resolution Hitachi S–5500 cold field emission SEM. The cross-sectional view of SPs coated PI membrane was characterized on Zeiss Nvision40 FIB which is a dual-beam instrument combining a Schottky field emission SEM with a focused beam of gallium ions. To have a smooth milling plane of membrane and avoid the curtain effect, 200nm thick Au-Pd coating were applied on the surface of membrane. The final ion beam current of 80 pA was used for minimizing the ion beam damage on the cross-sectional surface of membrane. TEM investigation was carried out on JEOL 2200FS TEM – 200kV Schottky field emission instrument equipped with an in-column omega filter. Bright field TEM images are acquired using energy filtered zero loss beams (slit width 10ev). High-temperature TEM (HT-TEM) was performed on Hitachi H-9500 environmental TEM at 100kV acceleration voltage with 5°C/min elevation of temperature until 80°C.
2.4 AFM characterization: Phase mode AFM and High-temperature AFM
Sample surface was scanned using a Veeco Instruments MultiMode Nanoscope IV AFM equipped with an E scanner. In order to have an information about local hydrophilicity & hydrophobicity from sample surface in this investigation, high resolution, soft tapping mode AFM Probes (MikroMasch USA, Inc.) with low spring constants of 5.0 N/m and 1 nm radius were used. To obtain a clear phase mode image from SPs, low scan rate (0.3-0.5 Hz) and amplitude setpoint were chosen during measurement. High-temperature AFM (HT-AFM) imaging of SPs coated membrane at 80°C was performed using a Digital Instruments/Veeco Instruments MultiMode Nanoscope IV AFM, equipped with a J scanner, along with high-temperature attachment (Figure 2).
3 RESULTS AND DISCUSSIONS
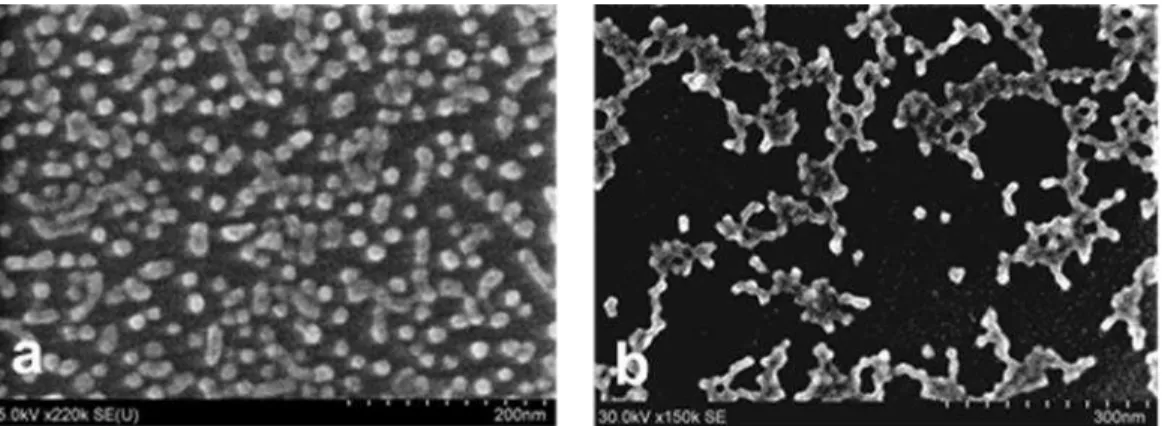
As shown in Figure 3, SEM image of SPs shows the round shape of particles with different distributions: SP1s are well dispersed and SP2s are a bit aggregated. However, it is hard to see their detail structures by SEM. Due to the nature of soft nanostructure which can be easily damaged by strong electron beam, samples have to be stained by heavy metals to preserve the structure and enhance the contrast for TEM imaging. As shown in Figure 4, STEM images were obtained as a prerequisite for TEM investigation. Bright filed STEM images show each SPs are well stained with UA solution and clearly shown with its hydrophilic arms (insets from each images).
Figure 3: SEM images of 0.01% SPs were obtained without UA staining, at 5 kV accelerating voltage, 10 µA and a working distance of 5 mm using Hitachi S-4800 SEM - a) SP1 and b) SP2.
Figure 4: Bright field STEM images of 0.01% SPs were obtained with UA staining, at 30 kV accelerating voltage, 30 µA using Hitachi S-5500 SEM - a) SP1 and b) SP2. Insets show the magnified image of individual SPs.
To acquire the detail structure/size information of the individual SPs, high resolution TEM (HR-TEM) images of stained SPs were obtained using Jeol 2200FS TEM which has in-column filter for enhancing contrast of soft nanostructures (Figure 5). Measured average sizes of SPs were 21±3nm and 16±2nm respectively. The difference in stainability between SPs may indicate the difference in surface characteristic (i.e. surface charge) which will affect the property of SPs coated membrane.
In order to check the thermal stability of the SPs which is the critical factor for high-temperature water filtration membrane system, UA stained SPs were imaged under HT-TEM with a temperature ramp of 5 °C/min up to 80 °C (Figure 6). No obvious change in the shape or size of the SPs were found at an elevated temperature up to 80 °C. This result will be confirmed with HT-AFM investigation which was performed on SPs coated PI membrane in the latter part of this paper.
Figure 5: HR-TEM images of 0.01% SPs were obtained with UA staining, at 200 kV using Jeol 2200FS using energy filtered zero loss beams (slit width 10ev) - a) SP1 (21±3nm) and b) SP2 (16±2nm). Insets show the details of individual SPs.
Figure 6: HT-TEM images of 0.01% SPs were obtained with UA staining using Hitachi H-9500 E-TEM - a) SP1 and b) SP2 at room temperature, c) SP1 and d) SP2 at 80C.
SPs coated PI membrane was characterized by FIB to find out the distributions of SPs through thickness since coating of SPs can block pores which can generate the deterioration of water flux in membrane system. As shown in Figure 7, it was observed that a couple of SPs were found till 3m thick from the surface in the PI membrane, however major populations of SPs were found on the surface of PI membrane without blocking pores which is confirmed by AFM investigation.
Figure 7: Cross-sectional images of PI membranes coated with SPs using ZEISS NVISION 40 FIB - a) FIB milling section of membrane and b) magnified surface area which shows the location of SPs
indicated by yellow arrows.
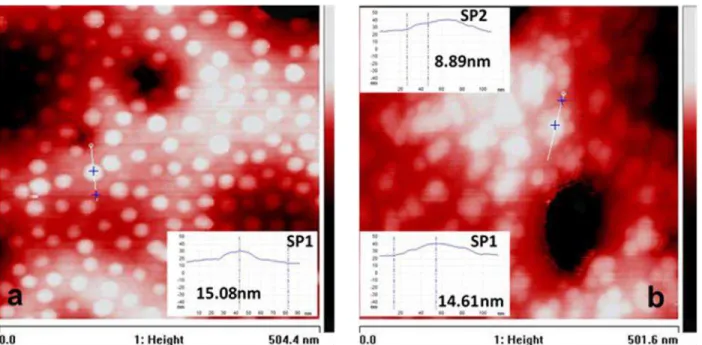
Figure 8: AFM images of 0.1% SPs on PI membrane using NanoScope IV MultiMode AFM - a) monolayer (SP1) and b) bilayer (SP2 on SP1).
Figure 9: AFM images of mono and bilayer SPs on silica and PI-PES membrane along with their under-water captive n-decane bubble contact angle measurements –a) height mode and b) phase mode AFM image of SP1(mono) on the silica surface, c) schematic diagram of the difference between height and phase mode, phase mode AFM image of d) mono layer and e) bilayer (insets show the details of SPs - red
Two different SPs (SP1 and SP2) coated PI membranes as a monolayer (SP1) and bilayer (SP2 on SP1) were characterized by AFM, as shown in Figure 8. Both monolayer and bilayer membrane show well dispersed coating without blocking existing. As shown in Figure 8b, it was found that the SP2 were preferentially coated with SP1 than PI membrane surface, and their heights (sizes) are 15±2nm and 9±2nm respectively on the surface of PI membrane: less values than TEM can be explained by compressibility of tapping mode AFM and interaction between SPs and membrane surface (Muir, T. et al., 1998).
The local hydrophilicity of the SPs coated membranes was analysed by AFM phase imaging technique (Figure 9) since knowing the degree of hydrophilicity on the membrane surface is critical for understanding anti-fouling property of SPs coated PI membrane. During tapping mode AFM, the phase shift is derived from the difference in phase angle between the freely oscillating cantilever in air and the cantilever oscillation. Therefore, the phase shift is zero when there is no interaction between the tip and the sample surface. In this study, the high-resolution (tip radius 1nm) hydrophilic silicon tip was adopted so that the interaction between the tip and the SPs coated PI membrane can reveal whether the local surface is hydrophilic or hydrophobic. As shown in Figure 9a and b, SPs on silica surface were scanned by high-resolution silicon tip and revealed their hydrophilic rich area (bright yellow color in phase mode image). Comparing height mode image with phase mode image which were acquired from the same scanned area, the height mode image only shows the near hydrophobic core area, however the phase mode image shows including hydrophilic arms, therefore its size is bigger in phase mode than height mode (Figure 9c). Based on these results, one can say that a hydrophilic surface interacts strongly with a hydrophilic tip, resulting in a large phase shift. A hydrophobic surface does not interact very strongly with a hydrophilic tip, resulting in a small phase shift. To make these findings clear, the root-mean-square (RMS) values of phase shift were calculated which can indicate the degree of the phase difference between the hydrophilic arms and the hydrophobic core in self-assembled SPs on PI membrane surface (Boussu, K.et al., 2005). As shown in Figure 9d and e, RMS values were calculated in the yellow dashed boxes only to minimize the surface roughness/structure factors (i.e. pores) of PI membrane. The difference between monolayer and bilayer in hydrophilicity/hydrophobicity was found: the bilayer shows more hydrophilicity than mono layer and it was confirmed by contact angle measurement (Figure 9f and g). We believe that the highest local hydrophilicity of bilayer coated membrane can be attributed to the high-density self-assembly of multiple hydrophilic carboxylic acid and PEG functional group containing SPs (SP2) surrounding an amine-containing SPs (SP1).
Figure 10: HT-AFM images of bilayer coated PI membrane using NanoScope IV MultiMode AFM with high-temperature attachment - a) at room temperature and b) at 80°C.
In order to assess the thermal stability of SP coated PI membrane, HT-AFM technique which can monitor the structural changes of SPs depending on temperature was performed. As shown in Figure 10, SPs coated PI membrane was stable at 80°C: no significant structural changes of bilayer SPs (SP2 on SP1), such as aggregation, swallowing and shrinking, was found which shows the good agreement with previous HT-TEM study (Figure 6).
4 CONCLUSIONS ANF FUTURE WORKS
Two different star polymers (SP1 and SP2) coated on PI membrane were successfully characterized by SEM, TEM, AFM, FIB, HT-TEM and HT-AFM: star polymers have a size that ranged 14 – 24 nm and were well coated on the surface of PI membrane. The local hydrophilicity/hydrophobicity were measured by phase mode AFM imaging which was confirmed by contact angle measurement. HT-AFM and HT-TEM studies revealed the thermal stability of star polymers on PI membrane: there is no obvious change in the shape or size of the SPs at 80°C.
In the near future, various types of star polymers which have different sizes of hydrophobic core and hydrophilic arms will be synthesized and characterized by various microscopic techniques including in-situ AFM and cryo-SEM/FIB.
5 ACKNOWLEDGEMENTS
The authors acknowledge funding from
the IBM Alberta Centre for Advanced Studies (CAS),
IBM Research-Almaden, Alberta Innovates (AI),
National Research Council CANADA, University of Alberta and Government of Alberta.REFERENCES
Boussu, K.et al. (2005) Roughness and hydrophobicity studies of nanofiltration membranes using different modes of AFM, J. Colloid Interface Sci. 286, 632–638.
Diep, J. et al. (2016) Layer-by-layer assembled core–shell star block copolymers for fouling resistant water purification membranes. Polymer 103, 468-477.
Fu, Q. et al. (2012) Synthesis of Novel Core Cross-Linked Star-based Polyrotaxane End-capped via "CuAAC" Click Chemistry. Macromol. Rapid Commun. 33, 2109−2114.
Kim, D.-S. et al. (2012) The increase of antifouling properties of ultrafiltration membrane coated by star-shaped polymers. J. Mater. Chem. 22, 8654-8661.
Lee, V.Y.et al. (2011) Star Polymer Nanoparticles: Nanogel Star Polymer Architectures: A Nanoparticle Platform for Modular Programmable Macromolecular Self‐Assembly, Intercellular Transport, and Dual‐ Mode Cargo Delivery. Adv. Mater. 23, 4509-4515.
Liu, J. et al. (2012) “Brush-First” Method for the Parallel Synthesis of Photocleavable, Nitroxide-Labeled Poly(ethylene glycol) Star Polymers. J. Am. Chem. Soc. 134, 16337−16344
Li, D. et al. (2018) Hydrophilicity and anti-fouling performance of polyethersulfone membrane modified by grafting block glycosyl copolymers via surface initiated electrochemically mediated atom transfer radical polymerization. New J. Chem. 42, 2692-2701.
Muir, T. et al. (1998) The morphology of duplex and quadruplex DNA on mica, J. Vac. Sci. Technol. A 16(3), 1172-1177.