Approaches for Identifying Consumer Preferences for the Design
of Technology Products: A Case Study of Residential Solar Panels
The MIT Faculty has made this article openly available.
Please share
how this access benefits you. Your story matters.
Citation
Chen, Heidi Q., Tomonori Honda, and Maria C. Yang. “Approaches
for Identifying Consumer Preferences for the Design of Technology
Products: A Case Study of Residential Solar Panels.” Journal of
Mechanical Design 135, no. 6 (May 9, 2013): 061007.
As Published
http://dx.doi.org/10.1115/1.4024232
Publisher
ASME International
Version
Author's final manuscript
Citable link
http://hdl.handle.net/1721.1/86159
Terms of Use
Creative Commons Attribution-Noncommercial-Share Alike
Approaches for Identifying Consumer
Preferences for the Design of Technology
Products: A Case Study of Residential Solar
Panels
Heidi Q. Chen Graduate Student Mechanical Engineering Massachusetts Institute of Technology
Cambridge, Massachusetts 02139 Email: heidiqc@mit.edu
Tomonori Honda Research Scientist Mechanical Engineering Massachusetts Institute of Technology
Cambridge, Massachusetts 02139 Email: tomonori@mit.edu
Maria C. Yang∗ Assistant Professor
Mechanical Engineering and Engineering Systems Massachusetts Institute of Technology
Cambridge, Massachusetts 02139 Email: mcyang@mit.edu
ABSTRACT
This paper investigates ways to obtain consumer preferences for technology products to help designers identify the key attributes that contribute to a product’s market success. A case study of residential photovoltaic panels is performed in the context of the California, USA market within the 2007-2011 time span. First, interviews are con-ducted with solar panel installers to gain a better understanding of the solar industry. Second, a revealed preference method is implemented using actual market data and technical specifications to extract preferences. The approach is explored with three machine learning methods: Artificial Neural Networks, Random Forest decision trees, and Gradient Boosted regression. Finally, a stated preference self-explicated survey is conducted, and the results using the two methods compared. Three common critical attributes are identified from a pool of 34 technical attributes: power warranty, panel efficiency, and time on market. From the survey, additional non-technical attributes are iden-tified: panel manufacturer’s reputation, name recognition, and aesthetics. The work shows that a combination of revealed and stated preference methods may be valuable for identifying both technical and non-technical attributes to guide design priorities.
Nomenclature
k Attribute number from 1-34 MSE Mean Squared Error
PTC PV-USA Test Conditions: Air temperature 20◦C, 10m above ground level, 1m/s wind speed, AM1.5 solar spectrum, 1000W/m2irradiance.
R Correlation coefficient
R2 Coefficient of determination
STC Standard Test Conditions: Cell temperature 25◦C, AM1.5 solar spectrum, 1000W/m2irradiance. σMS Standard deviation of market share
1 Introduction
Firms are constantly trying to find ways to appeal to the customer by determining their changing needs, wants, values and behavior and designing for them [1]. The identification of key product attributes that contribute to a product’s market success is crucial, especially in the conceptual design phase, where modifications can account for a large percentage of the overall manufacturing cost [2].
This is especially so for technology-push products such as residential solar panels that are still within the early part of the technology diffusion S-curve, where there is slow uptake of the technology and product features have not fully matured [3]. Only early adopters have warmed to the product, and there is potential for much feature and market expansion. Knowing what the customer wants at this stage is necessary for the product to bridge the chasm between the early adopters and the early majority, allowing the product to flourish in the market [4]. Much of the current academic engineering focus on solar panels has rightly been on the physical science and technology behind the application, improving the performance of the conversion of sunlight to electricity, assessing and increasing the reliability and durability of the system [5]. This is critical for spurring increases in the demand for large scale facilities installations. At the same time, it is important to convince consumers to adopt a PV system at the residential level where decision makers are spread out and individual households have different requirements.
There is limited academic literature on understanding consumer needs in order to increase adoption. Existing research is centered on identifying characteristics of adopters [6], discovering their motives for acquiring a PV system [7], determining barriers to adoption [8], and understanding the link between attractive factors of PV systems [9]. However, these studies are limited to stated preference studies, and do not include real market data or technical specifications.
We present a case study of residential solar photovoltaic panels in the California market to illustrate our approach to extracting consumer preferences by determining critical attributes using the established revealed preference framework [10–13]. Advances in computational intelligence and machine learning are used to support the analysis. This is compared with the results from a self-explicated stated preference survey method, and key attributes that contribute to the market success of the residential PV panels are identified.
The main research questions are:
1. Can revealed consumer preferences be obtained from market data and engineering specifications using machine learning methods?
2. Is there agreement among the machine learning methods that suggest the validity of the data and methods? 3. How does the revealed preference approach compare with a stated preference self-explicated survey method?
This paper begins with a literature review in the area of stated and revealed preferences, followed by interviews with residential solar PV installers in the Boston, MA area to gain a first hand understanding of the solar industry. Subsequently, a combination of engineering specification data obtained from solar panel data sheets and real market data from the California Solar Initiative database is used to extract revealed preferences using machine learning methods. A stated preference survey conducted with Californian solar installers is presented, and a comparison of results from stated and revealed preference methods made. Finally, we report a summary and conclusion of our findings.
2 Related Work on Stated and Revealed Preferences
Much work has been done within the academic community to determine consumer preferences using choice model-ing. These can be broken down into two main categories: stated preference methods which measure consumers’ explicit preferences over hypothetical alternatives, and revealed preference methods which extract preferences from actual market data [14].
Over the years, stated preference methods have gained ground in the marketing community due to their flexibility and ease of implementation. Popular survey based stated preference methods include self-explicated methods like Kelly’s reper-tory grid [15, 16], Self-Explicated Method (SEM) [17] and the Single Unit Marketing Model [18] among others, requesting consumers to rank or rate various product attributes. In the area of design, Tseng, et al [19] take a novel approach by using surveys to determine preferences for car styling, then use this data to train machine methods to generate new car styles. Another group of stated preference methods where relative preferences are obtained include MaxDiff [20], and conjoint analysis [21, 22], which ask consumers to choose between different products which have varying attributes. Multiple hybrid models that incorporate both self-explicated and relative preferences also exist. Non-survey based methods include focus groups and field observations, which require considerable time, expertise and resources to carry out, and may be hard to quantify.
The potential problem with these stated preference methods is that consumers often exhibit preference inconsistencies, constructing their preferences along the way, or changing their preferences due to some shift in the phrasing of the questions [23]. Research on the accuracy of consumers’ predictions show a disconnect between preferences obtained during preference elicitation and actual decision making [24]. Stated preference methods have also come under considerable criticism because
of the belief that consumers react differently under hypothetical experiments compared to when they are faced with the real market situation [25, 26].
In comparison, revealed preference methods could be a better reflection of purchase behavior than stated preference methods as they take into account external factors like third party influences that might affect the consumer’s decision. This has been expressed in the economics and decision making literature to be especially important if the consumer’s choice is based heavily on the recommendation of a more experienced expert, as a result of complexity inherent in the product, or limited personal experience [27]. However, revealed preference methods have been difficult to implement due to several factors. These include the high cost of collecting large sets of relevant data, limited technological knowledge, problems with multicollinearity, and the inability to test new variables [28]. As technology has improved and computer processing has become increasingly fast, efficient and cost effective, it has become feasible to reevaluate these methods. Furthermore, more companies are keeping digital records of product sales, making data collection less of a burden than before. Machine learn-ing methods that are capable of deallearn-ing with multicollinearity involvlearn-ing regression and classification can now be applied on large sets of marketing data, overcoming the issue with multicollinearity that several academics have identified, and allowing for the identification of key attributes in an efficient way. These state-of-the-art machine learning methods utilize embedded methods for feature selection, and analyze a model to determine the most critical variables [29]. Because intercoupled vari-ables that include multicollinearity reduce the criticality of the varivari-ables, multicollinear varivari-ables are automatically classified as lower importance in these methods. Finally, the inability to test new variables still poses a significant challenge, as the new variables may be outside the data range, and involve extrapolation outside the range used to create the model. This can be dealt with by a careful use of stated preference methods in combination with the revealed preference framework.
Revealed preference methods have been used widely in economics research, but little has been done in the area of design applications. Similar work that has been conducted in the joint field of product design and machine learning include: Agard and Kunsiak’s work on data mining for the design of product families [30], where algorithms were used for customer segregation; Ferguson et al’s work on creating a decision support system for providing information from later to earlier stages in the design process [31]. A good overview of other applications of computational intelligence in product design engineering can be found in Kusiak’s 2007 review [32].
This paper sets itself apart in the design community by forming a direct link between consumer purchasing preferences and engineering specifications. Both revealed preference and stated preference methods are used and compared, combining publicly available market data and engineering specifications from data sheets in order to determine a set of key attributes that can be prioritized to boost a product’s competitiveness. The machine learning algorithms employed in the revealed preference method are also compared to validate their effectiveness.
3 Interviews with Solar Panel Installers
In-depth interviews were conducted with solar PV installers in Massachusetts at the start of the research cycle to establish an understanding of the PV industry and to determine the feasibility of looking at design methods for solar PV panels in the early stage of the design phase. Interview questions were drafted and PV installers in the Boston, Massachusetts area were sourced, and contacted by email. Installers were chosen over homeowners and manufacturers because they deal with both parties, and are present from the point of the homeowner decision to try renewable energy to the completed installation. Out of the 22 installers contacted, 2 agreed to be interviewed in person. Each interview took approximately 1 hour.
By interviewing PV installers, we learned that decision making regarding PV panel choice is made predominantly by PV installers, not homeowners. In most cases, homeowners simply take the recommendation of the installers, as the decision is a complex one made by weighing many attributes.
4 Revealed Preference Analysis from Technical Attributes
Understanding that the purchase decision is made by weighing various attributes of the PV panels, we move on to determine which technical attributes are important in this decision. In our discussions, we make a distinction between technical and non-technical attributes. We define technical attributes as quantitative attributes that affect engineering design, like dimensions, weight, and efficiency. They are listed in engineering data sheets, and can be easily measured. Non-technical attributes are qualitative attributes that are difficult to measure because they are affected by subjective judgments. These non-technical attributes include aesthetics, company relationship, reputation, and name recognition, amongst others. Because technical attributes can be measured and designed for, companies are particularly interested in them, as improving these attributes may result in better performance on the market.
In this section we perform a revealed preference analysis to extract preferences from a combination of market data and engineering specifications taken from the PV industry in California. The approach is explored using three machine learning methods: Artificial Neural Networks, Random Forest decision trees, and Gradient Boosted regression.
We make use of market share as a reflection of market success, even though the definition of market success varies widely in literature [33]. Market share was chosen as it is publicly available, unlike customer satisfaction levels, revenue or
profits which are usually kept within the company and are difficult or costly to measure. It has also been discovered to be the most useful customer-based measure for the success of line extensions of existing products [34].
4.1 Dataset and Data Filtering
The working dataset published in September 7, 2011 from the California Solar Statistics California Solar Initiative in-centive application database [35] served as the paper’s source of market data. The data is considered representative of the USA solar consumption, as California is the current leading producer of solar power in the United States, accounting for 44% of the total grid-connected PV cumulative installed capacity through quarter 3 of 2011 [36]. The working database includes all incentive applications from January 2007 to November 2011 made in California, hence includes both success-ful subsidized installations and unsuccesssuccess-ful incentive applications made by a variety of consumers. It was assumed that unsuccessful incentive applications did not result in a PV installation.
The data was filtered to include only residential installations with a completed installation status, excluding applications that are from the commercial, government or non-profit sector, as well as those that were canceled or pending (41.6% filtered out). This was done in order to concentrate on the small scale PV systems that were actually installed during the 2007-2011 time-frame. Installations with more than 1 PV module type were filtered out (0.8%), as the effective cost calculations cannot be done. Finally, new panels introduced during the past year were removed (12.9%), as they are still too new and the market has not had adequate time to respond. After filtering, the data set was reduced from 73,514 to 32,896 installed systems with a total of 586 panel types.
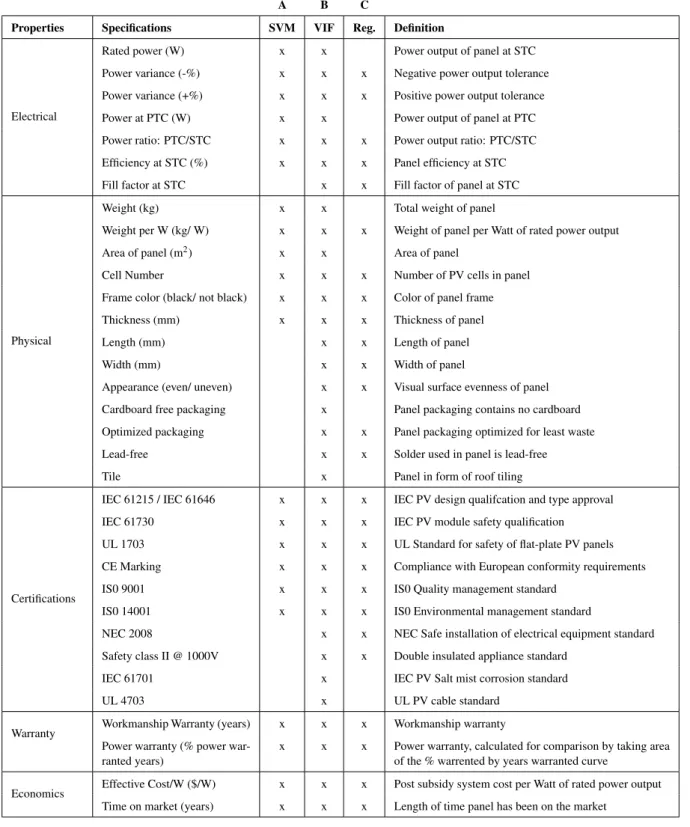
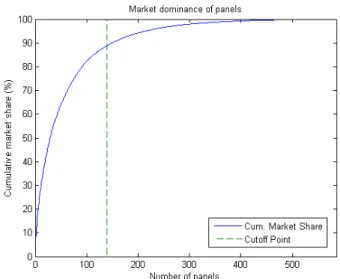
From this dataset, the panels were ranked in order of market share (quantity installed divided by total sold). As a small group of panels owns most of the market share, as shown in Fig. 1, a classifier called Support Vector Machine (SVM) [37] was chosen to identify the cut-off point for the study. SVM was selected to isolate the top performing panels in the market above the cut-off, as it is a well established method of binary linear classification. Two hundred (200) panels picked at random were sourced for their technical specifications from manufacturer data sheets to form a specifications dataset. This dataset included common markers for technical performance, including attributes like efficiency, rated power, and power warranty. These 22 markers were chosen as initial distinguishing attributes of the technical performance of each panel, as shown in Tab. 1, Col. A.
SVM took the set of PV panel data and categorized the panels into 2 groups by multiple attributes, including the 22 attributes stated in Tab. 1, Col. A and the panel’s market share. A linear kernel was applied as it best suited the data spread. A noticeable drop-off in SVM classification performance was observed at the top 140 panels, so that was chosen to be the cutoff point. This subset was determined to control 88.9% of the California market.
In the same way as the previous step, the 140 panels with the highest market share were identified by their model number and sourced for their technical specifications. From a combination of panel datasheets and marketing material, an expanded list of 34 attributes was identified (Tab. 1, Col. B). This expanded list adds distinguishing characteristics of the panels, like appearance, packaging and environmental characteristics to the initial 22 attribute list, and is a more comprehensive collection of technical attributes.
4.1.1 Variance Inflation Factor Calculation to Reduce Multicollinearity
As expected, the expanded list of attributes exhibited a high degree of multicollinearity, meaning that the attributes were highly correlated. This is a problem as it decreases the accuracy of the model. To reduce parameter correlation between the attributes and improve the multiple regression model, the redundant attributes were identified using a Variance Inflation Fac-tor (VIF) calculation [38], which quantifies the severity of multicollinearity in an ordinary least squares regression analysis. There are many other techniques such as Partial Least Square (PLS) Regression [39] combined with the Variable Importance in the Projection (VIP), Least Angle Regression (LARS), Least Absolute Shrinkage [40], Selection Operator (LASSO) [41], and Ridge Regression [42] that reduce the effect of multicollinearity [43]. However, because feature selection techniques that utilize a machine learning algorithm also reduce the impact of multicollinearity, the aim of this step is to reduce only the obvious multicollinearity in order to limit the computational burden on machine learning methods. This VIF method was chosen because of the ease of comparing multicollinearity between attributes. The VIF for each attribute was calculated using Eqn. 1 by holding it as the dependent variable and performing regression with the rest of the attributes as independent variables. V IFk= 1 1− R2k, R 2 k= 1− MSEk σ2 k (1)
where k is the attribute number from 1-34, MSE is the mean squared error, R2is the coefficient of determination, andσ is the standard deviation. Attributes with high VIF values of more than 20 were removed from the specifications list [44], as shown in Tab. 1, Col. C. A total of 8 attributes were removed, leading to a reduced list of 26 attributes.
4.2 Methodology
4.2.1 Critical Attribute Determination
An overview of the methodology is presented in Fig. 2. A set of 3 computational machine learning regression methods were used to determine the important technical attributes that most influence market share. These methods were chosen over others as they are known in the machine learning community to be robust (i.e. insensitive to parameter setting), and are considered state-of-the-art in industry [45]. Other methods like SVM regression and Elastic Nets could also have been used to achieve the same purpose. The 3 methods used are:
1. Artificial neural network (ANN) regression
A non-linear statistical data modeling that models complex relationships between inputs and outputs in a network of synapses and neurons. [46].
2. Random Forest regression
An ensemble of unpruned regression trees created by bootstrap samples of the data with random feature selection in tree induction. It makes predictions by aggregating the predictions of the ensemble [47].
3. Gradient Boosting Machine (GBM)
An algorithm that generalizes the decision tree prediction model by allowing optimization of an arbitrary differentiable loss function [48, 49].
The common set of important attributes found using these models is then taken to be the set of critical technical at-tributes. The rationale behind taking the intersection of the important attributes is that the different approaches have different assumptions, weaknesses and strengths. Random Forest and GBM are decision tree based algorithms, which are robust to outliers in data points and deal well with irrelevant predictor attributes. ANN does not perform as well on the above char-acteristics, but is better at capturing non-linear and complex combinations of predictor attributes. For example, attributes A and B may not be important when taken alone, but may be significant when a combination of both is present. Random Forest and GBM may not consider A and B to be important attributes, but ANN will. Additionally, ANN and GBM may have some issues with over fitting, but Random Forests is more robust and will not over fit easily. All the algorithms can naturally handle both continuous and categorical predictor attributes, which is essential because the attribute list contains both binary and continuous data. They are also able to deal with incomplete data sets with some missing entries.
4.2.2 Artificial Neural Network Regression
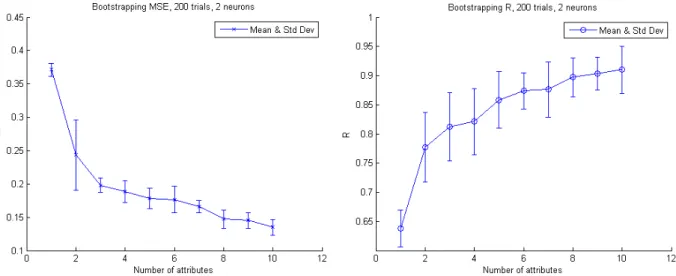
A supervised feed forward Artificial Neural Network (ANN) fit was done in the MATLAB environment [50]. In order to determine the neural network architecture with an optimal number of neurons which gives the best fit without over fitting, the variance in the performance of fit with increasing neurons was tested. The number of neurons used for fitting was increased systematically from 1 to 8, using the top 10 attributes that mapped the best to market share. Each test was done with 300 trials to ensure that the global optimum was obtained, as MATLAB’s neural network toolbox uses random initialization, which could affect the final result.
For each neuron number, the corresponding mean squared error (MSE) and correlation coefficient R fits were obtained. The optimal number of 2 neurons was selected, as it has a comparable MSE and R value to other neural networks with a higher number of neurons.
Using this optimal number of neurons for fitting, a new neural network model that maps each of the attributes to market share was built. Each optimization was run over 300 trials to ensure accurate optimization on the global minimum. MATLAB’s parallel processing toolbox was used to run 3 processes simultaneously to speed up the analysis. The best model with the lowest MSE and highest corresponding R was picked to be the first element for the set of important attributes.
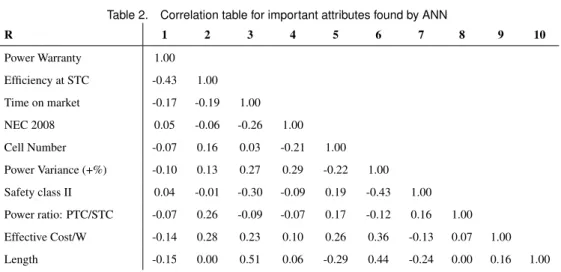
The second important attribute was chosen by creating new neural network models that map each attribute plus the first important attribute to market share. This was repeated until adding a new attribute did not reduce the MSE, resulting in a total of 6 important attributes. Further testing was conducted to ensure that the model is robust using correlation tables and bootstrapping methods. The corresponding bootstrapping values of MSE and R are displayed in Fig. 3. The correlation table of the important attributes is shown in Tab. 2.
4.2.3 Random Forest Regression
The Random Forest regression was performed using the randomForest statistical package created by Liaw and Wiener for the R Project environment based on the original Fortran code by Breiman and Cutler [51]. As the Random Forest algorithm is robust to over fitting, very little tuning was required. The built in variable importance permutation calculation was used to identify critical attributes. 10,000 trees were grown and 3 variables were randomly sampled as candidates at each split. Many trees were necessary to obtain a stable MSE and stable estimates of variable importance, as each input row needed to be predicted many times. The choice of 3 variables sampled at each split was decided by trying alternatives from 2-16 and choosing the best result with the lowest MSE.
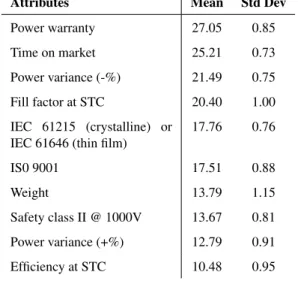
One hundred (100) regressions were done and an average of the importance values was taken, shown in Tab. 3. It was observed that although the variable importance measures varied slightly from run to run, the importance rankings were stable. Due to the nature of the method, cross validation was unnecessary as it generates an internal unbiased estimate of the generalization error as the forest building progresses. The importance threshold was chosen to be the absolute of the lowest importance value, resulting in a total of 10 important attributes.
4.2.4 Gradient Boosting Machine
The Gradient Boosting Machine (GBM) was similarly performed in the R statistical environment using the gbm package written by Ridgeway based on extensions to Friedman’s gradient boosting machine [52]. The learning rate, shrinkage, was set to 0.001, for the slowest rate but the highest accuracy. Other variables affecting the optimization, the maximum depth of variable interactions interaction.depth, the minimum number of observations in the trees’ terminal nodes n.minobsinnode and the fraction of the training set observations randomly selected to propose the next tree in the expansion bag.fraction, were also varied systematically to obtain the optimum result with the lowest fitted MSE.
At each run, 4000 trees were grown with 10 fold cross validation. The number of trees grown was chosen to be high enough to be sure that the optimal number of trees lies within the tested range. After each run, the function gbm.perf was used, which estimates the optimal number of trees using the data from the cross validation performed. The result at this number of trees is extracted and used.
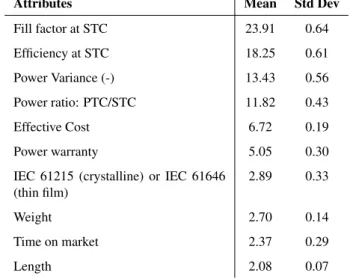
The relative influence was then calculated by permuting one predictor variable at a time and computing the associated reduction in predictive performance. The computed relative influence was normalized to sum to 100. The mean of these relative influences over 100 regressions was then taken, shown in Tab. 4. The importance threshold was chosen to be a relative influence of 2, after which the relative influence values for the rest of the attributes holds steady around 1. This resulted in a total of 10 important attributes.
4.3 Results: Critical Attributes
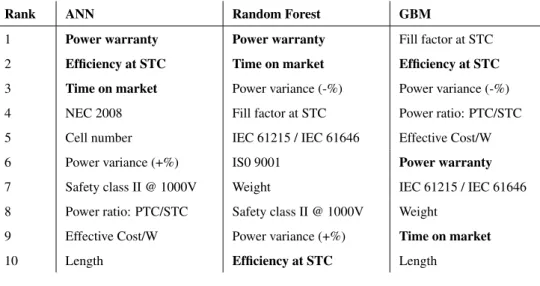
The summary of important attributes found from each method is shown in Tab. 5. The critical attributes are taken to be the important attributes that are common to all 3 methods, and form the feature set of concern. The rank ordering of the feature set is not considered to be important, as variations in the machine learning methods will cause differences in the rank ordering of the attributes.
The critical attributes found across all 3 methods are: 1. Power warranty
Measure of power output performance guaranteed by the manufacturer over a period of time 2. Efficiency at Standard Testing Conditions (STC)
Measure of performance of a panel 3. Time on Market (years)
Length of time panel has been on the market, measure of market maturity of product
These three attributes are important because they appear independently, regardless of the method used to determine them, and further cannot be replaced by other attributes. Other attributes are still important, but can be replaced by alternative attributes depending on the modeling technique used.
At first glance, the critical attributes found are reasonable. Power warranty is linked to consumer confidence, as well as the reliability of the solar panel. Efficiency is a reflection of the performance of the technology, in this case the panel’s ability to convert sunlight into electricity. Time on market is a measure of market maturity and durability of the panel.
It is important to note that the relationships between the critical attributes and market share derived from the machine learning algorithms do not imply causation. For example, the power warranty might not be the direct reason why customers prefer a certain panel over another, it might instead be a reflection of increased consumer confidence in the manufacturer’s quality that results in increased market share. On the other hand, if there is no relationship, the attribute is not an important factor in the purchase decision.
Furthermore, the presence of all 3 critical attributes found does not guarantee market success for the product. The panel might have a good power warranty, high efficiency, and a long market lifetime, and still perform poorly on the market. Other non-technical factors like service quality, country-of-origin, and manufacturer reputation may play important roles in the purchase decision that are not reflected in this part of the study. They will be taken into account in the next section, and in future work. What the analysis does show is that the panels need to have competitive levels of these critical attributes in order to have a chance at succeeding in the market. Hence, the list of critical attributes can be seen as ”must-have” attributes that designers should not neglect in the product development phase.
It is of value to note the factors that do not show up as important attributes in any of the methods. Interestingly, reduced waste in packaging, lead-free solder and the ISO 14001 environmental management standard fail to appear as important. The possibility that a consumer might not be aware of these factors is low, because manufacturers heavily promote them
as differentiating features, and they are displayed in large font at prominent places on the panel datasheets and advertising material. Because these are the only 3 factors in our analysis that reflect additional design thought on the eco-friendliness of the product, it can be inferred that consumers and installers do not consider the environmental impact of non-core aspects of solar panels to be as important when making their purchase decision. This is the opposite result of what would be expected from using a stated preference method. This is a common problem in stated preference methods, with consumers responding differently in hypothetical situations than in actual market conditions. Homeowners who purchase PV systems frequently think of themselves as more environmentally conscious than the average population. However, previous research findings support our finding, showing that inconsistencies exist within ”green” consumption areas, where environmentally conscious consumers will not necessarily buy more ”green” energy products [53].
Effective cost per Watt does not appear in the list of critical attributes, although cost is frequently considered by many to highly influence the purchase decision. This result is a limitation of our study, as due to constraints in collecting data, we used the total cost of the PV system, which includes not only the panels, but also the inverter, labor, and installation costs, minus the state subsidy that was applied. This effective cost might not have been a factor of consideration when choosing between different panels. For a more accurate reflection of how cost influences this decision process, the panel price per Watt should have been used, but this data was unavailable in the California Solar Statistics database, and thus was not considered in this study.
4.4 Comparison of Methods
Some agreement between the various machine learning algorithms can be seen in Tab. 5. Only 3 attributes are common, 9 attributes occur twice, and 3 attributes only occur once. The different predictions are due to the noise in the data, which is an inherent problem when dealing with real data. The internal structure of the methods also differ, meaning the methods perform regression in differing ways. Although Random Forest and GBM are both decision tree based methods, because the learning approach differs, the important attributes found could be inconsistent. ANN has a completely distinct internal structure from the decision tree based methods, causing the important attributes found to be different. The combination of noisy real data and differing internal structures of the methods results in limited agreement.
A comparison of the accuracy of the models in predicting market share using the important attributes is shown in the R2
goodness-of-fit values reflected in Tab. 6, where R2is calculated by Eq. 2.
R2= 1−MSE σ2
MS
(2)
where MSE is the mean squared error, andσMSis the standard deviation of market share.
Table 6 indicates that all the models perform relatively well, with GBM being the most accurate. Ideally, Random Forest and GBM should have similar performance, because they are both decision tree based algorithms. The difference lies in how they optimize decision trees using ensemble approaches. Random Forest is usually more robust to internal parameter choice and performs well for wider varieties of parameters. Meanwhile, GBM tends to do better than Random Forest when the internal parameters are optimized carefully, as in this case. This highlights the need to carefully tune and test the parameters of machine learning methods before using the results.
With regard to computation time, GBM and Random Forest took a similar amount of time to run. ANN took a much longer time to train properly, although this might have been partly due to the difference in platform, with MATLAB running slower than R.
5 Stated Preference Analysis from PV Installer Survey
In the previous section, we showed that consumer preferences can be extracted from a combination of market data and engineering specifications using machine learning methods we attempted. However, the revealed preference method has the limitation that only the set of attributes that are present in the data can be tested. There is a possibility that there may be other critical attributes that are not present within this dataset which are an important part of the homeowner purchasing decision process. In this section, we perform a stated preference analysis using a self-explicated survey method to serve as a comparison with of our previous revealed preference work, as well as to explore the non-technical attributes of importance in the Californean residential PV industry.
Surveys were sent out to PV panel installers instead of homeowners as installers are likely to have a better, more consolidated knowledge of their customer base. The geographical area was limited to California, to match the market data used in the revealed preference analysis.
5.1 Methodology
A range of open ended, ranking and rating survey questions were drafted. Special attention was paid to organization, randomization of response alternatives and word choice of questions to reduce the effects of priming and social desirability bias. Priming occurs when respondents are exposed to a stimulus which causes them to give increased weight in subsequent judgment tasks [54], while social desirability bias causes respondents to answer questions based on an accepted social norm, rather than truly expressing their own opinions [55]. Both result in poor accuracy of survey results, thus the survey was carefully crafted to minimize these effects.
Internet-based surveys using SurveyMonkey were chosen over telephone and paper surveys because it was faster and less expensive to distribute the surveys online to a relatively large population. Personalized survey invites were sent to the intended respondents to encourage higher participation rates [56]. No personal identifying data was collected, and each respondent was ensured the confidentiality of their responses. To reduce survey fatigue and more respondents, the survey was kept short, at about 15 minutes in length.
Two pilot surveys were sent out to researchers and PV installers. After slight modifications to the wording of certain questions, instructions, and the email invite, the survey was sent out by email to 2094 listed PV system installers within the state of California. Respondents were entered into a sweepstakes for a $100 Amazon.com gift card upon completion of the survey. The survey was carried out over a period of 3 weeks, from January 27 to February 18, 2012, with 2 reminder emails spaced apart by a week each. A total of 138 responses were received, for a response rate of 6.6%. In total, the time taken from start of survey creation to analysis was about 3 months.
5.2 Survey Respondent Demographics
From the demographic data, the average profile of the survey respondents is a male (89.5%) in his forties or fifties (56.5%), with 1-10 years of experience in the solar industry (73.9%). He deals mostly with residential PV installation projects (84.3%), and has experience dealing with the residential client in multiple areas (100%). This ranged from the first contact with the residential client, including marketing and initial site evaluation, all the way through the installation process to monitoring and maintenance.
5.3 Findings and Discussion
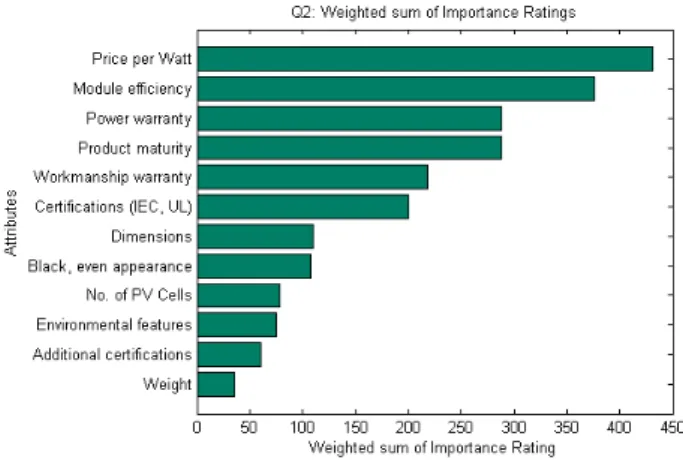
5.3.1 Importance Rankings of Technical Attributes
Figure 4 shows the importance ranking of the technical attributes from the survey. Respondents were asked to pick 6 of the most important technical factors of a PV panel model and rank them in order of importance. The list corresponded to factors in the revealed preference analysis. The importance of the attributes can be obtained by calculating the weighted sum, as shown in Eqn. 3.
A =
∑
(wi∗ ci), f ori = 1, 2, ...6 (3) where A is the weighted sum, w is the ranking weight, c is the count, and i is the rank.Price per Watt was the attribute with the highest ranking, followed by PV panel efficiency, power warranty and product maturity. Weight was the attribute with the lowest relative importance.
This finding is consistent with the revealed preference analysis conducted, where the 3 critical attributes found to most influence market share were PV panel efficiency, power warranty and time on the market. Panel price was not included in the analysis as that data was not available.
The consistency in results serves as a validation for our previous analysis. However, it points to the possibility of obtaining misleading results when important data is not included in the analysis. As panel price data was not available, it did not come up as a critical attribute, even though it is the most important attribute that installers consider when making a PV panel recommendation to a homeowner. As data collection becomes increasingly automated and comprehensive, this problem should diminish over time. However, researchers should still exercise caution while relying solely on revealed preferences.
5.3.2 Relative Importance of Technical and Non-Technical Attributes
In the survey, two types of questions regarding the relative importance of technical and non-technical attributes were asked survey respondents: an open ended, and a rating question.
Open ended List the 5 most important things you consider when choosing between PV panel models to recommend to a homeowner. (Fig. 5)
The open ended question was asked at the very start of the survey to minimize priming effects caused by the options provided in the rating question. Cost far outweighed the rest of the factors by a large margin, with 77.5% of respondents
mentioning ”cost” or ”price” as 1 of the 5 most important factors of consideration. Aesthetics was mentioned by 40.6% of respondents, followed closely by warranty, efficiency, country of origin and quality.
None of the installers considered any environmentally friendly features, like optimized packaging, lead-free solder, or a recycling program to be one of the top 5 important features. This is in line with the results found in the revealed preference analysis in Section 4.3.
Only 2 installers mentioned PV panel certifications, like IEC 61215/ IEC 61646 and UL 1703, which are standards for PV design qualification, type approval and safety. This might be because all panels that can be sold within California must by law have these certifications, and they are no longer a distinguishing factor in the opinion of the Californian PV installers. Comparing the results of this question to the importance rankings of technical attributes shown in Fig. 4, there seems to be some corroboration. There was no explicit mention of optional certifications (e.g. IEC 61701, ISO 9001), or the number of cells on a PV panel. These match up with the technical attributes with low importance rankings.
However, the weight of the panel was an attribute that 5.0% of installers brought up as one of the 5 most important attributes, but was ranked as the least important technical attribute. Hence, it appears to be unimportant to the majority of installers, but something that a select few care about a lot. This is an example of preference heterogeneity, which is the extent to which individual preferences vary across consumers [57]. The reason for this discrepancy might be because the installers have to manually carry the panels up on the roof during the installation, which can be a difficult procedure for some if the panels are heavy. For these installers, the weight of the panel might matter a lot, but for other more able bodied installers, or installers who do not personally carry out the installation, the weight of the panel might not be a big factor of consideration.
Rating How important are the following overall factors when recommending a PV panel to a homeowner? Please rate on a 5 part scale from very unimportant to very important. (Fig. 6)
In the rating question, reliability was ranked the highest, above price per Watt and the panel manufacturer’s reputation. Once again, weight of the panel was rated as the least important.
Comparing the results between the two question types, several differences surface. Reliability of the panel was the most important factor in the rating question, but was 12th in the open ended question, mentioned by only 11.6% of the respondents as one of the top 5 factors. Panel module efficiency was 10th and 2nd in the ratings and open ended questions respectively, and Aesthetics was 16th and 6th. The discrepancy between the ranking of attribute importance from the two questions points to internal inconsistencies associated with stated preference methods. This preference inconsistency is present when different phrasings of a question are shown to achieve different results, making it difficult to determine the actual preference of the respondent.
A consistent finding from the two questions is the relative importance of certain non-technical attributes compared to the technical attributes. The panel manufacturer’s reputation, country of origin, and aesthetics seem to be important attributes that play into the installers’ decision to recommend a panel type to a homeowner.
5.3.3 Aesthetic Preferences
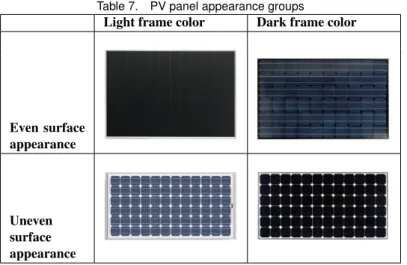
The panels were grouped into 4 different categories based on their frame color and surface appearance, as shown in Tab. 7. This categorization was based on data from the top 140 panels studied in the previous section. For each category, 3 example panels were selected. The survey was set up so that each respondent was randomly given a set of panels, one from each category. Hence, each example panel was seen by approximately 33.3% of the survey respondents. The panels were presented without their categories stated, and were known to respondents simply as ”Panel A”, ”Panel B”, ”Panel C” and ”Panel D”.
Respondents were first asked to rank the panels in order of attractiveness, then in order of visual compatibility on a roof. The results can be seen in Fig. 7.
It appears that installers prefer panels with an even surface appearance over panels with an uneven surface appearance. There was also a slight preference for dark colored frames over light colored frames. A good correlation between the level of attractiveness and visual compatibility with roofs means that installers associate a panel that blends in well with the roof as being more attractive.
This result suggests that using a black back sheet over a white one is preferable, and will increase the attractiveness of the panel substantially. It is in line with panel manufacturers’ move toward sleeker, all black panels with a smooth appearance and black frame for residential installations, despite the slight decrease in panel efficiency.
The similarity of preferences across all 3 sample panels from each category suggests that the aesthetic non-technical attribute is comprised of a combination of two technical attributes: frame color and surface appearance. This brings to attention that even though people consider aesthetics to be a subjective, non-quantifiable measure of attractiveness, in this case it can be broken down into technical attributes that can be quantifiable in the development process. Designers and developers can then tweak these attributes in order to achieve an improved aesthetic appeal.
5.3.4 Reputation and Service Quality
In the next section, survey respondents were asked to rate 22 PV panel manufacturers corresponding to the top 140 panels found in the previous section by reputation and service quality. They were given 4 options: Excellent, good, poor and no opinion. The results are displayed in Figures 8, 9, and 10 .
An interesting observation is that higher name recognition does not always correspond to a better reputation. Two of the top ten most recognized manufacturer names were rated by installers to have a below average reputation. However, reputation and service quality appear to be closely related, as manufacturers with a better service quality rating also had a better rated reputation.
6 Discussion
The research questions we set out in the introduction can be answered as follows:
1. Can revealed consumer preferences be obtained from market data and engineering specifications using machine learning
methods?
We showed that sets of consumer preferences can be revealed by machine learning analysis of market data and engi-neering specifications. We obtained a group of three critical attributes that most influenced market share: power warranty, PV panel efficiency, and the time the panel has spent on the market.
This result was compared with data from a stated preference self-explicated survey method, and the findings were validated. However, due to the unavailability of pricing data for the PV panels over the time period, price of the panel per Watt was not included in the revealed preference analysis, and did not show up as a critical attribute. This is a problem of the revealed preference analysis, as the result is only as good as the data that is available. Without a comprehensive collection of data, the results may be misleading. We foresee that this problem will diminish over time, as increasing use of digital records mean that data availability is on the rise.
2. Is there agreement among the machine learning methods that suggest the validity of the data and methods?
Yes, there seems to be some agreement among the machine learning methods used. Out of the 26 attributes tested, 12 attributes were ranked in the top 10 most important attributes by 2 out of 3 machine learning methods, with 3 attributes occurring thrice and 9 attributes occurring twice. This shows a good consistency between the results from the machine learning methods.
However, the rank order of the important attributes are not the same across the 3 methods. We think this is due to the way the different methods handle the data optimization when there is a significant amount of the noise in the data. This noise is inevitable when dealing with real data, and poses a challenge to the researcher. This makes it difficult to determine which rank order is necessarily correct.
3. How does the revealed preference approach compare with a stated preference self-explicated survey method?
The revealed preference method has several advantages over stated preference methods. First, revealed preference methods are not affected by preference construction or reversal, caused when people construct their preference only when asked, instead of retrieving their preferences from a pool of preexisting preferences. This means that people might report one thing, but may not necessarily act in the same way when faced with a real situation. This is not a problem for revealed preferences as consumers have already made their decision.
If data is available, the revealed preference method is relatively quick to perform, can use both marketing and engineering data, and does not require engineering specifications to be translated into a form that the consumer can understand. This means that more engineering specifications can be tested, and directly applied to engineering design in a more accurate and efficient manner.
However, there are several areas that the designer or researcher needs to take caution in. The result of revealed preference analysis is only as good as the data that is used in creating the model. If the input data is missing some important attributes, in our case the price data, the results could be misleading. This requires designers to have an intuition for the important attributes, or for the input dataset to be comprehensive. An increase in data however, will increase the time taken for the analysis to complete, which may be a trade off to the designer.
We also found in the survey that non-technical attributes may be an important part of the decision making process when choosing between PV panels. These non-technical attributes include panel manufacturer’s reputation, name recognition, and service, among others. It is difficult for these attributes to be used in a revealed preference analysis as they are subjective measures which are difficult to quantify accurately for the purposes of comparison. This subjectivity means that there will be increased noise introduced into the dataset, which might lead to a poor result.
6.1 Limitations of Study
Only data from California’s PV market within 2006-2011 time period has been explored. These results might not hold when a larger geographical market is studied, as the preferences of people in different locales and climates might be different. The lack of available PV panel data has also limited our revealed preference analysis. We were only able to obtain the technical data from publicly available specification sheets, and did not have access to other technical data like temperature response, or performance in diffused light, so the analysis did not reflect these considerations.
As noted by literature, accurate consumer preferences are very difficult to measure, making it difficult to validate the accuracy of our findings. Our method is limited to cross-method validation that compares our revealed preference approach to a self-explicated survey method. Additional validation using other established methods such as conjoint analysis may yield slightly different results.
Another challenge to our method of finding the set of critical attributes is the loss of importance rankings during the last part of the analysis, where the critical attributes are taken to be the set of attributes common to the 3 machine learning methods. Where in the survey results an order of importance can be established, it is suppressed in our revealed preference method. This is a potential problem for designers if the critical attributes found are not independent, and where optimizing one attribute would mean a trade off with another critical attribute. More work could be done with the machine learning methods in order to establish a rank order of the attribute importances.
6.2 Future Directions
We found that the non-technical attribute ”aesthetics” may be broken down into two technical attributes. However, with a product with more aesthetic subjectivity and emotional appeal, this breakdown might not be as simple to accomplish. It would be interesting to determine if other products’ non-technical attributes exhibit a similar correlation with technical attributes. Future work could explore the correlation between the technical and non-technical attributes, to see if a decomposition of the non-technical attributes may be found. It is possible that designers may be able to change technical attributes to achieve an increase in a non-technical attribute, which may then affect the performance of the product on the market.
As both revealed and stated preference methods have their strengths and weaknesses, a combined model should be explored, using stated preferences to boost the revealed preference framework [58–60].
Moving beyond solar, this approach can be applied to other technology products as well, to extract consumer preferences for the purposes of guiding the design of product specifications. By identifying key attributes that drive sales, resources can be effectively prioritized to achieve an improved outcome for both the designer and the consumer.
Acknowledgements
This work was supported in part by the Center for Scalable and Integrated Nanomanufacturing (SINAM) at UC Berkeley which is an NSF Nanoscale Science and Engineering Center. The opinions, findings, conclusion and recommendations expressed are those of the authors and do not necessarily reflect the views of the sponsors.
References
[1] Drucker, P., 1994. “The theory of the business”. Harvard Business Review, 72(5), Oct., pp. 95–104. [2] Ulrich, K. T., Eppinger, S. D., and Goyal, A., 2011. Product design and development, 5th ed. McGraw-Hill. [3] Geroski, P., 2000. “Models of technology diffusion”. Research Policy, 29(4-5), Apr., pp. 603–625.
[4] Rogers, E., 1984. Diffusion of innovations. The Free Press, New York.
[5] Honda, T., Chen, H., Chan, K., Yang, M., et al., 2011. “Propagating uncertainty in solar panel performance for life cycle modeling in early stage design”. In 2011 AAAI Spring Symposium Series.
[6] Rucks, C. T., and Whalen, J. M., 1983. “Solar-energy users in arkansas: their identifying characteristics”. Public
Utilities Forthnighly, 111(9), Apr., pp. 36–38.
[7] Wander, J., 2006. “Stimulating the diffusion of photovoltaic systems: A behavioural perspective”. Energy Policy, 34(14), Sept., pp. 1935–1943.
[8] Faiers, A., and Neame, C., 2006. “Consumer attitudes towards domestic solar power systems”. Energy Policy, 34(14), Sept., pp. 1797–1806.
[9] Jetter, A., and Schweinfort, W., 2011. “Building scenarios with fuzzy cognitive maps: An exploratory study of solar energy”. Futures, 43(1), Feb., pp. 52–66.
[10] Samuelson, P. A., 1938. “A note on the pure theory of consumer’s behaviour”. Economica, 5(17), Feb., pp. 61–71. [11] Little, I. M. D., 1949. “A reformulation of the theory of consumer’s behaviour”. Oxford Economic Papers, 1(1), Jan.,
pp. 90–99.
[12] Samuelson, P. A., 1948. “Consumption theory in terms of revealed preference”. Economica, 15(60), Nov., pp. 243–253. [13] Houthakker, H. S., 1950. “Revealed preference and the utility function”. Economica, 17(66), May, pp. 159–174.
[14] Szenberg, M., Ramrattan, L., and Gottesman, A. A., 2006. Samuelsonian economics and the twenty-first century. Oxford University Press, Nov.
[15] Mark, E., 1980. “The design, analysis and interpretation of repertory grids”. International Journal of Man-Machine
Studies, 13(1), July, pp. 3–24.
[16] Tan, F. B., and Hunter, M. G., 2002. “The repertory grid technique: A method for the study of cognition in information systems”. MIS Quarterly, 26(1), Mar., pp. 39–57.
[17] Netzer, O., and Srinivasan, V., 2011. “Adaptive self-explication of multiattribute preferences”. Journal of Marketing
Research, 48(1), p. 140156.
[18] Marder, E., 1999. “The assumptions of choice modelling: Conjoint analysis and SUMM”. Canadian Journal of
Marketing Research, 18, pp. 3–14.
[19] Tseng, I., Cagan, J., and Kotovsky, K., 2011. “Learning stylistic desire and generating preferred designs of consumers using neural networks and genetic algorithms”. In ASME Intl Design Engineering Technical Conf., Washington, DC. [20] Cohen, S., 2003. “Maximum difference scaling: Improved measures of importance and preference for segmentation”.
In Sawtooth Software Conference Proceedings, Sawtooth Software, Inc, Vol. 530, pp. 61–74.
[21] Green, P. E., Carroll, J. D., and Goldberg, S. M., 1981. “A general approach to product design optimization via conjoint analysis”. The Journal of Marketing, 45(3), July, pp. 17–37.
[22] Green, P. E., and Srinivasan, V., 1990. “Conjoint analysis in marketing: New developments with implications for research and practice”. The Journal of Marketing, 54(4), Oct., pp. 3–19.
[23] MacDonald, E. F., Gonzalez, R., and Papalambros, P. Y., 2009. “Preference inconsistency in multidisciplinary design decision making”. Journal of Mechanical Design, 131(3), Mar., pp. 031009–13.
[24] Horsky, D., Nelson, P., and Posavac, S., 2004. “Stating preference for the ethereal but choosing the concrete: How the tangibility of attributes affects attribute weighting in value elicitation and choice”. Journal of Consumer Psychology, 14(1 & 2), p. 132140.
[25] Cummings, R., Brookshire, D., Schulze, W., Bishop, R., and Arrow, K., 1986. Valuing environmental goods: an
assessment of the contingent valuation method. Rowman & Allanheld Totowa, NJ.
[26] Kahneman, D., and Knetsch, J. L., 1992. “Valuing public goods: The purchase of moral satisfaction”. Journal of
Environmental Economics and Management, 22(1), Jan., pp. 57–70.
[27] Beshears, J., Choi, J. J., Laibson, D., and Madrian, B. C., 2008. “How are preferences revealed?”. Journal of Public
Economics, 92(89), Aug., pp. 1787–1794.
[28] Adamowicz, W., Louviere, J., and Williams, M., 1994. “Combining revealed and stated preference methods for valuing environmental amenities”. Journal of Environmental Economics and Management, 26(3), May, pp. 271–292.
[29] Tuv, E., Borisov, A., Runger, G., and Torkkola, K., 2009. “Feature selection with ensembles, artificial variables, and redundancy elimination”. Journal of Machine Learning Research, 10(7), July, pp. 1341–1366.
[30] Agard, B., and Kusiak, A., 2004. “Data-mining-based methodology for the design of product families”. International
Journal of Production Research, 42(15), pp. 2955–2969.
[31] Ferguson, C. J., Lees, B., MacArthur, E., and Irgens, C., 1998. “An application of data mining for product design”. In IEE Colloquium on Knowledge Discovery and Data Mining (1998/434), IET, pp. 5/1–5/5.
[32] Kusiak, A., and Salustri, F., 2007. “Computational intelligence in product design engineering: Review and trends”.
IEEE Transactions on Systems, Man, and Cybernetics, Part C: Applications and Reviews, 37(5), Sept., pp. 766–778.
[33] Griffin, A., and Page, A. L., 1993. “An interim report on measuring product development success and failure”. Journal
of Product Innovation Management, 10(4), Sept., pp. 291–308.
[34] Griffin, A., and Page, A. L., 1996. “PDMA success measurement project: Recommended measures for product devel-opment success and failure”. Journal of Product Innovation Management, 13(6), Nov., pp. 478–496.
[35] CSI, 2011. California solar initative: Current CSI data. http://www.californiasolarstatistics.org/current data files/, Sept. [36] SEIA, 2011. U.S. solar market insight. Executive summary, SEIA/GTM Research.
[37] Cortes, C., and Vapnik, V., 1995. “Support-vector networks”. Machine Learning, 20(3), Sept., pp. 273–297.
[38] Stine, R. A., 1995. “Graphical interpretation of variance inflation factors”. The American Statistician, 49(1), pp. 53–56. [39] Wold, S., R. A. W. H., and Dunn, W. J. I., 1984. “The collinearity problem in linear regression. the partial least squares
(pls) approach to generalized inverses”. Chemometrics and Intelligent Laboratory Systems, 5(3), pp. 735–743. [40] Efron, B., H. T. J. I., and Tibshirani, R., 2004. “Least angle regression”. Annals of Statistics, 32(2), pp. 407–499. [41] Tibshirani, R., 1996. “Regression shrinkage and selection via the lasso”. Journa of the Royal Statistical Society B,
58(1), pp. 267–268.
[42] Hoerl, A. E., and Kennard, R. W., 1970. “Ridge regression: Biased estimation for nonorthogonal problems”.
Techno-metrics, 12(1), pp. 55–67.
[43] Tuv, E., Borisov, A., Runger, G., and Torkkola, K., 2005. “Performance of some variable selection methods when multicollinearity is present”. Chemometrics and Intelligent Laboratory Systems, 78(1-2), July, pp. 103–112.
[44] Obrien, R. M., 2007. “A caution regarding rules of thumb for variance inflation factors”. Quality & Quantity, 41(5), Mar., pp. 673–690.
[45] Brierley, P., Vogel, D., and Axelrod, R., 2011. How we did it team market makers. Tech. rep., Heritage Provider Network Health Prize Round 1 Milestone Winner’s Report.
[46] Rojas, R., 1996. Neural networks: a systematic introduction. Springer.
[47] Breiman, L., 2001. “Random forests”. Machine Learning, 45(1), Oct., pp. 5–32.
[48] Friedman, J., 2001. “Greedy function approximation: a gradient boosting machine”. Annals of Statistics, p. 11891232. [49] Friedman, J., 2002. “Stochastic gradient boosting”. Computational Statistics & Data Analysis, 38(4), p. 367378. [50] Beale, M., and Demuth, H., 1998. “Neural network toolbox”. For Use with MATLAB, Users Guide, The MathWorks,
Natick.
[51] Liaw, A., and Wiener, M., 2002. “Classification and regression by randomForest”. Resampling Methods in R: The boot
Package, 2(3), Dec., pp. 18–22.
[52] Ridgeway, G., 2007. “Generalized boosted models: A guide to the gbm package”. Update, 1, p. 1.
[53] Laroche, M., Bergeron, J., and Barbaro-Forleo, G., 2001. “Targeting consumers who are willing to pay more for environmentally friendly products”. Journal of Consumer Marketing, 18(6), Jan., pp. 503–520.
[54] Gaskell, G. D., O’muircheartaigh, C. A., and Wright, D. B., 1994. “Survey questions about the frequency of vaguely defined events: The effects of response alternatives”. Public Opinion Quarterly, 58(2), June, pp. 241–254.
[55] Bennett, J., and Blamey, R., 2001. The Choice Modelling Approach to Environmental Valuation. Edward Elgar Publishing.
[56] Courage, C., and Baxter, K., 2005. Understanding Your Users: A Practical Guide to User Requirements Methods,
Tools, and Techniques. Gulf Professional Publishing.
[57] Price, L. L., Feick, L. F., and Higie, R. A., 1989. “Preference heterogeneity and coorientation as determinants of perceived informational influence”. Journal of Business Research, 19(3), Nov., pp. 227–242.
[58] Dietrich, E., 2002. “Combining revealed and stated data to examine housing decisions using discrete choice analysis”.
Journal of Urban Economics, 51(1), Jan., pp. 143–169.
[59] Brownstone, D., Bunch, D., and Train, K., 2000. “Joint mixed logit models of stated and revealed preferences for alternative-fuel vehicles”. Transportation Research Part B: Methodological, 34(5), p. 315338.
[60] Hensher, D., and Bradley, M., 1993. “Using stated response choice data to enrich revealed preference discrete choice models”. Marketing Letters, 4(2), p. 139151.
List of Table Captions
1. Table 1: Attribute definition list. (Column A) Initial specs used for SVM analysis (Column B) Expanded specs used for VIF analysis (Column C) Final reduced specs used for 3 regression methods
2. Table 2: Correlation table for important attributes found by ANN
3. Table 3: Top attributes’ Random Forest variable importance values over 100 runs 4. Table 4: Top attributes’ GBM relative influence values over 100 runs
5. Table 5: Important attributes across the 3 methods 6. Table 6: R2values for the 3 methods
List of Figure Captions
1. Figure 1: Cumulative market share of panels 2. Figure 2: Flowchart of methodology
3. Figure 3: ANN bootstrapping error validation 4. Figure 4: Importance ranking of technical attributes
5. Figure 5: Relative importance of technical and non-technical attributes: Open ended question 6. Figure 6: Relative importance of technical and non-technical attributes: Rating question 7. Figure 7: Aesthetic preferences for PV panel categories
8. Figure 8: Name recognition of panel manufacturers 9. Figure 9: Reputation of panel manufacturers 10. Figure 10: Service level of panel manufacturers
Table 1. Attribute definition list. (Column A) Initial specs used for SVM analysis (Column B) Expanded specs used for VIF analysis (Column C) Final reduced specs used for 3 regression methods
A B C
Properties Specifications SVM VIF Reg. Definition
Electrical
Rated power (W) x x Power output of panel at STC Power variance (-%) x x x Negative power output tolerance Power variance (+%) x x x Positive power output tolerance Power at PTC (W) x x Power output of panel at PTC Power ratio: PTC/STC x x x Power output ratio: PTC/STC Efficiency at STC (%) x x x Panel efficiency at STC Fill factor at STC x x Fill factor of panel at STC
Physical
Weight (kg) x x Total weight of panel
Weight per W (kg/ W) x x x Weight of panel per Watt of rated power output
Area of panel (m2) x x Area of panel
Cell Number x x x Number of PV cells in panel
Frame color (black/ not black) x x x Color of panel frame
Thickness (mm) x x x Thickness of panel
Length (mm) x x Length of panel
Width (mm) x x Width of panel
Appearance (even/ uneven) x x Visual surface evenness of panel Cardboard free packaging x Panel packaging contains no cardboard Optimized packaging x x Panel packaging optimized for least waste
Lead-free x x Solder used in panel is lead-free
Tile x Panel in form of roof tiling
Certifications
IEC 61215 / IEC 61646 x x x IEC PV design qualifcation and type approval
IEC 61730 x x x IEC PV module safety qualification
UL 1703 x x x UL Standard for safety of flat-plate PV panels CE Marking x x x Compliance with European conformity requirements
IS0 9001 x x x IS0 Quality management standard
IS0 14001 x x x IS0 Environmental management standard
NEC 2008 x x NEC Safe installation of electrical equipment standard Safety class II @ 1000V x x Double insulated appliance standard
IEC 61701 x IEC PV Salt mist corrosion standard
UL 4703 x UL PV cable standard
Warranty Workmanship Warranty (years) x x x Workmanship warranty Power warranty (% power
war-ranted years)
x x x Power warranty, calculated for comparison by taking area of the % warrented by years warranted curve
Economics Effective Cost/W ($/W) x x x Post subsidy system cost per Watt of rated power output Time on market (years) x x x Length of time panel has been on the market
Table 2. Correlation table for important attributes found by ANN R 1 2 3 4 5 6 7 8 9 10 Power Warranty 1.00 Efficiency at STC -0.43 1.00 Time on market -0.17 -0.19 1.00 NEC 2008 0.05 -0.06 -0.26 1.00 Cell Number -0.07 0.16 0.03 -0.21 1.00 Power Variance (+%) -0.10 0.13 0.27 0.29 -0.22 1.00 Safety class II 0.04 -0.01 -0.30 -0.09 0.19 -0.43 1.00 Power ratio: PTC/STC -0.07 0.26 -0.09 -0.07 0.17 -0.12 0.16 1.00 Effective Cost/W -0.14 0.28 0.23 0.10 0.26 0.36 -0.13 0.07 1.00 Length -0.15 0.00 0.51 0.06 -0.29 0.44 -0.24 0.00 0.16 1.00
Table 3. Top attributes’ Random Forest variable importance values over 100 runs
Attributes Mean Std Dev
Power warranty 27.05 0.85
Time on market 25.21 0.73
Power variance (-%) 21.49 0.75
Fill factor at STC 20.40 1.00
IEC 61215 (crystalline) or IEC 61646 (thin film)
17.76 0.76 IS0 9001 17.51 0.88 Weight 13.79 1.15 Safety class II @ 1000V 13.67 0.81 Power variance (+%) 12.79 0.91 Efficiency at STC 10.48 0.95
Table 4. Top attributes’ GBM relative influence values over 100 runs
Attributes Mean Std Dev
Fill factor at STC 23.91 0.64 Efficiency at STC 18.25 0.61 Power Variance (-) 13.43 0.56 Power ratio: PTC/STC 11.82 0.43 Effective Cost 6.72 0.19 Power warranty 5.05 0.30
IEC 61215 (crystalline) or IEC 61646 (thin film)
2.89 0.33
Weight 2.70 0.14
Time on market 2.37 0.29
Table 5. Important attributes across the 3 methods
Rank ANN Random Forest GBM
1 Power warranty Power warranty Fill factor at STC
2 Efficiency at STC Time on market Efficiency at STC
3 Time on market Power variance (-%) Power variance (-%)
4 NEC 2008 Fill factor at STC Power ratio: PTC/STC
5 Cell number IEC 61215 / IEC 61646 Effective Cost/W
6 Power variance (+%) IS0 9001 Power warranty
7 Safety class II @ 1000V Weight IEC 61215 / IEC 61646
8 Power ratio: PTC/STC Safety class II @ 1000V Weight
9 Effective Cost/W Power variance (+%) Time on market
Table 6. R2 values for the 3 methods
ANN RF GBM
Table 7. PV panel appearance groups
Light frame color Dark frame color
Even surface appearance
Uneven surface appearance