Analysis and Calibration of Social Factors in a Consumer Acceptance and Adoption Model for Diffusion of Diesel Vehicle in Europe
by Qi Zhang B.S. Materials Science Fudan University, China, 2004
Submitted to the Engineering Systems Division in Partial Fulfillment of the Requirements for the Degree of
Master of Science in Technology and Policy at the
Massachusetts Institute of Technology February 2008
@2008 Massachusetts Institute of Technology. All rights reserved.
Signature of Author... ...
Technology and Policy Prog!! jmeering Systems Division
January 1 8th, 2008
Certified by... ... ... ... ... ...
/ •John D. Sterman
Jay W. Forrester Professor o Management and Engineering Systems
j"/
Director, System Dynamics Group Thesis SupervisorAccepted by... ... . ... . ... Dava J. Newman Professor of Aeronautics and Astronautics and Engineering Systems Director, Technology and Policy Program
mASSACHU• S INSTUTE.
OF TEOHNOLOGY
JUN 1,0 2008
LIBRARIES
Analysis and Calibration of Social Factors in a Consumer Acceptance and Adoption Model for Diffusion of Diesel Vehicle in Europe
by Qi Zhang
Submitted to the Engineering Systems Division
on January 18t , 2008 in Partial Fulfillment of the Requirements
for the Degree of Master of Science in Technology and Policy
Abstract
While large scale diffusion of alternative fuel vehicles (AFVs) is widely anticipated, the mechanisms that determine their success or failure are ill understood. Analysis of an AFV transition model developed at MIT has revealed that AFV diffusion dynamics are particularly sensitive to consumer consideration as influenced by social exposure to AFVs. While some empirical research in this area exists, uncertainty regarding these social exposure parameters remains high. Following principles of partial model testing, this research examines social exposure parameters, with a focus on empirical accounts of diffusion involving diesel passenger vehicles in Europe. The research uses the historical data of diesel sales in six European countries. To complete diffusion datasets the research generates synthetic data in early stages of diffusion. The results from the calibrations yield parameters that are in line with other marketing studies. These findings help reduce uncertainty regarding social exposure parameters in the automotive industry. Further, bootstrapping confidence intervals are conducted to test the reliability of the parameter estimate. Challenges and avenues about building confidence in parameter estimate and data analysis are discussed.
Thesis Supervisor: John D. Sterman
Jay W. Forrester Professor of Management and Engineering Systems Director, System Dynamics Group
Table of Contents
A bstract ... 2 Chapter 1 Introduction ... ... .... 6 Introduction ... 6 M otivation ... 6 Audience... 7 Research Objectives ... 8Chapter 2 Alternative Fuel Vehicle Transition: A System Dynamic Approach... 8
Introduction to System Dynam ics ... 8
Challenges in A lternative Fuel V ehicle Transition ... ... . 11
Alternative Vehicle Market Transition (AVMT) Model... ... 13
D iesel D iffusion in Europe... 16
Chapter 3 Data Collection and Generation ... 19
D ata Collection ... 19
Generation of Synthetic Datasets ... 20
Chapter 4 M odel Calibration ... ... 26
Purpose of Calibration... 26
The AVM T M odel for D iesel Study ... ... 27
Social Exposure and Vehicle Attributes... 29
Calibration of Social Exposure Parameters... 33
Behavior Reproduction Tests ... .. 35
Calibration Results: Social Exposure Param eters ... 40
Chapter 5 Confidence Intervals ... ... 42
Bootstrapping Theory... 42 Bootstrapping Process ... ... 44 Chapter 6 Conclusions ... 56 G eneral Conclusion ... 56 D ata A nalysis ... 57 Policy Insights ... 58 References... 60
List of Figures
Figure 1 US Fuel Assumption in Transportation Sector in 2006... ... 6
Figure 2 Feedback Loops -- Reinforcing Loop... 9
Figure 3 Feedback Loops -- Reinforcing Loop and Balancing Loop ... . 10
Figure 4 Feedback loops with Stock and Flow Structure ... 11
Figure 5 The AVM T M odel Boundary... ... 14
Figure 6 Diesel Share in Passenger Vehicle New Registrations... ... 17
Figure 7 M anual Calibration Results ... ... 22
Figure 8 V ehicle A ging Chain ... ... 23
Figure 9 Data D erivation Structure... ... 23
Figure 10 Diesel New Registrations - Actual Data and Estimated Data... 25
Figure 11 Diesel Share Installed Base - Estimated Data... ... 26
Figure 12 AVM T Consideration Loops... 28
Figure 13 Perceived Utility of Diesel Platform conditioned by Vehicle Attributes ... 32
Figure 14 Diesel Diffusion Pattern Reproduction - France, Germany and Italy... 37
Figure 15 Diesel Diffusion Pattern Reproduction - Spain, Sweden and UK... 38
Figure 16 Social Exposure Parameter Calibratioin Results... ... 41
Figure 17 Error T erm s ... 45
Figure 18 Histogram of the Underlying White Noise... ... 50
Figure 19 Bootstrapping Confidence Intervals -Effective Contact Rate with Diesel Drivers... 54
Figure 20 Bootstrapping Confidence Intervals -Effective Contact Rate with Non-Diesel Drivers ... ... ... ... ••...••••••••... .. ... ... ... 55
List of Tables
Table 1 Data Resource ... 19
Table 2 Vehicle A ttributes - Italy... ... 32
Table 3 Calibration Scenarios ... ... 35
Table 4 Behavior Reproduction Tests... ... 40
Table 5 Test Statistic Results ... ... 49
Table 6 Error Term s Inflation ... 52
Chapter 1 Introduction Introduction
This thesis addresses the challenge of parameter estimation and confidence building in modeling consumer acceptance and adoption behaviors. Focused on empirical accounts of diesel passenger vehicle diffusion in Europe, it derives insights about alternative fuel vehicle transition. It also improves approaches in reconstructing data series and testing confidence intervals of parameter estimation.
Motivation
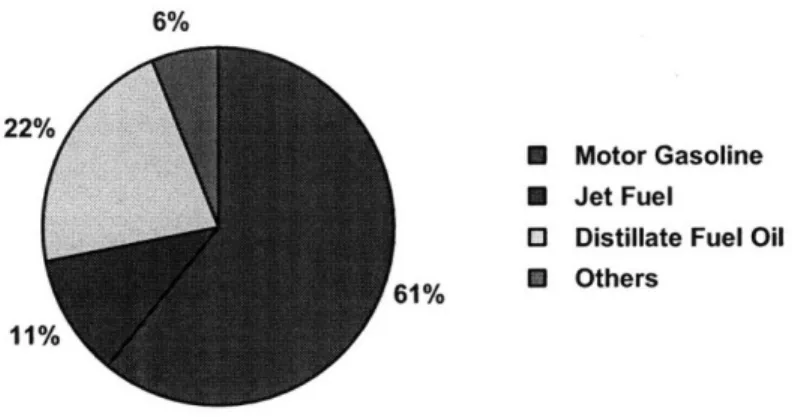
As the single largest vehicle market in the world, the United States heavily relies on petroleum fuels. Sixty-eight percent of petroleum fuels are consumed annually by the transportation sector (EIA 2006). The diversity of transportation fuel types is limited (Figure 1). As fuel demand continues to rise and domestic supplies diminish, the US depends more and more on fossil fuel imports, which have raised serious concerns of energy security in the public policy community. In addition, the increasing awareness of the environment impact of petroleum fuel emissions inspires scientists, researchers and policy analysts to explore alternative clean fuel options for the automotive market. These options include biodiesel, compressed natural gas (CNG), ethanol, hydrogen, and clean diesel.
6%
22'
11
* Motor Gasoline * Jet Fuel
O Distillate Fuel Oil
i1% N Others
;1%
Figure 1 US Fuel Assumption in Transportation Sector in 2006 Source: EIA 2006
While large scale diffusion of alternative fuel vehicles (AFVs) is widely anticipated, the mechanisms that determine their success or failure are poorly understood mainly for two reasons. First, the diffusion process is a highly complex system with many stakeholders, strong feedback dynamics and long time delays, making it a significant challenge for the transition to a self-sustaining level. Second, there are only a few AFV diffusion cases worldwide that provide the empirical field for studies. Among the few cases, diesel diffusion in Europe is one of the success stories that has achieved large scale penetration while compressed natural gas (CNG) in New Zealand faltered after initial subsidies expired.
Analysis of an AFV transition model (AVMT) developed at MIT (Struben 2006, Struben and Sterman 2007) has revealed that AFV diffusion dynamics are particularly sensitive to consumers' decisions influenced by their social exposure to AFVs. While some empirical research in this area exists, uncertainty about these parameters remains high. A detailed empirical study is needed to reduce the uncertainty of these social exposure parameters, and to build confidence in this model before applying it to simulate other alternative fuel transitions.
Diesel diffusion in Europe is the natural model choice. The successful diffusion of diesel vehicles in Europe over the past thirty years provides rich data resources to make the calibration of social exposure parameters possible. The study of diesel diffusion patterns and dynamic behaviors could benefit research communities and policy analysts in terms of introducing other alternative fuel vehicles.
This work focuses on solving challenges in data completeness, parameter calibration and confidence tests of a dynamic behavioral model, and derives lessons for alternative fuel vehicle diffusion.
Audience
The approaches to data completion and confidence tests used in this thesis are helpful to SD researchers in academic communities who face challenges of building credibility in dynamic behavioral models. The derived insights about alternative fuel diffusion are of interest to
members of the public policy world who are concerned about fossil fuel dependence in the automotive market, including but not limited to policy analysts, legislators, and agency program managers, as well as business strategists who want to explore the future of
alternative fuel vehicles in the corporate world.
Research Objectives
The study aims to (1) explicate the various patterns of diesel diffusion in Europe, particularly the role of social factors in the diesel transition, to (2) apply calibration methods to improve robustness and build confidence in parameter estimation in a complex dynamic model, and to (3) solve challenges in data completion, generation and analysis in an empirical research.
Chapter 2 Alternative Fuel Vehicle Transition: A System Dynamic Approach Introduction to System Dynamics
System dynamics (SD) is an approach to interpreting the combinatorial complexity of problematic behaviors of a system, which often involve multiple stakeholders, dynamic interacting feedbacks, nonlinearities and time delays. To learn the dynamic behaviors of a complex system, SD researchers continue the process of formulating hypotheses, building models and simulating behaviors. The insights derived from simulation experiments can enhance the understanding of real world problems and help researchers design and evaluate solutions for behavior improvement.
Behaviors of a system are driven by the underlying structure of feedback loops (Forrester 1969). This structure is composed of information feedbacks, stocks and flows and nonlinearities introduced by the decision making of the agents involved (Sterman 2000). The theory that explains how endogenous consequences of the structure generate observed behaviors is the Dynamic Hypothesis (DH). The DH is the foundation of an SD simulation model and needs to be improved by model testing. SD model testing is an experimental process of building confidence in the DH so that the DH can be responsible for the structure of feedback loops and observed
behavior patterns (Oliva 2003). With enough confidence in the DH, researchers can derive insights from simulation experiments for problems of interest, design and evaluate policy solutions and help communicate this understanding to clients and other modelers.
Though no model is perfect due to people's subjective, limited, and simplified understanding of the real world (Sterman 2000), a robust model - one that matches observed behaviors and is confident in its DH and structure - is able to better inform the client and influence important decisions. Model testing is an iterative and ongoing process necessary in building a robust model. A substantial body of literature discuss a variety of tests on SD models (Forrester and Senge
1980, Barlas 1989, 1990, 1996, Sterman 2000, Oliva 2003) including boundary assessment, structure assessment, parameter assessment, extreme conditions, behavior reproduction, sensitivity analysis and calibration. Chapter 4 discusses the details of the model tests used for this study.
The following discussion provides a brief introduction to the field of system dynamics.
Social Exposure Fleet of Platform Consumer Awareness Consideration Adopters Adoption Rate
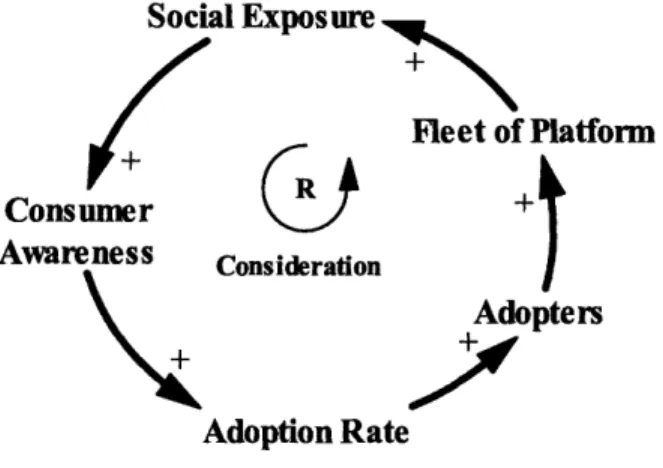
Figure 2 Feedback Loops - Reinforcing Loop
Feedback
Complex behaviors of a system arise from the interactions among stakeholders. The interactions are composed of two types of feedback loops: reinforcing loops and balancing loops. Reinforcing
loops amplify the existing influence in a system while balancing loops counteract the change in a system. Figure 2 shows an example of a reinforcing loop in a vehicle adoption system.
In the example, the larger installed base of a vehicle platform, the more social exposure a platform has to consumers, the more consumer awareness of the platform, and vice-versa. Consumer awareness drives consumer's transition to the platform at a fractional rate. Figure 2 and 3 are called casual loop diagrams. The directions of the arrows indicate the causal relationships. The + sign at the arrowhead indicates the effect is positive. R represents the polarity of a reinforcing loop.
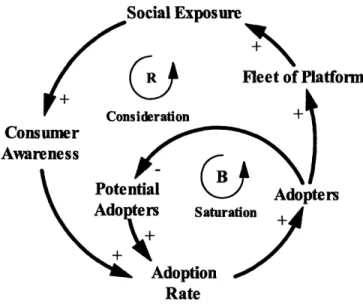
Figure 3 shows an example of balancing loops. The more adopters for a product, the less potential consumers will adopt the product in the future. While the potential adopter pool shrinks, the negative effects kick in through the balancing feedback. This loop, B, counteracts changes in the causal chains. All the systems consist of a network of reinforcing loops and balancing loops. The interactions among these loops drive the dynamic behaviors of a system.
Social Exposure Fleet of Platfo di ti•.•4 + 4 Consumer Awareness irm %.Vs1 rA V" + ! Adopters Saturation kdoption Rate
Stocks and Flows
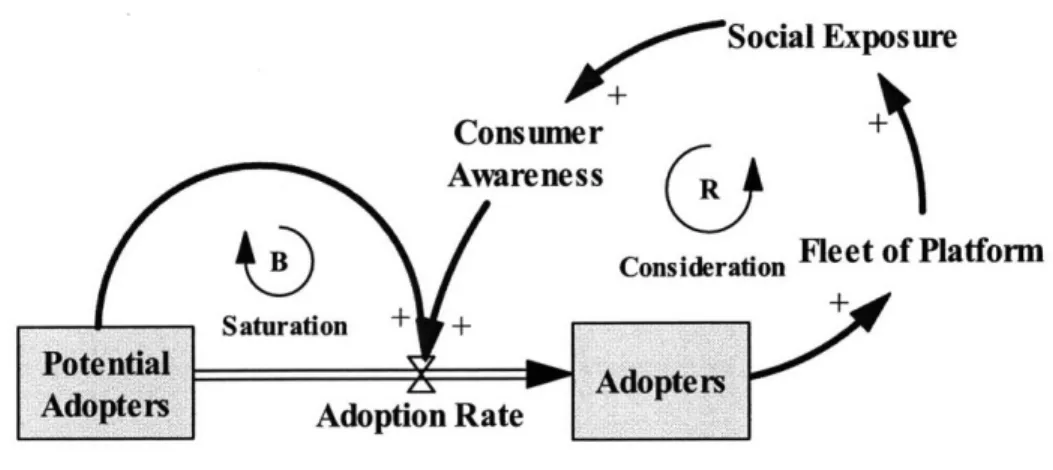
SD conceptualizes system components as state variables (stocks) and rate variables (flows). Stocks are the accumulation of net flows (inflows less outflows). As a memory of previous dynamics, stock variables introduce a key dynamic concept into a system - time delays. Figure 4 applies stocks and flows structure to the vehicle adoption example.
+0""*Social Exposure Consumer
I
)f Platform
Figure 4 Feedback loops with Stock and Flow Structure
Challenges in Alternative Fuel Vehicle Transition
The increasing concerns of energy dependence, particularly petroleum imports, and greenhouse
gas emissions from conventional vehicles, or internal combustion engine (ICE) vehicles, have made AFVs a favorable solution in the public policy domain. However, the successful diffusion of AFVs in the automotive marketplace faces more difficult challenges than many other durable goods for several reasons.
The disadvantage of being a late entrant is significant in this case. Emerging at the end of the 19th century, ICE has dominated the automotive market for over one hundred years. The vast ICE fleet and the enormous automotive industry create a wide range of powerful positive feedback effects on the dominance of ICE technology. Key positive feedbacks include economics of scale reflected in cost reduction and performance improvement, consumer awareness through word of mouth and marketing channels, learning by doing, R&D, technology spillovers and complementary services such as fuel infrastructure and maintenance.
As the ICE vehicle installed base achieves a sizeable market share, world of mouth from ICE drivers increases the consumers' awareness and adoption of the platform, and more investments are channeled into R&D, vehicle model development, infrastructure expansion and other areas so that ICE becomes even more attractive to consumers. On the contrary, the adoption of AFVs faces the "Chicken and Egg Problem" (Farrell et al. 2003, Ogden 2004, Bentham 2005, Struben 2006). For instance, automakers and component suppliers will not invest significantly in a new product unless they perceive a promising market potential. Consumers will not go after AFVs without a demonstration of their features and the costs of these investments. The chicken-and-egg dilemma is even severe for some AFV technologies that require new infrastructure networks, such as hydrogen.
Time delay is another important factor contributing to the challenges of the AFV transition. Because of the long lifespan of a vehicle, 16.9 years for the most recent model (Davis and Diegel 2006), consumer replacement purchases are delayed. The effects of consistent AFV transition efforts from the government and automakers may be visible only after decades. Time delays also exit in consumer awareness and adoption. It takes time for consumers to attain their knowledge, grow interest and develop emotional attachment to new vehicle platforms through personal experience, word of mouth and marketing channels. The existence of long physical and informational time delays requires policymakers and automakers to take a long-term view when designing AFV policies. But it is difficult to achieve due to people's cognitive limits such as linear and often short-term thinking.
Different from many durable goods, passenger cars serve not only a transportation tool, but also as a sign of social status and personal identity. Except for vehicle attributes, consumer choice is strongly influence by personal experience, social interaction and culturally shared views (Kay 1997, Hard and Knie 2001, Miller 2001). Consumer's perceptions are often heterogeneous in a physical and socio-economic space, which means that a successful AFV diffusion pattern in one geographic place may not work well in other areas. Other challenges in AFV transition include negative AFV innovation spillovers that may benefit conventional ICE technologies, huge experience lags between AFV and ICE technologies among production and service professionals,
and last but not least, the capital-extensive nature of AFV R&D and infrastructure investments. Existing diffusion studies, particularly the Bass model, perform poorly in capturing the complex dynamics in the AFV transition where multiple platforms compete and multiple stakeholders participate. The complexity of the AFV transition calls for an explicit diffusion model.
Alternative Vehicle Market Transition (AVMT) Model
To address these challenges in AFV diffusion, the AFV study at MIT System Dynamics Group has developed a behavioral, dynamic integrated model with a broad model boundary (Struben 2006; Struben and Sterman 2007), named Alternative Vehicle Market Transition (AVMT) model. This AVMT model describes the diffusion and competition among AFV platforms driven by endogenous interactions of consumer awareness, product attractiveness, infrastructure complementarities, learning by doing, R&D and innovation spillovers. The broad boundary of AVMT model enables analyses of the wide range of feedbacks that determine the AFV diffusion dynamics. The model builds on theory in a variety of fields including behavioral dynamic models (Forrest 1969, Sterman 2000), innovation diffusion (Rogers 1962, Bass 1969, Lekvall and Wahlbin 1973, Norton and Bass 1987, Urban et al. 1990, Urban et al. 1996) and discrete consumer choice (McFadden 1978, McFadden 2001, Ben-Akiva and Lerman 1985).
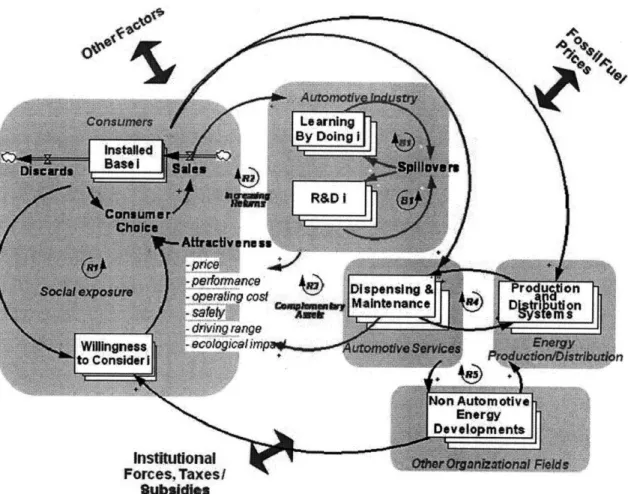
Figure 5 provides a conceptual overview of the model boundary and key feedback loops.
In this model, consumers make choices among platforms (e.g., ICE, hybrid, CNG) depending on the relative attractiveness of each platform in their consideration set. Individuals extend their consideration set to include a particular option only when they become sufficiently familiar with it. Familiarity is increased by social exposure through driver experience, word of mouth and marketing channels. Attractiveness of each platform depends on vehicle attributes, such as performance, cost, range, etc. Vehicle attributes are improved endogenously through learning by doing, R&D and complementary assets. With a broad boundary, the AVMT model represents the AFV transition with fidelity, and provides an experimental platform for in-depth tests of designed intervention policies at many points in the system. Struben and Sterman offer detailed model descriptions and documentations in their paper.
Subsidies
Figure 5 The AVMT Model Boundary (Jeroen Struben 2006)
The dynamics of the AVMT model arise from several characteristics. First, this model captures the physical evolution of the vehicle installed base, vehicle technology, and refueling infrastructure. It also endogenously tracks the intangible changes in consumer perception and the learning experiences of automakers and infrastructure operators. The model structure of physical asset and information evolution brings time delays into the systems, which are particularly important in the real world AFV transition. Different from many durable consumer goods, vehicle diffusion is a slow process with time delays at various points. One influential delay in AFV transition is the time-consuming vehicle replacement that follows the vehicle life cycle. It takes years for any progress in consumer awareness, product attributes or policy incentives to produce visible effects on the market share of AFVs. Significant time delays also exist in the
formation of consumer opinions, the expansion of infrastructures, and the development of technologies. Taking all these time delays into account, the AVMT model is capable of reproducing a vehicle diffusion pattern in which time delays play a key role.
Secondly, the AVMT model is unique in addressing important spatial heterogeneity by endogenously modeling the co-evolution of infrastructure supply and vehicle demand, which is the underlying mechanism of the chicken-and-egg dynamics AFV transition. Jeroen Struben (2006) conducts a detailed analysis of the co-evolutionary dynamics with strategically locating fuel station entrants, which reveals important findings in a spatial context. For instance, the urban adoption clusters which often speed local diffusion in the early AFV diffusion stage can obstruct the formulation of a self-sustaining market on a larger spatial level.
Further, the AVMT model illustrates nonlinearities in the system, such as fuel availability on individual trip demand. The marginal benefits of a few additional fuel stations is much lower in the early diffusion period for consumers who want to make trips, but will increase dramatically as the number of fuel stations and vehicles increases, and returns to zero when the station space distributions are saturated. Therefore, the correlation between the marginal benefits of fuel availability and consumer trip efforts is more like an S shape than linear. The nonlinearities increase the level of difficulty for AFV diffusion to achieve a self-sustaining level in the early stage of market formation.
Last but not least, AVMT is a behavioral model capturing decisions of various stakeholders explicitly. Rather than assuming rational decision making with perfect information, this model represents how decisions are actually made by various stakeholders who use simple decision rules based on uncertainty or incomplete information. The behavioral elements in the model include consumers' choice to adopt an AFV platform, their trip plan, and their decision to go out of the way to find fuel, as well as a fuel station operator's decision to choose station entry and location, adjust capacity, and so on. Grounded in observed behaviors, the modeling of explicit decision making derives important insights about the dynamic complexity of AFV transition credited to multiple agents.
Consumer Consideration
The core structure of the AVMT model is consumer acceptance conditioned by consumer consideration and product attractiveness. The willingness of consumers to consider a vehicle platform is driven by their social exposure to that platform. Social exposures come from word of
mouth and marketing channels.
Struben and Sterman (2007) demonstrate that word of mouth effects play an important role in the overall AFV diffusion. The larger the installed base of an AFV platform, the greater the social exposure to and familiarity with that platform among potential adopters, increasing the chances that they will choose that platform. Further, Sruben and Sterman point out that the word of mouth effects from non-AFV drivers are significant. These non-AFV drivers tell others about what they saw and thought about AFVs. The indirect effects of word of mouth from non-drivers may not have been as significant as those from AFV drivers at one time. But because of the long vehicle replacement cycle, the word of mouth effects from non-drivers have accumulated significantly over the years so that consumer awareness about the new technology continues to increase and spread even though these individuals do not need a vehicle at that time.
More specifically, Struben and Sterman find the existence of a critical threshold that the adoption of AFV must exceed to achieve self-sustaining. The threshold is particularly sensitive to the values of three factors - marketing programs for AFVs, the word of mouth impacts from AFV drivers and the word of mouth impacts from non-AFV drivers. These factors are crucial in determining whether the AFV adoption can be successful or not. However, the uncertainty regarding the magnitude of these effects remains high. An empirical study is needed to quantify and confine the values of these factors.
Diesel Diffusion in Europe
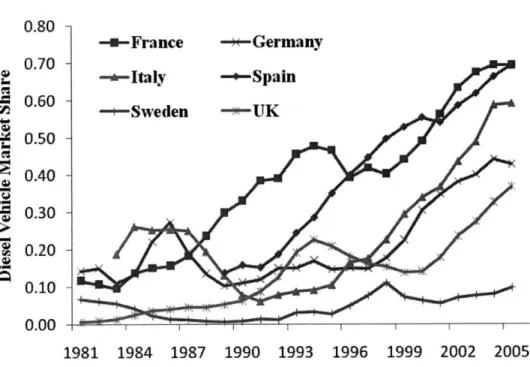
Diesel has become a major transportation fuel in the European market. Since their take-off in the mid-twentieth century, the market share of diesel passenger cars in many European countries has notably increased. The diesel share of new registrations in France and Spain exceeds 65% each year. Diesel penetration in Germany and Italy has grown at an average rate of 20% since 1991.
However, the diesel diffusion pattern is not uniform across European countries. Sweden did not experience an obvious transition from petrol to diesel, and its diesel share has struggled at below 10% for decades. U.OU 0.70 • 0.60 0.50
0.40
- 0.30 0.20 0.10 0.00 1981 1984 1987 1990 1993 1996 1999 2002 2005Figure 6 Diesel Share in Passenger Vehicle New Registrations Source: PFC Energy
The rising share of diesel as an alternative to petrol fuel is credited to policy incentives and consumer acceptance in these countries. Many European governments are known to leverage policies to favor diesel fuel. As a result, diesel fuel is significantly cheaper than petrol in those countries, typically at a 20% discount (Chen and Sperling 2004). The substantial fuel expenditure savings as well as tax benefits associated with purchasing and owning a diesel vehicle offset its higher retail price. Consumer consideration is another key contributor to the remarkable rise of the diesel population. Consumers in European countries are generally familiar with diesel vehicle technology from their extensive exposure to diesel from word of mouth among fellows as well as marketing programs. Consumers' common perception of diesel as dirty, noisy, heavy and polluting has changed as technology advances in improving vehicle performance. The increased utility of a diesel platform attracts an ever broader range of consumers, which economically motivates automakers and infrastructure operators to build 17
business around the diesel platform. The attractiveness of a diesel platform expands as diesel models become widely available, vehicle performance is improved through R&D, and refuel infrastructure network is well constructed. Driven by these powerful positive feedbacks, the diesel population in countries like France, Italy and Spain has outsold petrol models.
However, diesel shares are not uniform across Europe. In Sweden, higher diesel fuel prices are discouraging diesel sales as well as tax policies favoring gasoline over diesel (Chen and Sperling 2004).
The long history of the diesel transition in European markets provides quality data for an empirical study. The similar social-economic environments in these countries diminish the economical and cultural reasons on the difference of diffusion patterns. Vehicle attractiveness conditioned by country specific policies as well as consumer consideration driven by local marketing channels contribute to the main difference in the diffusion paths taken by these countries. Moreover, the similarity of mobility behaviors of consumers in European countries
-how often consumers drive, their driving distance, the way they communicate with fellow drivers
- enables the research on the general, non-country specific factors, such as word of mouth effects across different diffusion patterns.
This study collects and reconstructs diesel sales empirical data from France, Germany, Italy, Spain, Sweden and the United Kingdom from 1970 to 2005 (Chapter 3). Using the AVMT model, the study explores the different patterns of diesel diffusion in these six countries, particularly focusing on the role of the social factors in the diesel transition. Model calibration is conducted to estimate the influence of social factors in determining the diffusion pattern (Chapter 4). Confidence intervals of the parameter estimations are tested using the bootstrapping method (Chapter 5). Conclusions and recommendations are provided in Chapter 6.
Chapter 3 Data Collection and Generation Data Collection
This study requires empirical data beginning in 1970's, when diesel diffusion started to take off in Europe. So the year 1970 is considered to be a reasonable starting year for estimation. Both the installed base and new registrations can be calibration targets though the installed base data, a
stock value, are less volatile and less noisy than new registrations data, a flow variable.
This work collects data on new registrations, installed base and other related data of France, Germany, Italy, Spain, Sweden and the United Kingdom from various resources including international data organizations, such as Eurostat, and independent vehicle industry information agents, such as Polk and PFC Energy. Periods of available data vary: new registrations from 1981 to 2005 from Polk; installed base and new registrations from 1992 to 2004 from PFC Energy; installed base from 1979 to 2004 from Eurostat.
Table 1 Data Resource
Platform Source Usage Data Available Data Needed Data Gap
Diesel
New Registrations Polk Calibration 1981-2005 1970-2005 1970-1980 Installed Base PFC Energy Calibration 1992-2004 1970-2005 1970-1991 Total
New Registrations Eurostat Model Input 1979-2004 1970-2005 1970-1978 Installed Base Eurostat Model Input 1979-2005 1970-2005 1970-1980
As shown in Table 1, there are substantial gaps between numerical data that are available and data that are needed: Eurostat data not available at fuel type level; Polk and PFC Energy data missing early diesel diffusion. The data gaps can reduce accuracy and credibility of calibration results. In order to fill the data gap during the early adoption stages, this study designs two approaches to generate synthetic datasets of diesel new registrations and installed base in the early diffusion.
Generation of Synthetic Datasets
This study uses two approaches to estimate diesel new registrations and diesel installed base in early stages. The first approach is a manual trend extrapolation while the second approach is an automated computation. Approach One is often called "calibration by hand." This approach sets a parameter, and then adjusts the value of this parameter to generate outputs that match with historical data. The steps of this approach are described as follows.
Approach One: Trend Extrapolation
(1) Use diesel new registrations data from 1981 to 2005 from Polk. Set twelve years since 1981 as the reference period, new registrations at 1992 as the reference price. Derive the growth trend of diesel new sales based on the reference period and the reference price. The growth rate is adjusted by parameter g,.
(2) Assume the initial diesel installed base Vo at 1990 is equilibrium, meaning replacement purchases equally compensate vehicle discards. Set the average vehicle life at 15 years. Therefore, the initial diesel installed base at 1970 is equal to new registrations at 1970 multiplied by average vehicle life T adjusted by the growth rate of the installed base gv during a vehicle lifespan.
(3) Add the previous year's installed base V,_- to new registrations s, and distract discards of that year d, to get the installed base for the years after 1970, V, .
(4) Assume discards d, from 1971 and 1985 (one vehicle life cycle after 1971) is equal to new registration s, minus previous year's installed base ( V,_, ) multiplied by the growth rate of installed base gv. Discard after 1985 is equal to new registrations s,_, one vehicle life cycle ago. (5) Manually fit synthetic diesel installed base to historical data from PFC Energy by altering values of g, and gv. Repeat step (1) to (5) till a reasonable fit between data and model output.
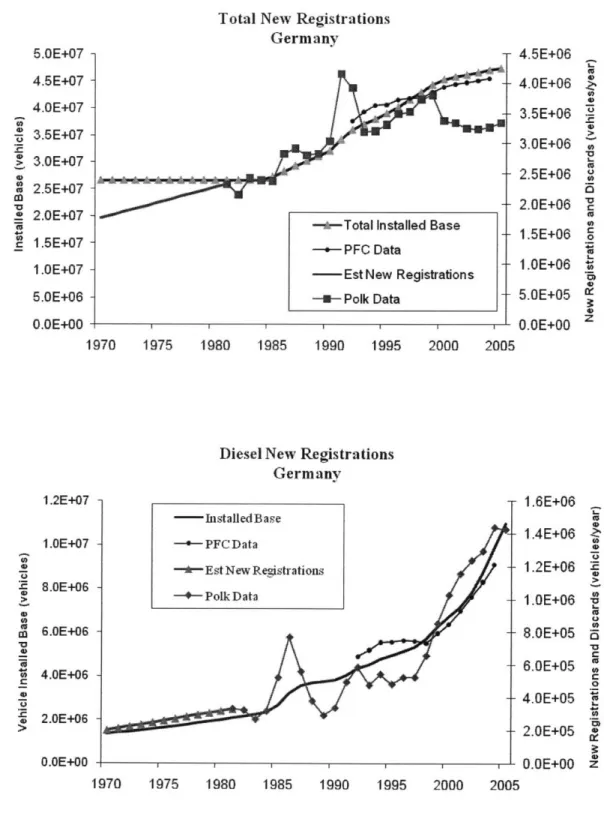
Figure 7 shows the manual calibration results for Germany. Though Approach One is a straightforward method, it has several limitations. First, the extrapolation sales trend is conditioned by the choice of the reference price and the reference horizon. The subjective picking of reference points can introduce biases into the estimate. Second, "calibration by hand"
is often not accurate when there are multiple parameters. A manual manipulation is not able to optimize several parameters simultaneously, which limits its ability to search through all the value space to find the best fit scenario. Finally, it is difficult to repeat the results of a manual calibration. Since the best fit is judged by visual observations, a replication effort can hardly derive original parameter estimations.
In order to avoid the problems of "calibration by hand", this study designs a structure to generate synthetic datasets by automatic computation. The idea is to build a data derivation model in Vensim and take advantage of Vensim's optimization function to search for the best estimation for the growth rate of diesel new registrations prior to 1981. With an estimated diesel sales growth rate and new registration between 1970 and 1981, initial diesel installed base at 1981 can be derived, serving as a start point for Chapter 4 calibration.
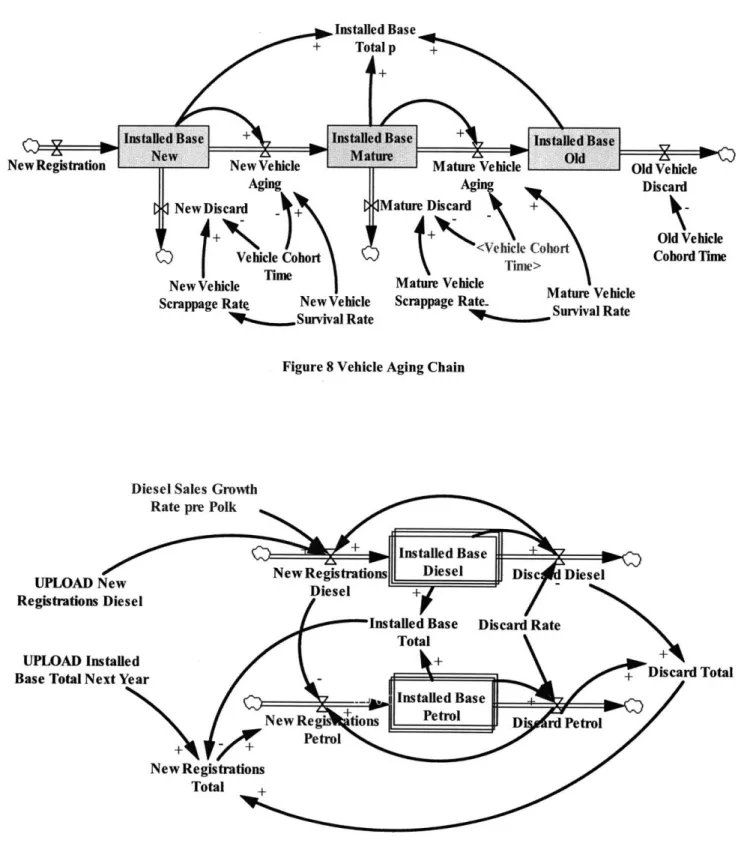
The core of this data derivation model is a vehicle aging chain (Figure 8). This structure divides total vehicles into three categories, or cohorts: new, mature and old. The stock of new installed base is an accumulation of new registrations less discards. Aging vehicles are transitioned to the mature installed base, and then the old installed base. Vehicles surviving after the first two cohorts are inputs into old installed base and falls through discards eventually. The transition rate is determined by the average aging time for this stock and vehicle survival rate. Vehicle survival rate for new installed base is 0.97 and for mature installed base, 0.83 (Cohen and Greenspan
Total New Registrations Germany
1970 1975 1980 1985 1990 1995 2000 2005
Diesel New Registrations Germany
1970 1975 1980 1985 1990 1995 2000 2005
Figure 7 Manual Calibration Results 5.OE+07 4.5E+07 4.0E+07 3.5E+07 3.0E+07 2.5E+07 2.0E+07 1.5E+07 1.OE+07 5.0E+06 0.OE+00 4.5E+06 4.0E+06 3.5E+06 3.0E+06 2.5E+06 2.0E+06 1.5E+06 1.0E+06 5.0E+05 O.OE+00 InstalledBase PFC Data
SEst New Registrations
-4-Polk Data 1.2E+07 1.OE+07 8.OE+06 6.OE+06 4.OE+06 2.OE+06 O.OE+00 1.6E+06 1.4E+06 1.2E+06 ' 1.0E+06 2 8.0E+05 ~3 6.0E+05 2 4.0E+05 . 2.OE+05 B 0.OE+00 z
Vehicle Cohort Time
Scrappage Rate New Vehicle
L• Survival Rate Týime> Discard Old Vehicle Cohord Time Scrappage Rate-Survival Rate
Figure 8 Vehicle Aging Chain
Diesel Sales Growth
UPLOAD T
Registrations
UPLOAD Ins
Base Total Ne
Figure 9 Data Derivation Structure
Total
Figure 8 is the diagram of the data derivation structure. The vehicle aging chain applies to modeling both diesel and petrol installed base. Steps of Approach Two are as follows.
Approach Two: Data Derivation
(1) Set the diesel sales growth rate prior to first year of Polk data, 1981, as a parameter gpp. Extrapolate the diesel sales trend prior to 1981 using gp and the diesel sales data at 1981. Upload both synthetic datasets and historical diesel data into the diesel aging structure. (2) Set petrol new registrations as total new registrations minus diesel new registrations.
Total new registrations is equal to total installed base at year t+l minus total installed base at year t plus total discards. Total installed base at year t is the sum of diesel installed base and petrol installed base.
(3) Define payoff elements in Vensim's optimization function. Payoffs are the variables to fit. In this case, compare petrol new registrations to uploaded petrol new registrations, compare diesel installed base to uploaded diesel installed base, and compare petrol installed base to uploaded petrol installed base. Set 1 to the weight of each payoff element.
(4) Choose Diesel Sales Growth Rate prior to Polk, gp, for Vensim's optimizer to vary, along with the maximum search bound, 1, and the minimum bound, 0, for it.
(5) Run the optimization based upon least squares principles. The difference between the data and the model variable is multiplied by the weight specified and this product is then squared. This number is then subtracted from the payoff. The optimization process is to maximize the payoffs.
As a result, the optimized diesel growth rate prior to 1981 for France is 0.10, Germany 0.15, Italy
0.35, Spain 0.50, Sweden 0.15 and the UK 0.05. The diesel installed base in 1970 for France is
600,000, German 600,000, Sweden 40,000 and the UK 50,000. Italy and Spain do not have a diesel presence in 1970, so both are zero. Diesel new registrations prior to 1981 are calculated using the optimized growth rate and new registrations data in 1981.
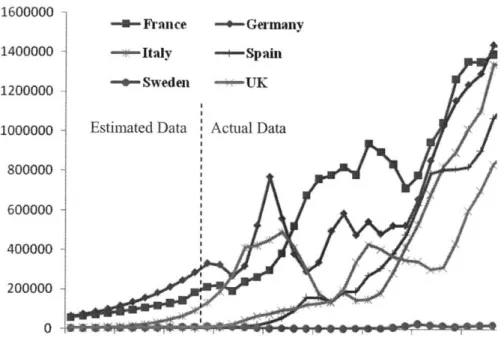
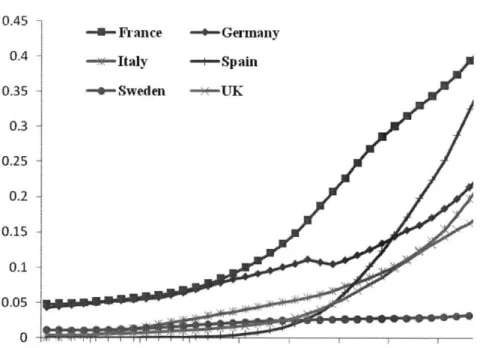
Figure 10 shows that Approach Two generates a smooth trend of diesel new registrations growth from 1970 to 2005. The estimated diesel share (diesel installed base divided by total installed base) in Figure 11 also follows the historical pattern pretty well (Figure 2). Therefore, the further analyses will use the synthetic data estimated by Approach Two.
160UUUUU 1400000 1200000 1000000 800000 600000 400000 200000 0
tlimated Data
:
ActualDataFigure 10 Diesel New Registrations - Actual Data and Estimated Data 1970 1973 1976 1979 1982 1985 1988 1991 1994 1997 2000 2003
0.45 -u-France --- Germany 0.4 0.35 0.3 0.25 0.2 0.15 0.1 0.05 0 1970 1973 1976 1979 1982 1985 1988 1991 1994 1997 2000 2003
Figure 11 Diesel Share Installed Base - Estimated Data
Chapter 4 Model Calibration Purpose of Calibration
SD practitioners build simulation models to learn how decision making and casual chains
generate problematic behaviors observed in the real world and to design solutions for solving problems. Modeling, a powerful tool of learning, is an iterative process of building confidence in the dynamic hypothesis (DH) -formulating the DH, building models, testing models and revising the DH. The purpose of model testing is not to show how successfully one model is able to pass various tests, but to discover the flaws and limits in the DH and the model structure, and improve the suitability of the model for the study purpose (Sterman 2000).
Many studies discuss a variety of tests on SD models (Forrester 1973, Forrester and Senge 1980, Barlas 1989, 1990, 1996, Sterman 2000). Among this wide range of tests, parameter assessment is the one most often receiving modelers' central attention. Parameters are variables with
constant values. The formation of parameters is grounded in real life meanings, whose values impact simulation outcomes.
Model calibration is the process of estimating model parameters by fitting model simulations to empirical data. Empirical data can be numerical data points or judgments grounded in the knowledge of real world practices. Calibration in SD models can be done by hand (Lyneis and Pugh 1996). However, the manual calibration is not feasible in situations where multiple parameters are to be estimated or multiple data series are to be fit. Popular SD software, such as Vensim, now provides automatic computation packages that enable the search for parameter values in a given space for a best fit of model outputs to empirical data. Based on optimization methods such as nonlinear least squares and Kalman filtering, the automated computation is able to handle nonlinear feedback in SD models. The automated computation for parameter estimation was used in Chapter 3 to restructure synthetic datasets. This chapter will apply this method for estimating social factor in the AVMT model.
The AVMT Model for Diesel Study
The focus of this study is to understand social factors involved in diesel diffusion. For this purpose, the study develops a simplified version of the AVMT model. The consumer consideration loops are isolated from the full AVMT model following partial model test principles (Homer 1983, 1996, 1997). The simplified model reduces treatments of the exogenous vehicle attractiveness loops by assigning fixed values to vehicle attributes. The network effects and other feedbacks are cut off. Figure 12 shows the elaborated loops for the diesel diffusion case. In the simplified AVMT model, consumers' transition from petrol to diesel is purely influenced by their social exposure to diesel and the diesel's attractiveness relative to petrol. Total social exposure to diesel consists of word of mouth from diesel drivers, word of mouth from non-diesel drivers and marketing program effects. Word of mouth effects are endogenous while marketing effects are exogenous. This simplified model is referred to as the AVMT consideration model in the following context.
Replacement
Word of Mouth from
Share of Purchase
of Diesel Perceived Utility
th from + of Diesel rivers Expected Utility of Diesel Consumers onsidering Diesel +
Figure 12 AVMT Consideration Loops
(Modified from Jeroen Struben's model)
R1 Word of Mouth from Diesel Drivers
Rla: The likelihood of consumer considering diesel grows once consumers become familiar with this platform. The greater likelihood that consumers will consider diesel, the higher the expected utility of diesel is, which determines the share of new purchases to diesel platform. The size of diesel installed base drives word of mouth effects from diesel drivers and thus the total social exposure to diesel contributing to familiarity gains. The accumulation of familiarity gains and loss determines the likelihood that consumer will consider diesel.
Rib: People's memory and attention to the diesel platform, adding another positive effect on familiarity. Marketing Diesel
\-1
WOMamon _ , ,.t . A atR2 Word of Mouth from Non-Diesel Drivers
R2a: The greater the familiarity with the platform, the more word of mouth effects among non-diesel drivers arise, which contributes to the total social exposure effects and familiarity gains.
R2b: An increasing word of mouth effect also prevents consumers' attention of the diesel platform from decaying, adding another positive effect on familiarity accumulation.
B Forgetting
Familiarity loss is conditioned by familiarity decay rate and familiarity level. The relationship between familiarity loss and social exposure is nonlinear. Familiarity fades rapidly with little social exposure. The decay rate will reduce as social exposure increases, and will reach zero when social exposure is really frequent.
Social Exposure and Vehicle Attributes
Struben and Sterman (2007) introduce the detailed formulation of consumer consideration. The following is a brief review of this structure modified to this diesel case. For simplicity, this analysis only considers the competition between platform petrol (p) and diesel (d). Consumers can choose from two platforms j = {p, d}. The vehicle installed base for diesel, Vd, is an accumulation of new vehicle sales, sd, less discards, dd.
dV
d
=
Sd- d(1)
dtConsumers can choose to switch between diesel and petrol platform when they purchase a new vehicle. Diesel new sales come from two resources - diesel drivers and drivers switched from petrol models. This model assumes that new vehicle sales are all replacement purchases, which is often seen in developed economics. Assume no population growth, s. = d = N.
where upd is the share of new purchases made by petrol drivers to diesel platform, and add is the share of diesel drivers continue purchase diesel vehicles. As an indicator of diesel transition,
apd is determined by the expected utility of diesel perceived by petrol drivers as a fraction of
total expected utility of platforms.
pd pd
(3)
Ud + Udd
The expected utility depends on two factors: familiarity and vehicle utility. As mentioned earlier, familiarity represents the likelihood that a platform will be considered by consumers. Vehicle utility depends on vehicle attributes of a platform perceived by drivers.
e • * (4)
upd = pd Upd
where Fpd is the familiarity of petrol drivers to diesel platform, and upd is diesel utility perceived by petrol drivers. Familiarity increases as social exposure increases and decays over time. Hence
dF
d = npd(1- Fpd) - pdFpd
(5)
Fpd = Fo when t
=
OHence npd is the effect of social exposure on petrol drivers' familiarity about diesel, and Ppd captures the fractional loss of familiarity about diesel among petrol drivers. Social exposure of petrol drivers to diesel consists of three elements: marketing effectiveness, word of mouth effects from diesel drivers, and word of mouth effects from petrol drivers. Hence
npd= ad + cpddFpd (Vd / N) + cpFpd(Vp / N) (6) where ad is the effectiveness of marketing efforts for diesel platform. Word of mouth effects from diesel drivers happen through contacts with diesel drivers. The possibility of meeting diesel drivers is (Vd IN). CPdd is the effective contact rate of petrol drivers with diesel drivers. The direct word of mouth effects from diesel drivers are captured in cpddFpd(Vd / N). Besides, word of mouth effects can also come from petrol drivers who see diesels on the road, and meet and
discuss the platform with fellow petrol drivers. CpdpFpd (V / N) represents the indirect word of mouth effects from petrol drivers.
Aside from familiarity, diesel utility (perceived by consumers), upd, is another variable shaping consumer choice. upd is conditioned by the availability of vehicle models and the attractiveness of vehicle attributes (Figure 13). The diesel portfolio measures the number of diesel vehicle models available on the market. Vehicle attributes consist of vehicle price, vehicle performance, fuel availability, operation cost and diesel technology effect. Vehicle price takes registration tax into account. Operation cost include the effect of fuel cost, maintenance cost and ownership tax. Diesel technology effect captures the dummy factors that are not modeled explicitly.
Sensitivity of perceived diesel utility to vehicle attributes measures how consumers' perception of diesel changes with changes in price (diesel price and operation cost), performance (diesel performance and fuel efficiency), convenience (fuel availability), choice (diesel portfolio), and other factors (diesel technology effect). Though individual sensitivity to these factors may vary due to numerical reasons, the average sensitivity of a group of people is often prejudiced by common views. Because of the close cultural and economic connections between the six European countries, the AVMT consideration model assumes the sensitivities to price, performance, convenience and choice are the same across countries. However, the diesel technology effect, a parameter measuring dummy factors that impact consumers' choice, is country specific so that the difference between countries, if any, is still captured in the model. Table 2 includes the descriptions and values set for each vehicle attribute using Italy as an example.
Vehicle Price
Vehicle Performance
+
Fuel Availability Fuel Efficiency
Effect of Attribute + on Utility
+ Operation Cost-4--Fuel Cost4-- Fuel Price Jtility el + Vehicle Miles Diesel Effect ffect of Portfolio on Utility ~" 'q 'Diesel Portfolio
Figure 13 Perceived Utility of Diesel Platform conditioned by Vehicle Attributes
Table 2 Vehicle Attributes - Italy
Vehicle Price Vehicle Performance Fuel Efficiency Fuel Price Vehicle Portfolio Fuel Availability Other Operation Cost Taxes Petrol 18650 1 10 1.12 300 1980 Diesel 17150 0.786 12 0.522 59 2005 Petrol Diesel 18650 17150 1 1 10 12 1.35 1.12 710 262 Description $Ivehicle dimensionless kilometers/liter $/liter models dimensionless $/year
Assumed fixd on typical 2002 model (Peugeot 307) including tax Assumed that diesel closes gap with petrol linearly; diesel 0.7 in 1970 Assumed diesel is 20% more efficient than petrol
Data awailable
Data available
Partly captured in diesel technology effect Partly captured in diesel technology effet Included in vehicle and fuel prices
As demonstrated, the effective contact rate with diesel drivers Cpdd, effective contact rate with petrol drivers Cp as well as marketing effectiveness ad determines a consumer's purchase
decision via the magnitude of their social exposure to diesel. The larger the values of these
parameters, the more likely that the consumers will include diesel in their consideration set and Perceived I of Dies E Level Country Uniform Uniform Country Country Uniform Uniform Country
contribute to the diesel market share by switching from petrol to diesel. Since the three parameters play a key role in consumer considerations, their influence on simulated model outcome deserves a detailed calibration. The three variables are referred to as social exposure parameters in the following context.
Calibration of Social Exposure Parameters
The purpose of this calibration is to search for the optimum value for three social exposure parameters -marketing effectiveness a , effective contact rate with diesel drivers Cd, effective contact rate with petrol drivers C, by fitting model output to actual data (the subscript is simplified for clarity). The three social exposure parameters are estimated by minimizing the
A
sum of squared errors between actual diesel sales data st and sales diesel model output st
36 Min ~C (t -s, )2 (7) a,cd ,cp ,Fo,f t=l subject to 0 _a • 0.1 0 Cd < c 0 c, I 0o• F, 0.2 -5 f 5
The vehicle markets of the six European countries are highly connected in terms of the similarity of automotive models produced and the mobility of drivers. Therefore, effective contact rates with diesel drivers Cd and petrol drivers C, are assumed to be same across countries. Marketing effectiveness a is bound by country borders because of the local nature of marketing channels and language barriers. The calibration also includes the initial familiarity Fo to reflect the starting familiarity level in the simulation. In addition, the sensitivity of utility to diesel technology f is calibrated together for the purpose of exploring dummy factors that are
contributed to the diesel utility.
Four calibrations are designed to estimate values of these four parameters using AVMT consideration model.
Calibration One: Base Scenario (BASE)
(1) Use initial diesel installed base at 1970 derived in Chapter 3 and total vehicle installed base data as model inputs.
(2) Match the model output, sales diesel model, with diesel new registrations from 1970 to 2005, a combination of synthetic and real data derived in Chapter 3.
(3) Search for best fit values for four social exposure parameters - effective contact rate drivers, effective contact rate non-drivers, marketing effective and initial familiarity with diesel, and one vehicle attribute parameter - sensitivity of utility to diesel effect. As discussed earlier, marketing effective and initial familiarity are country specific parameters while the others are the same across the six countries. Use the Vensim optimization function to conduct the automated search.
Calibration Two: Base Scenario with Country Specific Diesel Effect (BASE DEC) (1) Same as (1) of Calibration One.
(2) Same as (2) of Calibration One.
(3) Estimate same parameters as (3) of Calibration One. Except for marketing effectiveness and initial familiarity, the sensitivity of utility to diesel effect is also country specific.
Calibration Three: New Registrations (NVR)
(1) Use initial diesel installed base data derived from Chapter 3, and total new registrations data as model inputs.
(2) Same as (2) of Calibration One. (3) Same as (3) of Calibration One.
Calibration Four: New Registrations with Country Specific Diesel Effect (NVR DEC) (1) Same as (1) of Calibration Three.
(2) Same as (2) of Calibration One.
(3) Estimate same parameters as (3) of Calibration One. The sensitivity of utility to diesel
effect is country specific as well as marketing effectiveness and initial familiarity.
Further, in order to compare AVMT consideration model to the Bass diffusion model in terms of diffusion behavior and parameter value, one scenario is designed to calibrate Bass model to diesel data. Table 3 summaries the four AVMT calibrations as well as the Bass model calibration.
Calibration Five: BASS
(1) Same as (1) of Calibration One.
(2) Fit sales diesel in the Bass model with diesel new registrations data from 1970 to 2004.
(3) Estimate effective contact rate with drivers and marketing effectiveness.
Table 3 Calibration Scenarios
BASS Base Base DEC Base NVR Base DEC NVR
Scalar Parameter Contact Rate Drivers Contact Rate Drivers Contact Rate Drivers Contact Rate Driwrs Contact Rate Drivers Contact Rate Non-Drivers Contact Rate Non-Drivers Contact Rate Non-Drivers Contact Rate Non-Drivers
Diesel Effect Diesel Effect
Country Specific Parameter Marketing Effectiheness Marketing Effectiveness Marketing Effectiveness Marketing Effectiveness Marketing Effectiveness
Initial Familiarity with Diesel Initial Familiarity with Diesel Initial Familiarity with Diesel Initial Familiarity with Diesel
Diesel Effect Diesel Effect
Data Input Total Installed Base Total Installed Base Total Installed Base Total New Registrations Total New Registrations Initial Diesel Installed Base Initial Diesel Installed Base Initial Diesel Installed Base Initial Diesel Installed Base Initial Diesel Installed Base Calibration Data Diesel New Registrations Diesel New Registrations Diesel New Registrations Diesel New Registrations Diesel New Registrations
Model Output Sales Diesel Bass Sales Diesel Model Sales Diesel Model Sales Diesel Model Sales Diesel Model
Behavior Reproduction Tests
As commonly used tools for model testing, behavior reproduction tests can assess a model's ability to reproduce certain behaviors observed in reality. Based upon qualitative observations and point-to point statistics measures, behavior reproduction tests compare the AVMT consideration model to the BASS model in terms of their ability to reproduce diesel diffusion patterns, as well as compare the replicating abilities of the four calibrations of the AFV consideration model. Figure 14 shows the best fit simulation results of each calibration scenarios.
Figure 14 indicates that BASS model lags behind the diesel sales trend after the first twenty years of simulation for France, Germany and Italy, and thirty years for the UK. In particular, the
BASS model performs poorly on data for Sweden, whose diesel diffusion has low penetration and sharp inflections. The BASS model also consistently over-predicts the diesel share for all of the six European countries.
As a comparison, the Base calibration of the AVMT consideration model is capable of replicating the diesel sales trend for all the six countries. Though the amplitude of the simulated sales is less fluctuating than actual data in countries like Italy and UK, this mismatch is not substantial considering the fact that the model smoothes out noises in a short time frame. The AVMT consideration model generally performs much better than BASS model in reproducing various diesel diffusion patterns, not matter whether is a successful case (France, Germany, Italy, Spain and UK), or a failed case (Sweden).
Aside from intuitive observations, this study uses common statistical metrics- R2, MAE, MAPE, MSE/RMSE and Theil's Inequality Statistics - to interpret the model fit. R2, the most commonly used measure of model fit, is the square of the correlation coefficient between model and data series. R2 is equal to one when the model exactly replicates the actual data series while zero means the model output is constant. MAE, the mean absolute error, MAPE, the mean absolute percent error, MAE/Mean, mean absolute error as a percent of the mean, and MSE/RMSE (root MSE) all measure the average error between the model output and actual data. Theil (Theil 1966) introduces "inequality statistics" to measure three components of MSE: bias (Um), unequal variation (Us) and unequal covariation (Uc). A Um reveals that a model has a systematic error in matching average output to data series. A Us indicates that the model output has a different trend to data trend. A Uc represents the error concentrating on unsystematic point-to-point difference. The sum of Um, Us and Uc is equal to one. Sterman (2000) interprets the Theil statistics for different situations.
France "---BASE 1,600,000 BASE -- BASE DEC . 1,400,000 , 1,200,000 ~ 1,000,000 S800,000 • 600,000 > 400,000 Z 200,000 .* 0 1970 1974 1978 1982 1.986 1990 1994 1998 2002 Germany France - BASE -BASE DEC NVR 1970 1974 1978 1982 1986 1990 1994 1998 2002 Germany -BASE 2,000,000 BASE ,00 ---BASE DEC S 1,800,000 . . ED 1,600,000 * ,1,400,000 ~1 1,200,000 S'~1,000,000 - 800,000 * 600,000 400,000 ,, 200 ,00 0 -BASE 0.5 - BASE 04 - BASE DEC 0.4 0.3 0.3 0.2 0.2 0.1 0.1 1970 1974 1978 1982 1986 1990 1994 1998 2002 Italy 0.0 1970 1974 1978 1982 1986 1990 1994 1998 2002 Italy 1,600,000 - BASE --*"-BASE DEC S ,4U00,000 UU 1,200,000 41,000,000 800,000 " 600,000 - 400,000 200,000 a0 0.4- BASE -BASE DEC 0.3 - -NVD 1970 1974 1978 1982 1986 1990 1994 1998 2002 0.3 0.2 0.2 0.1 0.1 0.0 1970 1974 1978 1982 1986 1990 1994 1998 2002
Figure 14 Diesel Diffusion Pattern Reproduction - France, Germany and Italy 0
I 1
u
Spain 0.4 Spain -BASE - BASE DEC 1970 1974 1978 1982 1986 1990 1994 1998 2002 Sweden -BASE m R A Q n IUf 0.4 0.3 0.3 0.2 0.2 0.1 0.1 0.0 1970 1974 1978 1982 1986 1990 1994 1998 2002 Sweden 120,000 -- BASE 0, I-0.4 0.4 100,000 80,000 S60,000 , 40,000 20,000 0 1970 1974 1978 1982 1986 1990 1994 1998 2002 UK - BASE - BASE DEC 1LTr rnm 0.3 0.3 0.2 0.2 0.1 0.1 0.0 1970 1974 1978 1982 1986 1990 1994 1998 2002 UK 0.3 -BASE -RAQRV nFr 0.2 0.2 0.1 0.1 .. - BASE 1,200,000 1,000,000 S800,000 S600,000 o 400,000 200,000 1970 1974 1978 1982 1986 1990 1994 1998 2002 1970 1974 1978 1982 1986
Figure 15 Diesel Diffusion Pattern Reproduction - Spain, Sweden and UK
1990 1994 1998 2002 1,400,000 1,200,000 1,000,000 S800,000 600,000 400,000 200,000
Table 4 lists the results of statistics measures for BASS model, and the four calibrations of AVMT consideration model. The BASS model presents poorly on all the indicators of average error - MSE, RMSE and MAE/MEAN. The big Us (0.198) and Uc (0.802) indicates that the errors of BASS model concentrate on unequal variations between model output and data, and on unequal covariance due to mismatch at point-by-point fit, e.g. France. On the contrary, all the four calibration scenarios of the AVMT consideration model have much smaller values of MSE, RMSE and MAE/MEAN and larger values of R2, all of which suggest a better fit to the empirical data. All the four scenarios have zero or close to zero Um value, and small Us value. With a close to zero Um and a small Us, the majority of MSE error is on unequal covariance, which is not a systematic error.
A high Us value may suggests that the errors may be due to problems in model structure (Sterman 2000). The high value of unequal variation indicates that the BASS model has structure difficulties in modeling diesel diffusion. This implies the importance of social exposure parameters and familiarity in capturing key behavior patterns of diesel diffusion.
Among the four calibration scenarios of AVMT familiarity model, country specific scenarios perform much better than corresponding non-country specific ones (Base vs. Base DEC, and NVR vs. NVR DEC) through higher R2 values and lower MSE, RMSE and MAE/MEAN values. The better performance of country specific models suggests that more country specific data, such as vehicle attributes, can potentially improve statistic results.
Table 4 Behavior Reproduction Tests
BASS BASE BASE DEC NVR NVR DEC Units
Basic Report
Scalar Parameters 1 3 2 3 2
-Country Specific Parameters 1 2 3 2 3
Number of Countries 6 6 6 6 6
-Nunmber of Fitted Coefficients 7 15 20 15 20
Number of Sinulations >1,000,000 >1,000,000 >1,000,000 >1,000,000 >1,000,000
Mean Absolute Error Fraction MAE/MEAN 0.319 0.188 0.189 0.189 0.192 dimnensionless
Mean Square Error (MSE) 2.18E+10 9.07E+09 8.46E+09 9.64E+09 8.51E+09 (vehicles/year)^2 Root Mean Square Error (RMSE) 1.48E+05 9.52E+04 9.20E+04 9.82E+04 9.23E+04 vehicles/year
Adjusted R2 0.848 0.934 0.937 0.930 0.937 dimensionless
Theil Statistics
Umr- bias 0.000 0.000 0.002 0.001 0.000 dimensionless
Us - unequal variance 0.198 0.042 0.029 0.012 0.040 dimensionless
Uc - unequal covariance 0.802 0.957 0.973 0.987 0.960 dimensionless
Calibration Results: Social Exposure Parameters
Multiple calibrations estimate the value of social exposure parameters (Figure 16). The dot line represents the parameter values used by Struben (2006) which are from the literatures or assumptions. The calibration results suggest that the optimized value of marketing effectiveness is in line with values that are used by Struben. The effective contact rate with non-drivers is higher than the initial assumption of 0.15 while effective contact rate with diesel drivers tend to be smaller than initial value of 0.25. Initial familiarity matches with market situations in 1970 when diesel had already presented in German market while Spain and UK just started to learn about diesel platform. The calibrated social exposure parameter values are generally in line with original assumptions and further increase their numerical accuracy.