DOI 10.1140/epja/i2005-10146-7
T
HE
E
UROPEAN
P
HYSICAL
J
OURNAL
A
Nuclear mass form factors from coherent photoproduction of
π
0
mesons
B. Kruschea
Department of Physics and Astronomy, University of Basel, CH-4056 Basel, Switzerland Received: 4 July 2005 /
Published online: 11 October 2005 – c°Societ`a Italiana di Fisica / Springer-Verlag 2005 Communicated by Th. Walcher
Abstract. Data for coherent photoproduction of π0
mesons from nuclei (12 C,40
Ca,93
Nb,natPb), recently measured with the TAPS detector at the Mainz MAMI accelerator, have been analyzed in view of the mass form factors of the nuclei. The form factors have been extracted in plane-wave approximation of the A(γ, π0
)A reaction and corrected for final-state interaction effects with the help of distorted-wave impulse approximations. Nuclear mass rms radii have been calculated from the slope of the form factors for q2
→ 0. Furthermore, the Helm model (hard-sphere form factor folded with Gaussian) was used to extract diffraction radii from the zeroes of the form factor and skin thicknesses from the position and height of its first maximum. The diffraction radii from the Helm model agree with the corresponding charge radii obtained from electron scattering experiments within their uncertainties of a few per cent. The rms radii from the slope of the form factors are systematically lower by up to 5% for PWIA and up to 10% for DWIA. Also the skin thicknesses extracted from the Helm model are systematically smaller than their charge counterparts.
PACS. 13.60.Le Meson production – 25.20.Lj Photoproduction reactions – 21.10.Gv Mass and neutron distributions
1 Introduction
Charge and matter densities are among the most funda-mental properties of atomic nuclei. Nuclear charge dis-tributions have been intensively studied with elastic elec-tron scattering and via the spectroscopy of X-rays from muonic atoms (see, e.g., [1–4]). These experiments profit from the full understanding of the electromagnetic inter-action. Analyses of the distributions in the frameworks of different models have extracted characteristic parameters like charge radii, skin thicknesses, or the central depression of the charge density with high precision [5, 6]. However, all these properties are only related to the distribution of the protons in the nucleus. The electromagnetic interac-tion provides only very limited informainterac-tion on the neu-tron. Therefore, the extraction of neutron distributions, respectively nuclear matter distributions (i.e. the sum of proton and neutron density) is much less straightforward. Some results for specific single neutron orbits have been obtained with elastic magnetic electron scattering, mak-ing use of the magnetic form factor of the neutron [7, 8]. However, most experimental methods use hadron-induced reactions such as, for example, α, proton, pion or kaon scattering from nuclei. The analysis of such reactions
re-a
e-mail: Bernd.Krusche@unibas.ch
quires scattering theories for strongly interacting particles, with all their uncertainties. An overview over the different methods can be found in [9]. The situation is such that a systematic analysis of the nuclear matter distributions is still missing and in many cases the spread between the results obtained with different probes is still larger than the predicted differences in the proton and neutron distri-butions, which are on the order of 0.05 fm–0.2 fm for the rms radii of heavy nuclei [10].
The present paper summarizes the analysis of recent experimental results for the coherent photoproduction of π0 mesons [11] in view of nuclear matter distributions. This reaction is particularly attractive as a complemen-tary method for the study of nuclear matter distributions of stable nuclei. As discussed below, in the energy re-gion of interest, protons and neutrons contribute identi-cally with the same amplitude. Furthermore, in contrast to hadron-induced reactions it is not restricted to the nuclear surface but probes the entire nuclear volume. In this sense it is the ideal reaction to test the matter distribution in the bulk of a nucleus. A first attempt to determine nuclear mass radii with this method was made by Schrack, Leiss and Penner in 1962 [12]. However, at that time the achiev-able experimental precision was very limited and much in-ferior to the results from hadron-induced reactions which
8 The European Physical Journal A profit from the large cross-sections characteristic for the
strong interaction. Subsequently, an attempt was made to measure nuclear matter radii via the coherent photopro-duction of ρ0 mesons [13]. However, due to the experi-mental difficulties and the previously not well-developed theoretical tools for the extraction of the form factors from coherent photoproduction reactions, the method was never systematically explored. On the experimental side the progress made in accelerator and detector technology during the last fifteen years has considerably enhanced our possibilities for the study of photon-induced meson production reactions. In particular, the new generation of quasi continuous beam electron accelerators like CEBAF in Newport News, ELSA in Bonn, ESRF in Grenoble, MAMI in Mainz and SPring8 in Osaka are all equipped with state-of-the-art tagged photon facilities and highly ef-ficient detector systems, most of them with almost 4π solid angle coverage. Profiting from this developments, recently much more precise cross-section measurements for coher-ent π0 photoproduction from carbon, calcium, niobium and lead nuclei became available [11]. At the same time, progress was also made in the theoretical understanding of these reactions. Modern calculations treating the elemen-tary process in the framework of unielemen-tary isobar models, in-corporating final-state interaction (FSI) in distorted-wave impulse approximation, and including in-medium effects of the ∆-isobar with phenomenological self-energies have become available [14]. The purpose of this paper is thus to explore the currently achievable accuracy in the de-termination of the nuclear mass distributions from coher-ent π0 photoproduction. This is also done in view of the possibility of further improvements in the data quality. Although the data from [11], which are the basis of the present analysis, are the most precise results for coher-ent π0-photoproduction from heavy nuclei available so far, they have been measured with an early stage of the TAPS detector [15, 16] covering only ≈ 20% of 4π. This resulted in typical detection efficiencies for π0mesons on the order of only a few per cent and an imperfect suppression of inco-herent contributions from excited nuclear states. With the availability of 4π detector systems like the combined Crys-tal Ball/TAPS setup, operating now at the MAMI acceler-ator, more precise data will become available in the future. In this paper, we will limit the discussion of the mass distributions to the extraction of rms radii from the slope of the form factors and to the extraction of diffraction radii and surface extensions in the Helm model. How-ever, the analysis of the full matter distributions in the same model-independent way as for the charge distribu-tions should become feasible for the next generation of experiments.
2 Coherent π
0photoproduction from nuclei
Coherent photoproduction of π0-mesons from a nucleus with mass number A is the reaction
γ + A(gs) → A(gs) + π0, (1)
where A(gs) is a nucleus in its ground state. It can be experimentally separated from breakup processes, where nucleons are removed from the nucleus, via its charac-teristic two-body kinematics [11]. The theoretical treat-ment is much more straightforward than for incoherent pion production reactions, since for initial and final state only ground-state properties of the nucleus are needed.
In general, the isospin structure of the elementary pro-cess of π0 photoproduction from the nucleon is given by
A(γp → π0p) = +r 2 3 A V 3+r 1 3(A IV − AIS) , (2) A(γn → π0n) = +r 2 3 A V 3+r 1 3(A IV + AIS) , where AIS, AIV, and AV 3are the isoscalar, isovector, and total isospin changing parts of the total amplitude. How-ever, at incident photon energies in the range of interest in this work (200–350 MeV) the reaction is completely dominated by the photo excitation of the ∆(1232) reso-nance (see, e.g., [17]). Since this is an isospin I = 3/2 state, only the isospin changing vector component AV 3 can contribute, so that for the ∆ excitation
A(γp → π0p) = A(γn → π0n) . (3) Detailed investigations of coherent and breakup photo-production of π0 mesons from the deuteron [17–19] have confirmed that the elementary cross-sections for protons and neutrons are equal. This means that apart from small background contributions (nucleon Born terms) protons and neutrons contribute with the same amplitude to co-herent π0 photoproduction from nuclei, so that this re-action is indeed sensitive to the distribution of nucleons rather than to the distribution of charge in the nucleus.
In the simplest plane-wave impulse approximation (PWIA) the coherent cross-section from spin-zero nuclei can be written as [14, 11] dσP W IA dΩ (Eγ, Θπ) = s m2 N A2dσN S dΩ? (E ? γ, Θπ?)F2(q) , (4) dσN S dΩ? (E ? γ, Θπ?) = 1 2 q? π k?|F2(E ? γ, Θ?π)|2sin2(Θπ?), (5) where Eγ and Θπ are incident photon energy and pion polar angle in the photon-nucleus cm-system, mN is the nucleon mass, q(Eγ, θπ) the momentum transfer to the nucleus, and F (q) the nuclear mass form factor. The to-tal energy √s of the photon-nucleon pair, the photon en-ergy and momentum E?
γ, k?, and the pion angle and mo-mentum Θ?
π, qπ? in the photon-nucleon cm-system can be evaluated from the average momentum pN of the nucleon in the factorization approximation pN = q(A − 1)/2A. The spin-independent elementary cross-section dσN S/dΩ is calculated from the isospin average (for I 6= 0 nuclei weighted with N , Z) of the standard Chew-Goldberger-Low-Nambu (CGLN) amplitude F2 [20] taken from [21]. The extraction of the form factor F (q) from the differen-tial cross-sections in this approximation is straightforward
Eγ[MeV] C Ca Pb 0 10 20 30 40 200 300 σ/A [µ b] 0 5 10 15 20 25 200 300 0 2 4 6 8 10 12 200 300
Fig. 1. Total cross-section for coherent π0
photoproduction from carbon, calcium and lead [11] compared to the model results from [14].
and used below for a first approximative determination of the mass radii.
It is well known that final-state interaction effects can have a significant impact on the pion production cross-sections. The available model calculations have been compared to the measured differential cross-sections in [11]. The distorted-wave impulse approximation in mo-mentum space with additional ∆ in-medium effects by Drechsel et al. [14] gave the best agreement with the data. The results from this model are therefore used in the present work for the correction of FSI effects in the extraction of the nuclear form factor. It should be em-phasized that the model [14] was not adjusted to the nu-clear data under discussion. The free parameters for the ∆-nucleus phenomenological self-energy were fitted to co-herent π0 photoproduction from 4He and not modified for the heavy nuclei. The typical agreement between data and model results for the total cross-sections is shown in fig. 1. It is quite good for carbon and calcium, but less so for lead. However, also for lead important features for this analysis, like the position of the diffraction minima, are very well reproduced (see [11] for a detailed discus-sion). For the present analysis of form factors only the relative shifts of the position of the minima and cross-section ratios between the PWIA calculation and the full model from [14] are used. Such calculations are presently not available for the nucleus 93Nb. However, the correc-tions for the shift of the minima and the slope at small q can be approximated from lead by normalizing the po-sition of the first diffraction minimum. Strictly speaking, also the above PWIA approximation for spin-zero nuclei is not valid for this J = 9/2 odd-even nucleus. However, since it was shown in [11] that the measured cross-sections scale in the same way as for the spin-zero nuclei (the con-tribution from the odd nucleon is not significant) we have kept it in the analysis. The systematic uncertainty is of course larger than for the other nuclei.
An example for the influence of FSI on the angular distribution from lead1 for an incident photon energy of 290 MeV is shown in fig. 2, where the PWIA and DWIA
1
Note: differential cross-sections dσ/dΩ are given as a func-tion of q throughout this paper, which for fixed Eγis a unique function of θπ. This has the advantage that the position of the diffraction minima is approximately independent of Eγ.
10 -6 10 -5 10 -4 10 -3 10 -2 10 -1 1 10 0 0.5 1 1.5 2 2.5
1.
2.
3.
4.
5.
PWIA (Kamalov) DWIA (Kamalov)q[fm
-1]
dσ
/d
Ω
[mb/sr
]
Fig. 2. PWIA and DWIA calculations for coherent π0 photo-production from lead for an incident photon energy of Eγ = 290 MeV [14, 11]. The shift of the diffraction minima due to FSI is indicated.
calculations for the differential cross-section are plotted versus the momentum transfer to the nucleus. The main effects at these incident photon energies are a reduction of the plane-wave cross-section and a shift of the position of the diffraction minima due to the pion-nucleus poten-tial. The latter is more pronounced for the higher-order maxima.
For the interpretation of the form factor results it is of interest if final-state interaction effects, in particular pion absorption, are so strong that like in hadron-induced reactions effectively only the nuclear surface is tested.
An indication for the strength of these effects can be obtained from the scaling of the cross-sections with mass number in a similar way as in [22, 23] for inco-herent meson production (π, η) from nuclei. The duction cross-sections without FSI for incoherent pro-cesses scale with the number of nucleons A. The measured cross-sections scale like A2/3, which implies strong FSI corresponding to a small mean free path of the mesons so that effectively only the nuclear surface contributes. The cross-section for coherent π0 production in plane-wave without FSI scales like A2, since the amplitude is proportional to A. If only the surface contributed, one would expect a scaling with A4/3. The observed scaling for the total coherent cross-section does not even reach A2/3 [24]. However, one must take into account the influ-ence of the sin2(Θ)F2(q) term in the PWIA cross-section, which contributes to the A-dependence of the total cross-section (see eq. (5)). The nuclear form factor at q nor-malized to the position of the first diffraction minimum, q = q1(A), is almost independent of A in the region before the first diffraction minimum (see fig. 5). Consequently, the mass number scaling of the coherent cross-sections can
10 The European Physical Journal A
10 -1
10 102
R
PWIA
atomic mass number A
E
γ[MeV]
1 1.5 2 200 225 250 275 300 325α
Fig. 3. Upper part: A-dependence of RP W IA at q = 0.5q1 for incident photon energies of 210, 230, 255, 280, and 305 MeV (from top to bottom). Lower part: fitted coefficients α of the mass dependence.
be obtained by fitting the ratio RP W IA (see eq. (7)) at a constant value of q/q1< 1 with the ansatz
RP W IA(A) ∝ Aα−2. (6) The result for q = q1(A)/2 (i.e. approximately in the 0th maximum2 of the differential cross-section) is shown in fig. 3. At the lowest investigated incident photon energies around 200 MeV the scaling is very close to A2, indicat-ing almost negligible pion absorption. At higher incident photon energies FSI effects become more important.
3 Extraction of mass radii
3.1 rms radii
The determination of the root-mean-square (rms) radii requires the extraction of the nuclear form factor F (q2) from the angular distributions. This is done in three steps as demonstrated in fig. 4 for40Ca for one range of incident
2
Note: the maxima of the differential cross-section are la-beled 0, 1, 2, . . . , the maxima of the form factor 1, 2, 3, . . . . In both cases maximum 1 follows the first diffraction minimum.
10-1 1 10-1
F(q
2)
1 10 10-1dσ
/d
Ω
*[µ
b/sr
]
dσ/dΩ F(q2) PWIA F(q2) PWIA, cor. F(q2) DWIA 40Ca
E
γ=200 - 245 MeV
q
2[fm
-2]
Fig. 4. Extraction of the nuclear form factor for40
Ca. Trian-gles: measured differential cross-section (axis labeling on the right-hand side). Open circles: PWIA approximation of form factor from eqs. (4), (5). Filled circles: PWIA approximation after correction of angular resolution effects. Filled squares: after correction of FSI effects (DWIA approximation).
photon energy. In the first step the form factor is extracted from the data in plane-wave approximation, i.e. all FSI effects are neglected. This is done in the same way as in [11]3 using F2(q)¯ ¯ P W IA= RP W IA= µ dσexp dΩ ¶ / · s m2 N A2µ dσN S dΩ? ¶¸ (7) with dσN S/dΩ? from eq. (5).
In the next step a correction is applied for the finite angular resolution of the experiment. It was determined with Monte Carlo simulations that the detector response for π0 mesons in the kinematical regime of interest corre-sponds to a Gaussian with a FWHM of 4◦for the pion cm angles. The DWIA model calculation was folded with this response function and the data were corrected with the ratio of folded and unfolded calculation. This correction is only significant for niobium and lead.
In the final step the ratio of PWIA and DWIA cross-sections obtained from the model calculations is used to correct the form factor for FSI effects. The q-dependence (not the absolute values) of the PWIA and DWIA calculations is in most cases similar for small
3
Note: eq. (7) is applied to the data in the finest possible binning of incident photon energies, defined by the resolution of the tagging spectrometer (roughly 2 MeV). The corresponding form factor results are then averaged over larger energy regions for statistical reasons.
q, nevertheless this correction introduces an additional model dependence into the analysis. We have therefore extracted the mass radii from the form factors with and without this correction in order to get an estimate for the systematic uncertainties.
Once the form factor has been determined, the rms ra-dius can be extracted without further model assumptions from the slope of the form factor for q2→ 0 via
F (q2) = 1 − q 2
6r 2
rms+ O(q4), (8) which is done in the usual way by fitting a polynomial,
F (q2) = N X n=0
(−1)nanq2n, (9) to the data. The rms radius is then given by
rrms=p6a1/a0, (10) where for a correctly determined form factor a0 should be unity. This is of course not true for the form factors extracted in PWIA approximation without correction for FSI effects. However, also the form factors extracted in DWIA approximation differ in most cases somewhat from F (q2) → 1 for q2 → 0 (see figs. 6, 7). This can be due to systematic uncertainties in the absolute normalization of the measured cross-sections (up to 10% overall, up to 3% relative between different nuclei, see ref. [11]) or due to an imperfect correction of the FSI effects (systematic uncertainties in the models). Therefore a0 is kept free in all fits to account for these effects.
A final remark must be made to the comparison of the mass form factors, extracted in this way, to the nuclear charge form factors. In the latter case the charge distribu-tion of the nuclei is tested. Due to the charge form factor of the proton the distribution of (point-like) protons Fpc in the nucleus is given by
Fpc(q) = Fch(q) Fch
p (q)
, (11)
where Fch is the nuclear charge form factor and Fch p is the charge form factor of the proton for which we take the dipole form factor
Fpch= µ 1 + q 2 18.234 fm−2 ¶−2 . (12)
On the other hand, coherent pion production, which pro-ceeds through the excitation of the nucleon to the ∆ res-onance, is testing the distribution of point-like nucleons in the nucleus. Therefore, for the comparison of the mass and charge radii the rms charge radius rp
rms= 0.862 fm of the proton was subtracted in quadrature from the nuclear charge rms radii rch
rms to give the rms radius rrmspc for the distribution of point-like protons,
rpc rms= q (rch rms)2− (r p rms)2 . (13) For the comparison of skin thicknesses the charge form factors were divided by the proton charge form factor.
3.2 Form factors in the Helm model
The extraction of the rms radii from the slope of the form factor has the advantage that no model of the form fac-tor itself is needed. However, models of the form facfac-tor which relate, for example, the radii to the position of the diffraction minima allow a much better control of system-atic effects like the DWIA corrections. Furthermore, addi-tional information can be gained from such models. The rms radius alone has, for example, no information about the extension of the surface zone of the nuclei. A good ex-ample are the charge rms radii of40Ca and48Ca, which are almost identical. However, the actual charge distributions are by no means identical. The nucleus48Ca has a larger core region of almost constant density but a smaller sur-face region, where the density drops from 90% to 10% [5]. For the model-dependent analysis it is convenient to use Helm’s model, which is known from the analysis of elec-tron scattering data (see [5, 6]) and allows to extract nu-clear extension parameters in a transparent way. In this model the nuclear density is parameterized [5] by the con-volution of a hard-sphere distribution with a Gaussian. The form factor FH is then simply given by the product of the form factor of the hard sphere, Fhs, with that of the Gaussian, which, again is a Gaussian, FG:
FH = FG· Fhs, (14) FG= exp(−(qσ)2/2) , (15) Fhs= 3 (qRd)2 µ sin(qRd) qRd − cos(qRd ) ¶ = 3 qRd j1(qRd) . (16) Here, q is the momentum transfer and j1 the first-order spherical Bessel function. Rd is the so-called “diffraction minimum sharp radius” (dms radius) and the width of the Gaussian σ is approximately related to the 10%-to-90% surface width tH via
tH = 2.54σ . (17) In this model, the zeroes of the form factor are deter-mined by the zeroes of the Bessel function, which implies a straightforward relation between the dms radius and the momentum transfers qi, i = 1, 2, 3, . . . in the i-th mini-mum of the form factor. The rms radius, which integrates over the core region and the surface zone, is then related to the dms radius and the σ of the distribution by
rrms= r 3 5Rd à 1 + 5µ σ Rd ¶2!1/2 . (18) The σ of the Gaussian can be extracted, e.g., from the position qmof the first maximum (i.e. the maximum after the first minimum) of the form factor and its magnitude F (qm) via [5] σ2= 2 q2 m ln 3j1(qmRd) qmRdF (qm) . (19)
The comparison of the dms mass radii to the dms charge radii from electron scattering requires no correc-tion for the proton charge radius since multiplicacorrec-tion of
12 The European Physical Journal A the form factor eq. (14) with the proton dipole form
fac-tor has no influence on the position of the zeroes, which are still determined by the Bessel function. This is not the case for the width of the Gaussian which is expected to be larger in case of the charge form factor due to the contribution of the proton charge form factor.
4 Results
In the following we will discuss the form factors extracted for12C,40Ca,93Nb andnatPb4 from the pion production data. We will first discuss the overall features of the mass form factors (without DWIA corrections). In the second subsection we discuss the extraction of root-mean-square radii from the slope of the form factors and in the final subsection the interpretation of the form factors in the framework of the Helm model.
4.1 Form factors in PWIA
The form factors have been extracted in PWIA approx-imation from the cross-section data for incident photon energies from 240–300 MeV with eqs. (4), (5), (7). At this stage only the overall normalization was corrected for DWIA effects. For this purpose the form factors were fitted at low momenta with the Taylor series eq. (9) and the data were divided by the fitted a0coefficient. The re-sults are summarized in fig. 5, where the form factors are plotted versus qRd which is calculated as
qRd(A) = q · X1/q1(A) , (20) where q1(A) is the momentum transfer in the first diffrac-tion minimum and X1= 4.495 is the first zero of the Bessel function. In this plot the positions of all diffraction minima fall on top, as one would expect as long as the Helm model is valid, and even more the form factors for Ca, Nb and Pb are almost identical and agree up to the first diffraction minimum with the form factor of a hard sphere. Only the carbon form factor shows the effect of a finite surface re-gion in the range before the first minimum. The positions of the higher-order minima and maxima do, however, not agree with the form factor of a hard sphere (grey curve), since the shift caused by the FSI effects is not the same for the different minima (in case of lead roughly 3% for the first minimum and 20% for the 5th minimum). However, if the zeroes of the hard-sphere form factor are adjusted to these shifts (full curve) the data are quite well described by the hard-sphere form factor. This is surprising since due to the effects from the finite surface region the Helm model predicts a significant faster fall-off of the form fac-tors in the region beyond the first diffraction minimum. To
4
Note: in all cases targets with natural isotope composition have been used in the experiments [11]. However, natural nio-bium is mono-isotopic, and in case of carbon and calcium the admixture of other isotopes than12
C and40
Ca is negligible at the current level of precision.
10-2 10-1 1 0 2 4 6 8 10 12
F(q)
12C
40Ca
93Nb
Pb
0 0.5 1 0 1 2 3 4qR
dFig. 5. Mass form factors extracted in PWIA approximation (see text). Grey curve: hard-sphere form factor (eq. (16)); solid curve: hard-sphere form factor with zeroes adjusted for DWIA effects; dotted: hard-sphere (Rdof Ca) and Gaussian with σ = 0.75 fm; dashed: hard-sphere (Rd of C) and Gaussian with σ = 0.75 fm. Insert: region before first minimum in linear scale.
demonstrate this effect the form factors of a hard sphere convoluted with a Gaussian with σ = 0.75 fm and the Rd radii of Ca (dotted) and C (dashed) are also shown in the figure. The predicted magnitude of the form factor in the first maximum decreases strongly with decreasing mass number, but the experimental results are practically iden-tical for all nuclei. It will be discussed in subsect. 4.3 that the effect of the surface thickness is canceled to a large extent by DWIA effects, so that the extraction of surface parameters requires a careful correction of the pion dis-tortion effects.
4.2 rms radii
For the form factor model-independent extraction of the rms radii the results with and without correction of FSI ef-fects (DWIA, PWIA approximation, see fig. 4) were used. The DWIA approximation is of course expected to give more realistic results. However, also in this approxima-tion the form factors do not exactly approach unity for q → 0.
The size of these effects is summarized in table 1, where the overall normalization constant a0(see eq. (9)) is listed for the PWIA and DWIA approximations for two different regions of incident photon energy. In all cases averages for fits with polynomials of degree N = 2, 4 are given; how-ever the N = 2, 4 results differ only by a few percent. The DWIA approximation brings the overall normaliza-tion closer to unity, in particular for the higher incident photon energies.
10
-11
0
0.2
0.4
0.6
0.8
1
F(q
2)
PWIA
C
Ca
Nb
Pb
E
γ=200 - 245 MeV
10
-11
0
0.2
0.4
0.6
0.8
1
DWIA
C
Ca
Nb
Pb
q
2[fm
-2]
Fig. 6.Fit of the form factors in PWIA and DWIA with poly-nomials of degree N = 4 (solid lines) and N = 2 (dashed lines) for incident photon energies between 200 MeV and 245 MeV. Table 1. Normalization constants of the form factor data. Listed is the a0 coefficient of the fitted Taylor series (see eq. (9)). The values are the average for fits with polynomials of degree N = 2, 4.
200–245 MeV 245–290 MeV Nucleus PWIA DWIA PWIA DWIA
12 C 0.95 1.20 0.70 1.10 40 Ca 0.83 1.11 0.55 0.95 93 Nb 0.75 1.07 0.45 0.92 natPb 0.72 0.99 0.42 0.83
Since the rms radii depend only on the slope of the form factor but not on the absolute normalization (as long as a0 is kept a free parameter, see eqs. (8)-(10)), it is a priori not clear how large the influence of the FSI cor-rections is. In order to get some estimate, results from the PWIA and DWIA approximation are compared. Typ-ical fits of the data are shown in figs. 6, 7. The results of the fits for the rms radii calculated from eqs. (8)-(10) are summarized in fig. 8. They are plotted as a function of
10
-11
0
0.2
0.4
0.6
0.8
1
F(q
2)
PWIA
C
Ca
Nb
Pb
E
γ=245 - 290 MeV
10
-11
0
0.2
0.4
0.6
0.8
1
DWIA
C
Ca
Nb
Pb
q
2[fm
-2]
Fig. 7. Same as fig. 6 for photon energies between 245 MeV and 290 MeV.
the upper limit of the fit range, which allows to judge the stability of the fits. Fits have been done with polynomi-als of degree N = 2, 4. The fits with N = 4 become only stable when rather large ranges of q are fitted; however, in that limit they approach the N = 2 results. The re-sults from PWIA and DWIA agree in most cases better than within 10%. However, the radii extracted in DWIA approximation are in all cases systematically smaller than those from the PWIA analysis; this effect increases with nuclear mass. This is expected, since the FSI effects tend to increase the slope of the form factor (they shift the first minimum to smaller q values, see fig. 2), which leads to an overestimate of the radii in PWIA approximation. The adopted values of the radii are compared in fig. 8 and in table 2 to the nuclear charge radii extracted from electron scattering experiments. The uncertainties have been esti-mated from the variation of the results with the fit range and the agreement between the N = 2 and N = 4 results. In all cases the mass radii are somewhat smaller than the corresponding charge radii and this effect becomes larger for increasing mass. The effect lies between 2–6% for the PWIA approximation and between 3–10% for the
14 The European Physical Journal A 2 3 4 5 0.4 0.6 0.8 1 1.2 1.4 Pb Nb Ca C PWIA, n=2 DWIA, n=2 PWIA, n=4 DWIA, n=4 PWIA adopted DWIA adopted rms charge radii rrms [fm ] q [fm-1]
Fig. 8. Fit results for the rms radii extracted from eqs. (8)-(10). They are plotted as a function of the upper limit of the fitted q-range for the PWIA and DWIA analyses and for fits with polynomials of degree N = 2, 4. They have been aver-aged over the two ranges of incident photon energies. The trian-gles represent the adopted values, the stars the corresponding rms charge radii from ref. [1].
Table 2.Mass rms radii (rrms) extracted in PWIA and DWIA compared to charge rms radii (rpc
rms) [1]. The charge radii have been corrected for the proton charge form factor by subtracting in quadrature the proton rms radius (rp= 0.862 fm).
Nucl. rrms[fm] rpcrms rrms/rrmspc
PWIA DWIA [fm] PWIA DWIA
12 C 2.28±0.10 2.26±0.10 2.32 0.98 0.97 40 Ca 3.22±0.10 3.15±0.10 3.35 0.96 0.94 93 Nb 3.96±0.10 3.76±0.10 4.22 0.94 0.89 natPb 5.20±0.15 4.90±0.15 5.42 0.96 0.90
DWIA results (note that since the DWIA correction for 93Nb was approximated from Pb it has a larger system-atic uncertainty). This result is in particular unexpected for lead, where nuclear models (see, e.g., [10]) in general predict somewhat larger rms radii for the neutron dis-tribution than for the protons, so that one would to the contrary expect slightly larger mass rms radii. Possible ex-planations include still uncontrolled effects from the cor-rection of the FSI in DWIA and small contaminations of the coherent cross-section with incoherent reaction pro-cesses (see sect. 5).
4.3 Results from the Helm model
The most sensitive analysis of the form factor in the frame-work of the Helm model would be a fit of the data over the full measured q range. However, it is not straightfor-ward to apply the FSI corrections, which include shifts of the position of the minima and modifications (reductions
10
-11
0
0.2
0.4
0.6
0.8
1
F(q
2)
DWIA
C
Ca
Nb
Pb
E
γ=200 - 245 MeV
10
-11
0
0.2
0.4
0.6
0.8
1
C
Ca
Nb
Pb
E
γ=245 - 290 MeV
q
2[fm
-2]
Fig. 9. Fit of the Helm model (eq. (14)) to the form factors in DWIA approximation for two different ranges of incident photon energies.
for most incident photon energies) of the magnitude, con-sistently over the full q range. Therefore, the direct de-termination of Rd from the position of the minima and the determination of σ from eq. (19) has the advantage that only specific features (shift of minima and modifica-tion of first maximum) of the DWIA correcmodifica-tions of the cross-sections must be known. At this stage we do not at-tempt to fit the form factors beyond the first minimum, where the DWIA effects can be corrected in the way dis-cussed in subsect. 3.1. However, more refined treatments of the DWIA corrections are certainly possible and will be worthwhile when more precise data become available. Here the analysis is done in two different ways.
In the first analysis the form factors in the region be-fore the first diffraction minimum extracted in the DWIA approximation as discussed in subsect. 3.1 have been fit-ted with eq. (14) multiplied with an overall normalization constant. The fits are shown in fig. 9 for two ranges of in-cident photon energies. The results for the fit parameters are summarized in table 3. For the dms radii quite good agreement is found with the charge radii extracted from electron scattering experiments. Since the fitted q-range is
Table 3. Diffraction mass radii (Rd) and width of the Gaus-sian (σ) determined from the fit of eq. (14) to the data. The parameters are averages over the two regions of incident pho-ton energies (200–245, 245–290 MeV). The uncertainties have been estimated from fit errors and the agreement between the two energy ranges. For comparison the parameters from charge distributions Rdc, σc are also listed. They represent the aver-ages of the results given in [5] (since93
Nb is not analyzed in [5] instead the average for the isotopes92,94Zr is given in brackets).
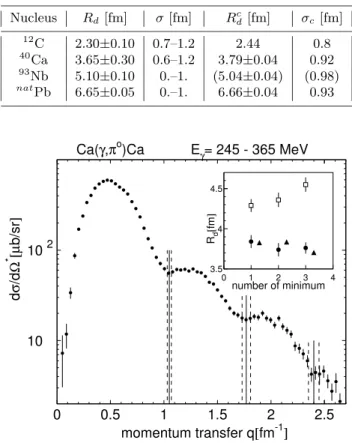
Nucleus Rd[fm] σ [fm] Rcd[fm] σc [fm] 12 C 2.30±0.10 0.7–1.2 2.44 0.8 40 Ca 3.65±0.30 0.6–1.2 3.79±0.04 0.92 93 Nb 5.10±0.10 0.–1. (5.04±0.04) (0.98) natPb 6.65±0.05 0.–1. 6.66±0.04 0.93 10 102 0 0.5 1 1.5 2 2.5 dσ /d Ω * [µ b/sr ] Ca(γ,πo)Ca E γ= 245 - 365 MeV momentum transfer q[fm-1] 3.5 4 4.5 0 1 2 3 4 number of minimum Rd [fm ]
Fig. 10.Main plot: position of the diffraction minima for40 Ca. Insert: extracted dms radii. Open squares: raw values; filled circles: after correction for FSI; triangles: charge dms radii from electron scattering [5].
small for the heavy nuclei, the fits are not sensitive to the width of the Gaussian; therefore, in case of Nb and Pb, values between zero and unity result in similar fit qualities. A more precise determination of the radii uses the po-sition of all observed diffraction minima. The results for Ca and Pb are shown in figs. 10, 11. For the first min-imum of Ca and the first and second minima of Pb the positions were individually determined in bins of 20 MeV incident photon energy. Since no systematic trends were observed, only the average over all bins is shown in the fig-ures. Due to the limited statistics the higher minima were only determined for the full energy range of 245–365 MeV without considering possible energy-dependent shifts. Al-though we have assigned rather conservative uncertainties to the positions of the higher minima, their large lever arm leads to fairly precise values of the corresponding values of the radii. 10 102 103 0 0.5 1 1.5 2 2.5 dσ /d Ω * [µ b/sr ] Pb(γ,πo)Pb E γ= 245 - 365 MeV momentum transfer q[fm-1] 6 7 8 0 1 2 3 4 5 6 number of minimum Rd [fm ]
Fig. 11.Same as fig. 10 for Pb.
1 2 3 4 5 6 7 8 9 0 1 2 3 4 5 6
number of minimum
R
d[fm
]
Pb
Nb
Ca
C
Fig. 12.Extracted values of the dms radii. Open squares: raw values; filled circles: after correction for FSI; triangles: charge dms radii from electron scattering [5]. In case of Nb the open triangles correspond to the average of the charge dms radii for 92,94Zr (values for93
Nb are not available). The full and dotted lines indicate average and uncertainty of the radius for each nucleus.
The radii have been calculated from the position of the minima via (see eq. (16))
R(i)d = Xi/qi (21) where qi is the position of the i-th minimum, Xi the i-th zero of the Bessel function and R(i)d the corresponding value of the dms radius. The results are shown in the in-serts of the figures and summarized in fig. 12.
The values extracted from the raw data with eq. (21) (open squares in the figures) show a systematic trend as a function of the number of the minima. However, this trend
16 The European Physical Journal A is completely eliminated and almost perfect agreement
with the corresponding charge radii is obtained after cor-rection of the FSI effects (filled circles in the figures). The shift of the position of the minima due to FSI effects was determined from a comparison of the position of the min-ima in the PWIA and DWIA calculations as discussed in sect. 2 (see fig. 2). The good agreement between the values extracted from the different minima after correction nicely demonstrates that the FSI effects are well under control at least as far as the position of the minima is concerned. For the charge distributions a systematic deviation of the dms radii extracted from the first and second diffrac-tion minium has been found [5, 6], which was related to the depression of the central density of the charge distribution in nuclei. It would be therefore very interesting to investi-gate if such a central density suppression survives also into the mass density. However, the precision achieved so far, does not yet allow to answer this question. The extracted (R(1)d − R(2)d ) differences are 0.10 ± 0.12 fm, 0.16 ± 0.13 fm, and 0.00 ± 0.15 fm for 40Ca, 93Nb and Pb. This means that they are consistent with zero but also with the small differences observed for the charge radii (on the order of 0.1 fm for lead).
Finally, the first maximum of the form factors was used for a more precise extraction of the width of the Gaussian with eq. (19). This requires not only the determination of the position qm of the maximum but also the absolute value of the form factor F (qm), which is strongly influ-enced by the FSI effects. In order to minimize the model dependency, the correction was done in the following way. As in subsect. 4.1 the form factors were fitted with Taylor series and the absolute normalization was obtained from the condition a0 = 1. The results are shown in fig. 13, left-hand side. Position qm and magnitude F (qm) of the first maximum were determined from these data. The FSI correction for the position was obtained in the same way as for the position of the minima. The correction of the magnitude was also obtained from a comparison of the differential cross-sections calculated in PWIA and DWIA. This is shown on the right-hand side of fig. 13. In the pic-ture, the position of the first minimum and the magnitude before the first minimum are normalized for the DWIA calculation so that the cross-sections agree in the q range before the first minimum. The additional FSI correction for the magnitude of the first form factor maximum is then obtained from the square root of the ratio of the two cal-culations at this q value. In this way, again only ratios of the model results enter into the correction factors. In the absence of a good DWIA calculation for Nb no analysis of the Gaussian width was attempted for this nucleus. The parameters of the first maximum and the deduced values for the Gaussian width σ are summarized in table 4.
It is obvious from fig. 13 and table 4 that the relative FSI corrections (i.e. the difference of the FSI effects be-tween the q range before the first minimum and in the first maximum) increase with decreasing mass number, they are almost negligible for lead but very significant for carbon (note that the absolute FSI effects are of course much larger for lead than for carbon). Their effect is that
10-2 10-1 1 0 1 F(q) 40Ca Pb 10-2 10-1 1 0 1 40Ca Pb dσ /d Ω [mb/sr ] q[fm] q[fm] 10-1 1 0 1 2 F(q) 12C 10-4 10-2 1 0 1 2 dσ /d Ω [mb/sr ] q[fm] q[fm]
Fig. 13. Left-hand side: position and height of the first maximum of the form factors for carbon, calcium and lead. Right-hand side: PWIA (dashed curves) and DWIA (full curves) calculations for the differential cross-sections for the same range of incident photon energies as taken into account in the data analysis (200–260 MeV for Ca and Pb, 255–330 MeV for C). Position of the first minimum and the absolute values before the first minimum of the DWIA calculation are normal-ized to the PWIA calculation.
Table 4. Determination of σ from the first maximum of the form factor (see eq. (19)). qmand F (qm) are position and mag-nitude of the first maximum, qcor
m and Fcor(qm) the same after correction for FSI effects (q in [fm−1], σ in [fm]).
Nucl. qm qcorm F (qm) Fcor(qm) qmcorRd σ 12
C 1.95 2.15 0.079 0.043 5.18 0.46 40
Ca 1.30 1.41 0.076 0.058 5.33 0.53 natPb 0.78 0.825 0.0776 0.071 5.49 0.67
for the form factors normalized to unity for q → 0 the magnitude of the first maximum is overestimated for the light nuclei in the PWIA analysis. And this effect cancels the influence of the finite Gaussian width on the magni-tude in the first maximum.
The results for the dms radii and the Gaussian width σ are summarized in table 5 and compared to the corre-sponding values for the charge distributions. The mass dms radii are in excellent agreement with their charge counterparts, though the almost exact agreement for Ca and Pb is certainly by chance, given the associated un-certainties. Thus, also for the diffraction radii there is no indication that the mass radii would be larger than the charge radii.
For the comparison of the width σ with the cor-responding width σc of the charge distributions one must take into account that the values for the charge
Table 5. Parameters of the Helm model from the positions of the diffraction minima and position and magnitude of the first maximum. The values for Rdare the average values from fig. 12. The results for σ are from table 4. Rc
dand σc are the respective values for the nuclear charge distributions taken from [5] (the latter corrected for the finite extension of the proton charge distribution).
Nucl. Rd [fm] σ [fm] Rcd[fm] σc[fm] 12 C 2.41 ± 0.09 0.46 2.44 0.67 40 Ca 3.78 ± 0.05 0.53 3.79 ± 0.04 0.80 93 Nb 5.09 ± 0.05 – 5.04 ± 0.04 – nat Pb 6.66 ± 0.07 0.67 6.66 ± 0.04 0.81
distributions include the effect of the finite extension of the proton, while the values extracted from pion photo-production refer to point-like nucleons. Therefore, σc has been corrected for this effect with the dipole form factor of the proton. However, even after this correction, the values extracted for the mass distributions remain systematically smaller, in particular for the light nuclei (see table 5).
5 Summary and conclusions
Recent data for coherent photoproduction of π0 mesons have been analyzed in view of nuclear mass distributions. The Helm model was used to extract diffraction minimum sharp radii from the positions of the diffraction minima and skin thicknesses from the magnitude and position of the first maximum of the form factors. After corrections for FSI effects, the mass dms radii are in excellent agree-ment with the dms radii of the charge distributions of the nuclei. A stringent control of systematic effects (e.g. the FSI corrections) on the dms radii is possible via the comparison of the results for different order minima of the same nucleus. No systematic trends have been ob-served. The uncertainties of the dms radii (3.7% for 12C and ≈ 1% for all other nuclei) have reached a similar level of precision as the corresponding charge radii. However, the achieved precision is just not sufficient to exclude or establish a central depression of the mass distributions from the comparison of the positions of first and second diffraction minimum.
Root-mean-square radii of the mass distributions have been extracted in two different ways. In the first, the slope of the form factors for q → 0 was fitted with polynomials. A very conservative estimate of the typical uncertainty due to FSI corrections of the shape of the form factors follows from the difference between the results obtained in PWIA and DWIA, which is the more important the heavier the nucleus. In a second approach, they have been extracted in the framework of the Helm model via eq. (18) from the dms radii and surface thicknesses. The results are summarized in table 6. The largest discrepancies between the different analysis are in the range of 10%.
An unexpected finding is that all results for the rms mass radii are slightly smaller than the corresponding rms charge radii, even after the latter have been corrected for
Table 6. Comparison of the extracted rms mass radii with charge rms radii (all values are in [fm]). Rd: mass dms radii (see table 5); σ: Gaussian width of the mass distributions (see table 5) (value in brackets for Nb interpolated from other nu-clei); rHelm
rms : rms mass radii calculated with eq. (18) from Rd and σ, rrmsP W, r
DW
rms: rms radii extracted from the slope of the form factors in PWIA and DWIA approximation (see table 2); rc
rms: charge rms radii with the proton charge radius subtracted in quadrature. Nucl. Rd σ rHelmrms rrmsP W rDWrms rcrms 12 C 2.41 0.46 2.03 2.28 2.26 2.32 40 Ca 3.78 0.53 3.07 3.22 3.15 3.35 93 Nb 5.09 (0.60) 4.08 3.96 3.76 4.22 nat Pb 6.66 0.67 5.29 5.20 4.90 5.42
the proton charge radius. Since at least for nuclei like 208Pb models predict slightly larger rms radii for the neu-tron distributions than for the proton distributions one would have expected the opposite. At the same time the skin thicknesses extracted from the Helm model are also systematically smaller than their charge counterparts. In a sense, these two effects are consistent since smaller skin thicknesses combined with identical diffraction radii will lead to smaller rms radii. However, as yet it is not clear if these effects are real or if they can be explained by so far not understood systematic effects in the data or in the model calculations used for the DWIA corrections. A possible explanation could be a small remaining incoher-ent background componincoher-ent in the cross-section data. The angular distributions of incoherent π0photoproduction in-volving excited nuclear states peak at larger angles than the coherent reaction. Therefore, such background, which so far is only suppressed by kinematical cuts, would tend to decrease the slope of the form factor at small q, it would enhance the magnitude of the first diffraction maximum, but it would not change the position of the diffraction minima. In such a scenario, rms radii and skin thicknesses would be underestimated, but the dms radii would not be effected. Clearly, further improvements on the experimen-tal side and for the model calculations are necessary and possible. On the experimental side, large improvements in the statistical quality of the data are possible with the now available 4π electromagnetic calorimeters. Further-more, improvements in the energy and angular resolution for the detection of the π0 decay photons will allow an even more stringent suppression of incoherent pion pro-duction reactions than achieved in [11]. The background situation will furthermore very significantly improve since with the large solid-angle coverage the detection of de-cay photons from excited nuclear states will not only al-low to veto such events much more efficiently than previ-ously, it will actually allow a detailed investigation of the incoherent processes (which are very interesting in their own right) so that any remaining background can be sub-tracted. Furthermore, a more systematic investigation of coherent pion photoproduction from many nuclei in the framework of models is clearly desirable.
18 The European Physical Journal A First of all I would like to thank J. Friedrich for many
stimulat-ing discussions, valuable suggestions, and detailed comments to the manuscript. I gratefully thank S.S. Kamalov for the pro-vision of the DWIA calculations. This work was supported by Schweizerischer Nationalfonds.
References
1. C.W. de Jager, D. de Vries, C. de Vries, At. Data Nucl. Data Tables 14, 479 (1974).
2. H. de Vries, C.W. de Jager, C. de Vries, At. Data Nucl. Data Tables 36, 495 (1987).
3. B. Frois, C. Papanicolas, S.E. Williamson, in Modern Top-ics in Electron Scattering, edited by. B. Frois, I. Sick (World Scientific, Singapore, 1991) p. 352.
4. G. Fricke et al., At. Data Nucl. Data Tables 60, 177 (1995). 5. J. Friedrich, N. Voegler, Nucl. Phys. A 373, 191 (1982). 6. J. Friedrich, N. Voegler, P.-G. Reinhard, Nucl. Phys. A
459, 10 (1986).
7. I. Sick et al., Phys. Rev. Lett. 38, 1259 (1977). 8. S.K. Platchkov et al., Phys. Rev. C 25, 2318 (1982).
9. C.J. Batty, E. Friedman, H.J. Gils, H. Rebel, Adv. Nucl. Phys. 19, 1 (1989).
10. K. Pomorski et al., Nucl. Phys. A 624, 349 (1997). 11. B. Krusche et al., Phys. Lett. B 526, 287 (2002).
12. R.A. Schrack, J.E. Leiss, S. Penner, Phys. Rev. 127, 1772 (1992).
13. H. Alvesleben et al., Phys. Rev. Lett. 24, 792 (1970). 14. D. Drechsel, L. Tiator, S.S. Kamalov, S.N. Yang, Nucl.
Phys. A 660, 423 (1999).
15. R. Novotny, IEEE Trans. Nucl. Sci. 38, 379 (1991). 16. A.R. Gabler et al., Nucl. Instrum. Methods A 346, 168
(1994).
17. B. Krusche, S. Schadmand, Prog. Part. Nucl. Phys. 51, 399 (2003).
18. B. Krusche et al., Eur. Phys. J. A 6, 309 (1999).
19. E.M. Darwish, H. Arenh¨ovel, M. Schwamb, Eur. Phys. J. A 16 2003 111.
20. G.F. Chew et al., Phys. Rev. 106, 1345 (1957). 21. D. Drechsel et al., Nucl. Phys. A 645, 145 (1999). 22. B. Krusche et al., Eur. Phys. J. A 22, 277 (2004). 23. B. Krusche et al., Eur. Phys. J. A 22, 347 (2004). 24. B. Krusche Prog. Part. Nucl. Phys. 55, 46 (2005).
![Fig. 1. Total cross-section for coherent π 0 photoproduction from carbon, calcium and lead [11] compared to the model results from [14].](https://thumb-eu.123doks.com/thumbv2/123doknet/14862004.635650/3.892.464.811.133.489/total-section-coherent-photoproduction-carbon-calcium-compared-results.webp)


![Table 6. Comparison of the extracted rms mass radii with charge rms radii (all values are in [fm])](https://thumb-eu.123doks.com/thumbv2/123doknet/14862004.635650/11.892.78.421.261.362/table-comparison-extracted-mass-radii-charge-radii-values.webp)
