EUROPEAN ORGANISATION FOR NUCLEAR RESEARCH (CERN)
Submitted to: JHEP CERN-EP-2020-240
29th January 2021
Search for doubly and singly charged Higgs bosons
decaying into vector bosons in multi-lepton final
states with the ATLAS detector using
proton–proton collisions at
√
𝒔 = 13 TeV
The ATLAS Collaboration
A search for charged Higgs bosons decaying into 𝑊±𝑊± or 𝑊±𝑍 bosons is performed,
involving experimental signatures with two leptons of the same charge, or three or four leptons with a variety of charge combinations, missing transverse momentum and jets. A data sample of proton–proton collisions at a centre-of-mass energy of 13 TeV recorded with the ATLAS detector at the Large Hadron Collider between 2015 and 2018 is used. The data
correspond to a total integrated luminosity of 139 fb−1. The search is guided by a type-II
seesaw model that extends the scalar sector of the Standard Model with a scalar triplet, leading to a phenomenology that includes doubly and singly charged Higgs bosons. Two scenarios
are explored, corresponding to the pair production of doubly charged 𝐻±± bosons, or the
associated production of a doubly charged 𝐻±± boson and a singly charged 𝐻±boson. No
significant deviations from the Standard Model predictions are observed. 𝐻±± bosons are
excluded at 95% confidence level up to 350 GeV and 230 GeV for the pair and associated production modes, respectively.
© 2021 CERN for the benefit of the ATLAS Collaboration.
Reproduction of this article or parts of it is allowed as specified in the CC-BY-4.0 license.
1 Introduction
Experimental signatures with two leptons with the same electric charge (same-charge) or multi-lepton final states are extensively exploited in searches for physics beyond the Standard Model (BSM physics) at hadron colliders. In many models, heavy BSM particles may be produced in proton–proton collisions and decay into multiple massive Standard Model (SM) electroweak gauge bosons or top quarks. Subsequent decays of these gauge bosons into final states with leptons can occur with considerable branching ratios. These final states are favourable to the search for new phenomena since the yields predicted within the SM are generally
low and the experimental effects are well understood. At the Large Hadron Collider (LHC) [1], signatures
with two leptons of the same charge, or three or four leptons with a variety of charge combinations have been used by the ATLAS and CMS experiments to explore the landscape of possible SM extensions and
their phenomenology [2–21]. Among these proposed extensions, the addition to the SM sector of one
weak gauge triplet of scalar fields with a non-zero vacuum expectation value of the neutral component is a
compelling way to account for neutrino masses through the type-II seesaw mechanism [22].
Guided by such a model, this paper presents a search for doubly and singly charged Higgs bosons. In the considered type-II seesaw model, after the electroweak symmetry breaking, there are seven scalar bosons:
𝐻±±, 𝐻±, 𝐴0(CP odd), 𝐻0 (CP even) and ℎ0(CP even). The vacuum expectation value is assumed to
be 100 MeV, the lightest CP-even Higgs boson is the discovered SM Higgs boson, and the chosen model parameters are compatible with the measured SM Higgs boson properties and electroweak precision data. The theoretical and experimental constraints help in choosing allowed values for the parameters of the model from which the predominant production and decay modes follow. Only the pair production of
doubly charged 𝐻±±bosons via a virtual photon or a 𝑍 boson, and the associated production of a doubly
charged 𝐻±± boson and a singly charged 𝐻± boson via a 𝑊±boson are considered. For the 𝐻±± pair
production mode the 𝐻±± boson mass is at least 100 GeV lower than the 𝐻±boson mass, while for the
associated production of 𝐻±±and 𝐻±bosons the mass difference between the doubly and singly charged
Higgs bosons is at most 5 GeV. Signal processes were simulated for different 𝐻±±boson mass hypotheses
between 200 and 600 GeV. The 𝐻±±boson is considered to decay into a 𝑊±𝑊±pair and the 𝐻±boson into
a 𝑊±𝑍 pair. The four gauge-boson final states are identified by the presence of charged leptons (electrons
or muons), missing transverse momentum and hadronic jets. The analysis uses three final states (channels)
classified according to the number of leptons: two same-charge (SC) leptons (2ℓsc), three leptons (3ℓ), and
four leptons (4ℓ). Electrons and muons from 𝜏-lepton decays are also considered.
An earlier ATLAS analysis using this signature to target the pair production of doubly charged 𝐻±±bosons
at√𝑠= 13 TeV with an integrated luminosity of 36 fb−1placed lower limits of between 200 and 220 GeV
on the 𝐻±±boson mass [23]. In this paper the search is extended and refined, using a larger data set of 𝑝 𝑝
collisions at√𝑠= 13 TeV recorded by the ATLAS detector corresponding to an integrated luminosity of
139 fb−1. In addition, the production of a 𝐻±±boson in association with a 𝐻±boson is included, extending the initial search and allowing a search for doubly and singly charged Higgs bosons in a previously
unexplored region of the considered model’s parameter space. Section2presents the theoretical framework
while Section3gives an overview of the experimental set-up. The different Monte Carlo simulations used
in the analysis are described in Section4, followed by a description of the event reconstruction in Section5. Signal regions are built from a set of requirements on the kinematic properties of the selected events, in
order to isolate the signature of BSM processes from SM backgrounds, as presented in Section6. Section7
describes the estimation of the backgrounds. The systematic uncertainties are detailed in Section8. Event
yields in data are then compared with the estimated contributions from SM processes, and the results are
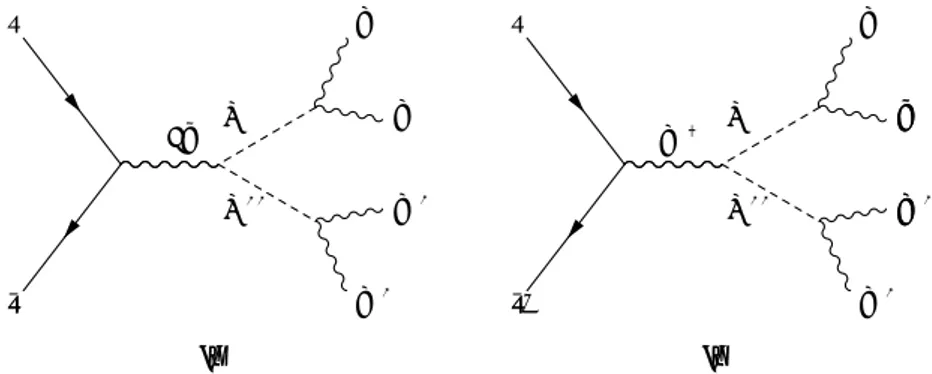
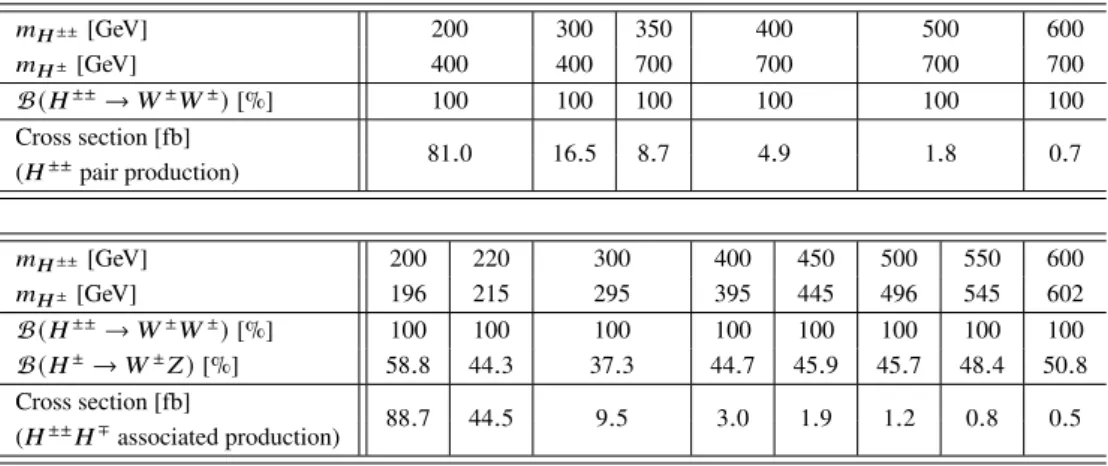
γ /Z∗ H++ H−− q W+ W+ W− W− 1 q q ∗ (a) W+ Z 1 ∗ ' qq q H− H++ W− W+ W+ Z W (b)
Figure 1: Feynman diagrams illustrating production and subsequent decay of the 𝐻±±and 𝐻±bosons: (a) 𝐻±±pair production and (b) 𝐻±±and 𝐻±associated production.
2 Signal model
A type-II seesaw model, in which the scalar sector of the SM is extended with a hypercharge 𝑌 = 2 scalar
triplet Δ [24–29], is studied. The electroweak symmetry breaking (EWSB) is achieved by requiring the
neutral components of the SM scalar doublet 𝐻 and scalar triplet Δ to acquire vacuum expectation values,
𝑣dand 𝑣t respectively. After the EWSB, the mixing between these fields results in seven scalar bosons:
𝐻±±, 𝐻±, 𝐴0(CP odd), 𝐻0(CP even) and ℎ0(CP even). The ℎ0boson is the SM Higgs boson, and a small
mixing between the CP-even scalars is naturally obtained in the model. In addition, the triplet–neutrino Yukawa term provides non-zero neutrino masses proportional to the vacuum expectation value of the triplet
𝑣t. In this type-II seesaw model, constraints from electroweak precision measurements lead to an upper
bound on 𝑣tof approximately 2.5 GeV, which is significantly lower than the electroweak scale and matches
the need for small values suggested by the natural association of 𝑣twith the neutrino masses. Additional,
theoretical constraints are the absence of tachyonic modes, requirements for the vacuum structure and
stability of the potential, and unitarity requirements. A detailed discussion can be found in Ref. [29].
The theoretical and experimental constraints help to choose allowed values for the parameters of the model from which the predominant production and decay modes follow. Some type-II seesaw models also
extend the weak sector by introducing two scalar triplets and right-handed gauge bosons 𝑊R(left–right
symmetric models). The model studied in this analysis corresponds to the left-handed triplet discussed in Refs. [30–34].
Two scenarios with 𝑣t equal to 100 MeV are explored in this paper. In the first scenario, the mass
difference between 𝐻±± and 𝐻± bosons is > 100 GeV, the 𝐻± boson being the heavier one. Large
mass splitting could still be allowed despite the|𝑚𝐻± − 𝑚𝐻±±| < 40 GeV constraint deduced from the
electroweak precision data [35] if radiative corrections reduce the tree-level contribution coming from
the triplet vacuum expectation value. Only the pair production of 𝐻±± bosons via the diagram shown in
Figure1(a)(𝑝 𝑝→ 𝛾∗/𝑍∗→ 𝐻±±𝐻∓∓) is considered. The triplet vacuum expectation value is taken to be
𝑣t= 100 MeV such that only the doubly charged 𝐻±±boson decay into a pair of 𝑊 bosons with the same
charge, 𝐻±±→ 𝑊±𝑊±, is possible [28]. The leptonic decays 𝐻±±→ ℓ±ℓ±are suppressed with increasing 𝑣t[36,37] and not considered in this paper.
In the second scenario, the mass of the 𝐻±boson is chosen to be at most 5 GeV different from the 𝐻±±
boson mass. The low mass difference ensures that the charged Higgs bosons do not decay into each other with a non-negligible branching fraction, and complies with the additional|𝑚𝐻±− 𝑚𝐻±±| < 40 GeV
constraint deduced from the electroweak precision data. In addition, the chosen mass difference between the doubly and singly charged Higgs bosons maximises the signal amplitudes. Only the associated production
of 𝐻±±and 𝐻±bosons via the diagram shown in Figure1(b)(𝑝 𝑝→ 𝑊±∗ → 𝐻±±𝐻∓) is considered. The
production cross sections for 𝐻±±pair production with the same mass settings as for associated production
of 𝐻±±and 𝐻±bosons can be large. However, this production mode is exactly the one described in the
first scenario and it is not considered in the second scenario. This choice is motivated by the objective of the search, which is to set up a characteristic signature with a benchmarking parameter point and place
upper limits on the production cross section. The 𝐻±±boson decays into a pair of 𝑊 bosons with the
same charge, with a branching ratio of 100%. Only the bosonic decays of the singly charged bosons
(𝐻±→ 𝑊±𝑍) are considered and, depending on the 𝐻±boson mass, the branching ratio varies between
40% and 60% (see Table1). The branching fraction for the 𝑚𝐻±± = 300 GeV mass hypothesis is lower
than for the neighbouring points because of the high dependency of this quantity on the mass of the scalar
triplet Δ [29]. Depending on the 𝐻±boson mass, other decay modes are 𝐻±→ 𝑡 ¯𝑏 and 𝐻±→ 𝑊±ℎ0[28].
Studies at Monte Carlo generator level show that after the selection of at least two same-charge leptons or at least three leptons and no 𝑏-jet (where the 𝑏-jets are selected with 70% efficiency), the contribution from
the other possible 𝐻±decays is negligible. Similar conclusions are also reached after examining the results
obtained for the various control regions used in the analysis. The effect on the mass below which a charged Higgs boson is excluded is negligible.
Pair production of 𝐻±bosons is also possible, albeit with a much smaller production cross section than for
𝐻±±pair production. Therefore, 𝐻±pair production is not considered in this paper. The cross section for
single 𝐻±±production via vector-boson fusion (𝑝 𝑝→ 𝑊±∗𝑊±∗→ 𝐻±±) is proportional to 𝑣t, and hence
negligible.
For the 𝐻±±pair production mode, the mixing between the CP-even scalars is taken to be 10−4and the
remaining five couplings in the potential are adjusted to obtain a given 𝐻±±boson mass hypothesis while
requiring ℎ0to have a mass of 125 GeV. Similar settings are also used for the associated production mode.
The branching fraction times cross-section calculation for the pair production of 𝐻±± bosons and the
associated production of 𝐻±±and 𝐻±bosons is performed for on-shell 𝑊 and 𝑍 bosons, and therefore only
the region 𝑚𝐻±± > 200 GeV is considered in the present analysis.
Extensive searches for leptonic decays have been performed at various experiments [38–43], excluding
doubly charged 𝐻±±bosons with masses up to about 870 GeV. The CMS Collaboration published results for
the 𝐻±±→ 𝑊±𝑊±decay mode in the context of single 𝐻±±production through vector-boson fusion with
𝑣tvalues of a few tens of GeV, for a model with two Higgs triplets [44–46]. In contrast, the 𝐻±±→ 𝑊±𝑊±
decay mode is not often investigated for 𝑣t values around 100 MeV. In this case, the difference is that
single 𝐻±±production is suppressed and only 𝐻±±pair production is sizeable. A direct search for 𝐻±±
pair production with decays to 𝑊±𝑊±pairs has been performed on a smaller data set by the ATLAS
Collaboration [23], validating the principle of such an approach.
3 ATLAS detector
The ATLAS experiment [47] at the LHC is a multipurpose particle detector with a forward–backward
symmetric cylindrical geometry and nearly 4𝜋 coverage in solid angle.1 It consists of an inner tracking
1ATLAS uses a right-handed coordinate system with its origin at the nominal interaction point (IP) in the centre of the detector
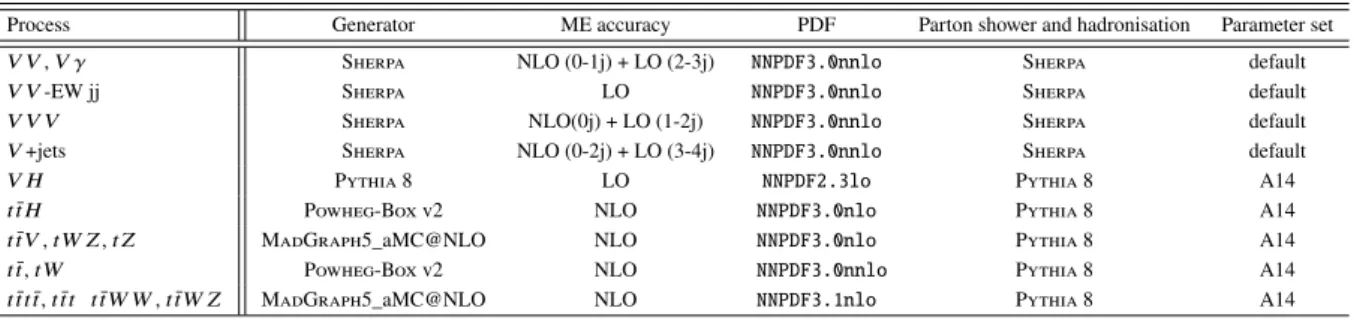
Table 1: The cross sections for the 𝐻±±pair and the 𝐻±±and 𝐻±associated production modes at next-to-leading order in QCD [52]. The branching ratios (B) of the charged Higgs bosons to 𝑊±𝑊±or 𝑊±𝑍 are included in the quoted values. 𝑚𝐻±±[GeV] 200 300 350 400 500 600 𝑚𝐻±[GeV] 400 400 700 700 700 700 B (𝐻±±→ 𝑊±𝑊±) [%] 100 100 100 100 100 100 Cross section [fb] 81.0 16.5 8.7 4.9 1.8 0.7 (𝐻±±pair production) 𝑚𝐻±±[GeV] 200 220 300 400 450 500 550 600 𝑚𝐻±[GeV] 196 215 295 395 445 496 545 602 B (𝐻±±→ 𝑊±𝑊±) [%] 100 100 100 100 100 100 100 100 B (𝐻±→ 𝑊±𝑍) [%] 58.8 44.3 37.3 44.7 45.9 45.7 48.4 50.8 Cross section [fb] 88.7 44.5 9.5 3.0 1.9 1.2 0.8 0.5 (𝐻±±𝐻∓associated production)
detector (ID) surrounded by a thin superconducting solenoid providing a 2 T axial magnetic field, electromagnetic (EM) and hadron calorimeters, and a muon spectrometer (MS). The inner tracking detector
covers the pseudorapidity range|𝜂| < 2.5. It consists of silicon pixel, silicon microstrip and transition
radiation tracking detectors; the innermost layer is 33 mm from the beamline [48–50]. Lead/liquid-argon
(LAr) sampling calorimeters provide electromagnetic energy measurements with high granularity. A steel/scintillator-tile hadron calorimeter covers the central pseudorapidity range (|𝜂| < 1.7). The endcap and forward regions are instrumented with LAr calorimeters for EM and hadronic energy measurements
up to|𝜂| = 4.9. The muon spectrometer surrounds the calorimeters and is based on three large air-core
toroidal superconducting magnets with eight coils each. The field integral of the toroids ranges between 2.0 and 6.0 T·m across most of the detector. The muon spectrometer includes a system of precision tracking
chambers and fast detectors for triggering. A two-level trigger system [51] is used to select events. The
first-level trigger is implemented in hardware and uses a subset of the detector information to keep the accepted rate below 100 kHz. This is followed by a software-based trigger that reduces the accepted event rate to 1 kHz on average depending on the data-taking conditions.
4 Monte Carlo event simulation
Monte Carlo (MC) event generators were used to simulate the signal and background events produced
in the proton–proton collisions. For the 𝐻±±pair production and the 𝐻±±and 𝐻±associated production
signal processes, the events at particle level were generated with MadGraph5_aMC@NLO [53] using
leading-order (LO) matrix elements (ME) and NNPDF3.0lo parton distribution functions (PDF) [54]. The
events were subsequently showered using Pythia 8 [55] with a set of tuned parameters called the A14
tune [56]. Signal processes were simulated for different mass hypotheses between 200 and 600 GeV, and
presented in Table1. For the pair and associated production, the cross section decreases rapidly with the
Cylindrical coordinates(𝑟, 𝜙) are used in the transverse plane, 𝜙 being the azimuthal angle around the 𝑧-axis. The pseudorapidity is defined in terms of the polar angle 𝜃 as 𝜂≡ − ln tan(𝜃/2), and is equal to the rapidity 𝑦 ≡ 0.5 ln ((𝐸 + 𝑝𝑧)/(𝐸 − 𝑝𝑧)) in the
relativistic limit. Angular distance is measured in units of Δ𝑅≡√︁ (Δ𝑦)2+ (Δ𝜙)2. The magnitude of the momentum in the plane transverse to the beam axis is denoted by 𝑝T.
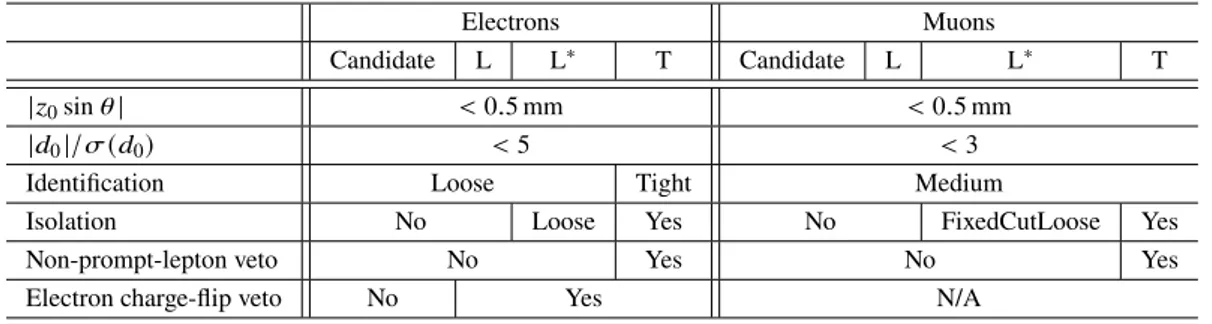
Table 2: Summary of the event generators, parton shower models, and PDF sets used for the simulation of the background event samples. The notation 𝑉 is used to refer to an electroweak gauge boson 𝑊 or 𝑍/𝛾∗. In the final
column, ‘default’ refers the to default parameter set provided with the event generator.
Process Generator ME accuracy PDF Parton shower and hadronisation Parameter set 𝑉 𝑉 , 𝑉 𝛾 Sherpa NLO (0-1j) + LO (2-3j) NNPDF3.0nnlo Sherpa default 𝑉 𝑉 -EW jj Sherpa LO NNPDF3.0nnlo Sherpa default 𝑉 𝑉 𝑉 Sherpa NLO(0j) + LO (1-2j) NNPDF3.0nnlo Sherpa default 𝑉 +jets Sherpa NLO (0-2j) + LO (3-4j) NNPDF3.0nnlo Sherpa default
𝑉 𝐻 Pythia 8 LO NNPDF2.3lo Pythia 8 A14
𝑡 ¯𝑡𝐻 Powheg-Box v2 NLO NNPDF3.0nlo Pythia 8 A14 𝑡 ¯𝑡𝑉 , 𝑡𝑊 𝑍, 𝑡 𝑍 MadGraph5_aMC@NLO NLO NNPDF3.0nlo Pythia 8 A14 𝑡 ¯𝑡, 𝑡𝑊 Powheg-Box v2 NLO NNPDF3.0nnlo Pythia 8 A14 𝑡 ¯𝑡𝑡 ¯𝑡, 𝑡 ¯𝑡𝑡 𝑡 ¯𝑡𝑊 𝑊 , 𝑡 ¯𝑡𝑊 𝑍 MadGraph5_aMC@NLO NLO NNPDF3.1nlo Pythia 8 A14
charged Higgs boson’s mass as shown in Table1. The event samples were normalised using calculations at
next-to-leading order (NLO) in perturbative QCD [52]. The NLO 𝐾-factor increases the expected event
yields by a factor of 1.25, independently of the mass of the charged Higgs bosons.
A summary of the MC event generators used to simulate the background is presented in Table2and further
details are given below. The notation 𝑉 is used to refer to an electroweak gauge boson 𝑊 or 𝑍/𝛾∗.
Event samples of diboson (𝑉𝑉 ) and 𝑉 𝛾 final states were simulated with the Sherpa v2.2.1, v2.2.2 or
v2.2.4 [57] generator depending on the process, including off-shell effects and Higgs boson contributions,
where appropriate. The 𝑉𝑉 and 𝑉 𝛾 processes were simulated using matrix elements at NLO accuracy in QCD for up to one additional parton and at LO accuracy for up to three additional parton emissions. The electroweak production of dibosons in association with two jets (𝑉𝑉 -EW jj) was generated using LO accuracy matrix elements. The matrix element calculations were matched and merged with the
Sherpa parton shower based on Catani–Seymour dipole factorisation [58,59] using the MEPS@NLO
prescription [60–63]. The virtual QCD corrections were provided by the OpenLoops library [64,65]. The
production of triboson (𝑉𝑉𝑉 ) events was simulated with the Sherpa v2.2.2 generator using factorised gauge-boson decays. All diboson and triboson processes were generated using the NNPDF3.0nnlo PDF
set [54], along with the dedicated set of tuned parton-shower parameters developed by the Sherpa authors.
The cross sections from the event generator were used for the normalisation.
The production of an electroweak gauge boson or virtual photon in association with jets (𝑉 +jets) was simulated with the Sherpa v2.2.1 generator using NLO matrix elements for up to two partons, and LO
matrix elements for up to four partons calculated with the Comix [58] and OpenLoops libraries. The
event samples were generated using the NNPDF3.0nnlo PDF set, along with the dedicated set of tuned parton-shower parameters developed by the Sherpa authors. The 𝑉 +jets event samples were normalised to a NNLO prediction.
Higgs boson production in association with a vector boson was simulated at LO with Pythia 8.186 and
EvtGen [66] using the A14 tune, along with the NNPDF2.3lo PDF set. The Monte Carlo prediction
was normalised to cross sections calculated at NNLO in QCD with NLO electroweak corrections
for 𝑞 ¯𝑞/𝑞𝑔 → 𝑉𝐻, and at next-to-leading-logarithm accuracy in QCD with NLO EW corrections for
𝑔𝑔 → 𝑍𝐻 [67–73]. The production of 𝑡 ¯𝑡𝐻 events was modelled using the Powheg-Box v2 [74–78]
generator at NLO with the NNPDF3.0nlo PDF set [54]. The events were interfaced to Pythia 8.230
were performed by EvtGen v1.6.0. The production of 𝑡 ¯𝑡𝑉 , 𝑡𝑊 𝑍 and 𝑡 𝑍 events was modelled using the MadGraph5_aMC@NLO v2.3.3 generator at NLO with the NNPDF3.0nlo PDF. The events were interfaced to Pythia 8.210 (Pythia 8.212 for 𝑡𝑊 𝑍 ) using the A14 tune and the NNPDF2.3lo PDF set. The decays of bottom and charm hadrons were simulated using the EvtGen v1.2.0 program. The simulated 𝑡 ¯𝑡𝐻, 𝑡 ¯𝑡𝑉, 𝑡𝑊 𝑍 and 𝑡𝑍 events were normalised to cross-section calculations at NLO accuracy in QCD. In addition, NLO EW corrections were included for 𝑡 ¯𝑡𝐻, 𝑡 ¯𝑡𝑉 and 𝑡𝑊 𝑍 .
Backgrounds from top-quark pair production (𝑡 ¯𝑡) and 𝑡𝑊 production were estimated at NLO accuracy in
QCD using the hvq program [74] in Powheg-Box v2. The event samples were generated using the A14
tune and NNPDF3.0nnlo PDF set. The interference between 𝑡 ¯𝑡 and 𝑡𝑊 production is neglected as it has a negligible impact on the analysis. The 𝑡 ¯𝑡 event sample was normalised to the cross-section prediction at NNLO in QCD including the resummation of next-to-next-to-leading logarithmic (NNLL) soft-gluon
terms calculated using Top++2.0 [79–85]. The inclusive 𝑡𝑊 cross section was corrected to the theory
prediction calculated at NLO in QCD with NNLL soft gluon corrections [86,87].
The production of 𝑡 ¯𝑡𝑡 ¯𝑡, 𝑡 ¯𝑡𝑡, 𝑡 ¯𝑡𝑊𝑊 and 𝑡 ¯𝑡𝑊 𝑍 events was modelled using the MadGraph5_aMC@NLO v2.3.3
generator at NLO with the NNPDF3.1nlo PDF [54]. The events were interfaced with Pythia 8.230 using
the A14 tune and the NNPDF2.3lo PDF set. The 𝑡 ¯𝑡𝑡 ¯𝑡, 𝑡 ¯𝑡𝑊𝑊 and 𝑡 ¯𝑡𝑊 𝑍 contributions were normalised to
theoretical cross sections at NLO in QCD including electroweak corrections [88]. The 𝑡 ¯𝑡𝑡 production was
normalised to a cross section calculated to LO in QCD.
Backgrounds such as 𝑝 𝑝→ 𝑊+𝑊+𝑊−𝑊−or 𝑝 𝑝→ 𝑊±𝑊±𝑍𝑊∓with 2ℓsc, 3ℓ or 4ℓ final states, which
have the same signature as the considered signal, have very small production cross sections times branching ratio and their contribution in the preselection, control and signal regions was found to be negligible.
The signal and background events were passed through the Geant4 [89] simulation of the ATLAS
detector [90] and reconstructed using the same algorithms as are used for the data. The effect of multiple
proton–proton interactions in the same or nearby bunch crossings (pile-up) is accounted for using inelastic
proton–proton interactions generated by Pythia 8 [91], with the A3 tune [92] and the NNPDF2.3lo PDF
set [93]. These inelastic proton–proton interactions were added to the signal and background event samples
and weighted such that the distribution of the average number of proton–proton interactions in simulation matches that observed in the data.
5 Event reconstruction
The analysis is performed in 𝑝 𝑝 collision data recorded by the ATLAS detector between 2015 and 2018. In this period, the LHC delivered colliding beams with a peak instantaneous luminosity up to
𝐿 = 2.1 × 1034cm−2s−1, achieved in 2018, and an average number of 𝑝 𝑝 interactions per bunch crossing
of 33.7. After requirements on the stability of the beams, the operational status of all ATLAS detector components, and the quality of the recorded data, the total integrated luminosity of the data set corresponds to 139 fb−1[94].
Proton–proton interaction vertices are reconstructed from charged-particle tracks with 𝑝T > 500 MeV [95,
96] in the ID. The presence of at least one such vertex with a minimum of two associated tracks is required,
and the vertex with the largest sum of 𝑝2Tof associated tracks is chosen as the primary vertex.
The anti-𝑘𝑡 algorithm [97,98] with radius parameter 𝑅 = 0.4 is used to reconstruct jets up to|𝜂| = 4.9.
are calibrated as described in Ref. [100]. Only jets with 𝑝T > 20 GeV and |𝜂| < 2.5 are considered
further. Events are removed if they contain jets induced by calorimeter noise or non-collision background, according to criteria similar to those described in Ref. [101]. Jets with 𝑝T < 60 GeV and|𝜂| < 2.4 from
pile-up interactions are suppressed using a jet-vertex tagging discriminant [102].
Jets containing 𝑏-flavored hadrons are identified in the region|𝜂| < 2.5 with the DL1r 𝑏-tagging algorithm
based on a recurrent neural network [103,104]. It makes use of the impact parameters of tracks associated
with the jet, the position of reconstructed secondary vertices and their compatibility with the decay chains of such hadrons. The 𝑏-tagging average efficiency is 70%, as measured in 𝑡 ¯𝑡 events.
Electron candidates are reconstructed as tracks in the ID matched to energy clusters in the EM calorimeter, within|𝜂| < 2.47 [105]. Only electrons with 𝑝T > 10 GeV and not in the transition region between the
barrel and endcap calorimeters (1.37 <|𝜂| < 1.52) are considered. The electron identification is based on a multivariate likelihood-based discriminant that uses the shower shapes in the EM calorimeter and the associated track properties measured in the ID. The electron candidates must satisfy the ‘Loose’ identification criteria described in Ref. [105]. Signal electrons are required to satisfy the ‘Tight’ identification [105] for
better rejection of non-prompt electrons. The electron identification efficiency varies with increasing 𝑝T
in 𝑍→ 𝑒𝑒 events, from 65% at 𝑝T = 10 GeV to 88% at 𝑝T = 100 GeV for the Tight operating point, and
from 85% at 𝑝T= 20 GeV to 95% at 𝑝T = 100 GeV for the Loose operating point.
The longitudinal impact parameter of the electron track, 𝑧0, is required to satisfy|𝑧0sin 𝜃| < 0.5 mm, where
𝜃 is the polar angle of the track. The transverse impact parameter divided by its uncertainty,|𝑑0|/𝜎(𝑑0), is
required to be less than five. For all signal electrons there must be no association with a vertex from a
reconstructed photon conversion [105] in the detector material. To further reduce the photon conversion
background in the 2ℓsc channel, additional requirements are applied to the signal electrons [4]: i) the
candidate must not have a reconstructed displaced vertex with radius 𝑟 > 20 mm whose reconstruction uses the track associated with the electron, ii) the invariant mass of the system formed by the track associated with the electron and the closest track at the primary or a conversion vertex is required to be larger than 100 MeV; this selection is referred to as the photon conversion veto.
For the signal electrons, the identification criteria are complemented by an isolation requirement, which is based on the energy in a cone around the electron candidate calculated using either reconstructed tracks or energy clusters. Electrons with wrongly reconstructed charge (charge-flip) are suppressed using a boosted decision tree discriminant exploiting additional tracks in the vicinity of the electron and track-to-cluster matching variables [105].
Muon candidates are reconstructed in the region |𝜂| < 2.5 from MS tracks matching ID tracks. The
analysis only considers muons with 𝑝T > 10 GeV satisfying the ‘Medium’ quality requirements defined in
Ref. [106]. The muon reconstruction efficiency is approximately 98% in 𝑍 → 𝜇𝜇 events. The longitudinal
impact parameter of the muon track must satisfy|𝑧0sin 𝜃| < 0.5 mm and the transverse impact parameter
must satisfy|𝑑0|/𝜎(𝑑0) < 3. For signal muons the candidate must satisfy calorimeter- and track-based
isolation requirements.
Non-prompt electrons and muons from the decays of 𝑏- and 𝑐-flavored hadrons are further rejected using a boosted decision tree discriminant based on isolation and secondary vertex information, referred to as the
non-prompt-lepton veto [107].
To avoid cases where the detector response to a single physical object is reconstructed as two different final-state objects, e.g. an electron reconstructed as both an electron and a jet, several steps are followed
Table 3: The requirements applied to define the categories of candidate leptons: loose (L), loose and minimally isolated (L∗) and tight (T) leptons. The overlap removal procedure is not applied for the candidate leptons. In the 2ℓscchannel, the photon conversion veto is required in addition to the loose and tight criteria.
Electrons Muons
Candidate L L∗ T Candidate L L∗ T
|𝑧0sin 𝜃| < 0.5 mm < 0.5 mm
|𝑑0|/𝜎 (𝑑0) < 5 < 3
Identification Loose Tight Medium
Isolation No Loose Yes No FixedCutLoose Yes
Non-prompt-lepton veto No Yes No Yes
Electron charge-flip veto No Yes N/A
to remove such overlaps, as described in Ref. [13]. The overlap removal procedure is performed using
candidate leptons.
The different lepton selections used in the analysis are summarised in Table3. Three types of signal lepton
requirements are used for both the electrons and muons: ‘tight’, ‘loose’, and ‘loose and minimally isolated’. The tight leptons, and the loose and minimally isolated leptons, are a subset of the loose leptons. The photon conversion veto is applied on top of the tight and loose electron selection requirements, only in the
2ℓscchannel. The Loose and FixedCutLoose isolation criteria applied for the loose and minimally isolated
electrons and muons are described in Refs. [105] and [106].
The missing transverse momentum, with magnitude 𝐸missT , is defined as the negative vector sum of the
transverse momenta of all identified objects (muon candidates, electron candidates and jets) and an additional soft term [108,109]. The soft term is constructed from all tracks that are matched to the primary vertex and are not associated with any other objects.
6 Event selection
Candidate events are selected for read-out using lepton triggers that require the one electron or muon to satisfy identification criteria similar to those used in the offline reconstruction, isolation criteria, and a
transverse momentum requirement of 𝑝T > 26 GeV [110,111]. With increasing 𝑝Tthe requirements on
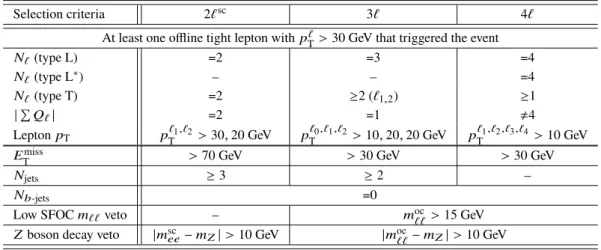
identification and isolation become less stringent. All events must contain at least one offline tight lepton with 𝑝ℓT > 30 GeV that triggered the event. The event selection proceeds in two steps: the preselection and the signal regions (SRs) selection.
The preselection is defined in Table4; the three channels (2ℓsc, 3ℓ and 4ℓ) are defined to be mutually
exclusive. Events are selected only if the absolute value of the sum of charges of the leptons is two, one, and two or zero for the 2ℓsc, 3ℓ and 4ℓ channels, respectively. In the 2ℓscchannel, the second-highest-𝑝Tlepton
is required to have 𝑝T > 20 GeV and both leptons are required to be tight. Similarly in the 3ℓ channel, each
lepton in the pair of leptons of the same charge is required to have 𝑝T > 20 GeV and be tight.
Further preselection requirements are based on 𝐸Tmiss, the jet multiplicity 𝑁jetsand the number of 𝑏-jets,
𝑁𝑏-jet. The lowest 𝐸Tmissvalue is 30 GeV in the 3ℓ and 4ℓ channels, and 70 GeV in the 2ℓscchannel; this
Table 4: The preselection criteria for the 2ℓsc, 3ℓ and 4ℓ analysis channels. The leptons are required to pass the loose (L), loose and minimally isolated (L∗) or tight (T) requirements. The leptons are ordered by decreasing 𝑝T(ℓ1, ℓ2, ...)
in the 2ℓscand 4ℓ channels, while for the 3ℓ channel ℓ1and ℓ2denote the two same-charge leptons and ℓ0denotes
the lepton with a charge opposite to the total lepton charge. 𝑄ℓdenotes the charge of each lepton. SFOC refers to same-flavour opposite-charge lepton pairs. The symbol “–” means no requirement is made. The equal sign(=) is used to emphasise that the selection criterion has to be exactly the given number.
Selection criteria 2ℓsc 3ℓ 4ℓ
At least one offline tight lepton with 𝑝Tℓ> 30 GeV that triggered the event
𝑁ℓ(type L) =2 =3 =4 𝑁ℓ(type L∗) – – =4 𝑁ℓ(type T) =2 ≥2 (ℓ1,2) ≥1 | Í 𝑄ℓ| =2 =1 ≠4 Lepton 𝑝T 𝑝 ℓ1,ℓ2 T > 30, 20 GeV 𝑝 ℓ0,ℓ1,ℓ2 T > 10, 20, 20 GeV 𝑝 ℓ1,ℓ2,ℓ3,ℓ4 T > 10 GeV 𝐸miss
T > 70 GeV > 30 GeV > 30 GeV
𝑁jets ≥ 3 ≥ 2 –
𝑁𝑏-jets =0
Low SFOC 𝑚ℓℓveto – 𝑚ocℓℓ > 15 GeV
𝑍 boson decay veto |𝑚sc
𝑒𝑒− 𝑚𝑍| > 10 GeV |𝑚ℓℓoc− 𝑚𝑍| > 10 GeV
channel only events with at least three (two) jets are considered. The background from top-quark production is highly reduced by requiring zero 𝑏-jets in the event. In order to reduce the background from Drell–Yan processes and neutral mesons, the invariant mass of same-flavour opposite-charge lepton pairs is required to be greater than 15 GeV for the 3ℓ and 4ℓ channels. The invariant mass of the same-flavour opposite-charge
lepton pair must differ from the nominal 𝑍 -boson mass by 10 GeV. For the 2ℓscchannel, the 𝑍 -boson
invariant mass veto is also applied to 𝑒±𝑒±events, in order to reduce the contributions originating from
electron charge misidentification.
In addition to 𝐸Tmissthe following variables are used to define SRs:
• The invariant mass of all selected leptons in the event, 𝑚𝑥ℓ, where 𝑥 can be 2, 3 or 4 corresponding
to the 2ℓsc, 3ℓ or 4ℓ channels.
• The invariant mass of all jets in the event, 𝑚jets. When there are more than four jets in the event, only
the leading four jets are used. This variable is only used for the 2ℓscchannel.
• The distance in 𝜂–𝜙 between two same-charge leptons, Δ𝑅ℓ±ℓ±. It is used for the 2ℓscand 3ℓ channels.
In the 4ℓ channel, two such variables can be calculated per event, Δ𝑅minℓ±ℓ±and Δ𝑅maxℓ±ℓ±, denoting the
minimum and maximum values, respectively.
• The transverse momentum of the highest-𝑝Tjet, 𝑝
leading jet
T . This variable is used in the 3ℓ channel.
• The transverse momentum of the highest-𝑝Tlepton, 𝑝
ℓ1
T. This variable is used in the 4ℓ channel.
• The azimuthal distance between the dilepton system and 𝐸miss
T , Δ𝜙ℓℓ,𝐸Tmiss. It is only used in the 2ℓ sc
channel.
• The smallest distance in 𝜂–𝜙 between any lepton and its closest jet, Δ𝑅ℓjet. This variable is used in
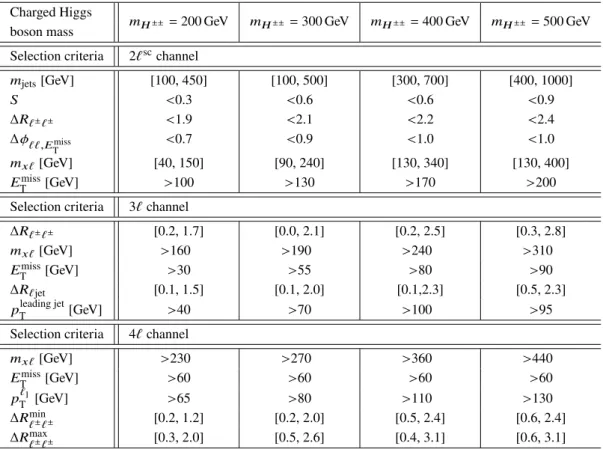
Table 5: Definition of the signal regions optimised for the study of different 𝐻±± and 𝐻± mass hypotheses. The selection is applied on top of the preselection defined in Table4. For the 𝐻±±pair production mode, the 𝑚𝐻±± = 300 GeV signal regions are also used for 𝑚𝐻±± = 350 GeV. For the 𝐻±±and 𝐻±associated production mode, the 𝑚𝐻±± = 200 GeV, 400 GeV and 500 GeV signal regions are also used for 𝑚𝐻±± = 220 GeV, 450 GeV and 550 GeV, respectively. The variables used are described in Section6.
Charged Higgs
𝑚𝐻±± = 200 GeV 𝑚𝐻±± = 300 GeV 𝑚𝐻±± = 400 GeV 𝑚𝐻±± = 500 GeV boson mass
Selection criteria 2ℓscchannel
𝑚jets[GeV] [100, 450] [100, 500] [300, 700] [400, 1000] 𝑆 <0.3 <0.6 <0.6 <0.9 Δ𝑅ℓ±ℓ± <1.9 <2.1 <2.2 <2.4 Δ𝜙ℓℓ,𝐸miss T <0.7 <0.9 <1.0 <1.0 𝑚𝑥ℓ[GeV] [40, 150] [90, 240] [130, 340] [130, 400] 𝐸miss T [GeV] >100 >130 >170 >200
Selection criteria 3ℓ channel
Δ𝑅ℓ±ℓ± [0.2, 1.7] [0.0, 2.1] [0.2, 2.5] [0.3, 2.8] 𝑚𝑥ℓ[GeV] >160 >190 >240 >310 𝐸miss T [GeV] >30 >55 >80 >90 Δ𝑅ℓjet [0.1, 1.5] [0.1, 2.0] [0.1,2.3] [0.5, 2.3] 𝑝leading jet T [GeV] >40 >70 >100 >95
Selection criteria 4ℓ channel
𝑚𝑥ℓ[GeV] >230 >270 >360 >440 𝐸miss T [GeV] >60 >60 >60 >60 𝑝ℓ1 T [GeV] >65 >80 >110 >130 Δ𝑅min ℓ±ℓ± [0.2, 1.2] [0.2, 2.0] [0.5, 2.4] [0.6, 2.4] Δ𝑅max ℓ±ℓ± [0.3, 2.0] [0.5, 2.6] [0.4, 3.1] [0.6, 3.1]
• The variable 𝑆, used for the 2ℓscchannel to describe the event topology in the transverse plane, and
defined using the spread of the 𝜙 angles of the leptons, 𝐸Tmiss, and jets as follows:
𝑆 = R(𝜙ℓ1, 𝜙ℓ2, 𝜙𝐸miss T ) · R(𝜙𝑗1 , 𝜙𝑗2,· · · ) R(𝜙ℓ1,, 𝜙ℓ2, 𝜙𝐸miss T , 𝜙𝑗1, 𝜙𝑗2,· · · ) ,
where theR is the root mean square that quantifies the spread, R(𝜙1,· · · , 𝜙𝑛) =
√︂ 1 𝑛 𝑛 Í 𝑖=1(𝜙𝑖− 𝜙) 2.
These variables are found to discriminate between the signal and the background. They exploit both the boosted decay topology of the charged Higgs bosons and the high energy of the decay products.
Signal regions are defined for each channel, as summarised in Table5. The selection criteria defining the
signal regions result from a scan of the multidimensional parameter space of the discriminating variables
mentioned above. The SRs were designed by optimising the sensitivity for the 𝐻±±pair production mode,
using the 𝑚𝐻±± = 200, 300, 400 and 500 GeV mass hypotheses. The same SRs are used to study the
𝐻±associated production mode; even though this approach is not optimal, it is still preferred instead
signal region defined for the lower mass hypotheses, since the signal discrimination power does not
vary significantly in this regime. In particular, for the 𝐻±± pair production mode the 𝑚𝐻±± = 300 GeV
signal regions are also used for 𝑚𝐻±± = 350 GeV. For the 𝐻±±and 𝐻±associated production mode, the
𝑚𝐻±± = 200 GeV, 400 GeV and 500 GeV signal regions are also used for 𝑚𝐻±± = 220 GeV, 450 GeV and
550 GeV, respectively. The SRs defined for the 2ℓscchannel are further divided into 𝑒𝑒, 𝑒 𝜇 and 𝜇𝜇 final
states. Events in the 3ℓ SRs are separated into two categories according to whether or not a same-flavour opposite-charge lepton pair exists in the event. This procedure further improves the expected significance by exploring differences in background composition and lepton-flavour composition between signal and background. The number of events observed in data is shown together with the expected signal and
estimated background yields in Section9.
7 Background estimation
The background sources can be divided into two main categories. One category is populated by the SM events which contain only reconstructed charged (prompt) leptons originating from leptonic decays of 𝑊 and 𝑍 bosons. The second category is formed by non-prompt leptons and charge-flip electrons. The non-prompt-lepton category refers to the leptons that originate from decays of 𝑏- and 𝑐-hadrons, or single pions that mimic electron signatures. The electrons from hadron decays into photons which convert into pairs of electrons in the beam pipe or detector material also enter this category. Lepton candidates reconstructed from these different sources share the properties of being less isolated, having larger impact parameters relative to the primary vertex and being less likely to satisfy the lepton identification criteria. The backgrounds from SM processes with prompt leptons are estimated with MC simulations, except for background from 𝑊 𝑍 production, for which the normalisation is corrected using data in a dedicated control region. Background from non-prompt leptons and electron charge-flip are estimated using data-based methods. Background from 𝑉 𝛾 production can contribute in the SRs if the photon converts to an electron– positron pair, and is estimated using MC simulations. Background from 𝑊𝑊 production is estimated from simulation if the two 𝑊 bosons have the same electric charge and from data if the two 𝑊 bosons have opposite electric charge, since the latter only contributes through electron charge-flip and non-prompt leptons.
7.1 Background from𝑾 𝒁 production
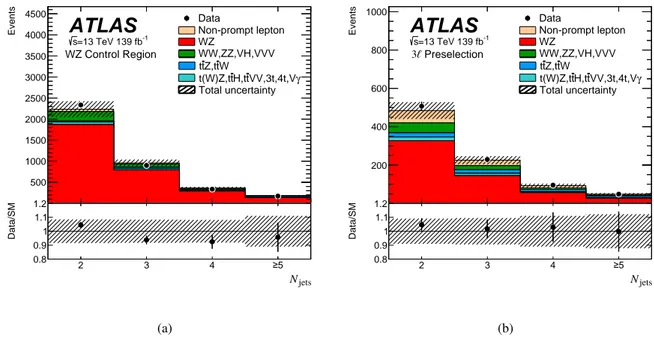
The 𝑊 𝑍 process is a dominant source of background in the 2ℓscand 3ℓ SRs. To correct a mismodelling
seen in the jet multiplicity distribution [112], a normalisation factor is computed and then applied to the
𝑊 𝑍 background events containing two or more jets. The normalisation factor is measured in a dedicated 𝑊 𝑍 control region. It is selected by requiring exactly three tight leptons with 𝑝T > 20 GeV, at least two jets
and no 𝑏-jet in the event. Finally, there must be at least one pair of same-flavour opposite-charge leptons
with a mass compatible with the 𝑍 -boson mass (|𝑚oc
ℓℓ− 𝑚𝑍| < 10 GeV). The latter criterion ensures that
the 𝑊 𝑍 control region and the 3ℓ SRs are orthogonal.
The normalisation factor is derived in a fit of a first-order polynomial, as a function of jet multiplicity, to ratios of the data event yield (subtracting all non-𝑊 𝑍 contributions) to the 𝑊 𝑍 event yield predicted in MC
simulation. The value of the polynomial at 𝑁jets= 0 is used to scale the predicted 𝑊 𝑍 yields and found is
1.5 2 2.5 3 3.5 4 4.5 5 5.5 500 1000 1500 2000 2500 3000 3500 4000 4500 Events 2 3 4 0.8 0.9 1 1.1 1.2 Data/SM Non-prompt lepton WW,ZZ,VH,VVV WZ Total uncertainty W t Z,t t t γ VV,3t,4t,V t H,t t t(W)Z,t Data =13 TeV 139 fb s -1 WZ Control Region
ATLAS
𝑁jets ≥5 (a) 1.5 2 2.5 3 3.5 4 4.5 5 5.5 200 400 600 800 1000 Events 2 3 4 0.8 0.9 1 1.1 1.2 Data/SM Non-prompt lepton WW,ZZ,VH,VVV WZ Total uncertainty W t Z,t t t γ VV,3t,4t,V t H,t t t(W)Z,t Data Preselection 3ℓs=13 TeV 139 fb -1ATLAS
𝑁jets ≥5 (b)Figure 2: Distribution of the jet multiplicity in the (a) 𝑊 𝑍 control region and in the (b) 3ℓ preselection region. The data (dots) are compared with the estimated contributions from the background sources (histograms). The normalisation factor is applied to the 𝑊 𝑍 MC contribution. The last bin includes overflows. In each figure the bottom panel shows the ratio of data to the estimated background. The hatched band around unity represents the total uncertainty of the background.
sources of systematic uncertainty are discussed in Section8. The jet multiplicity distribution in the 𝑊 𝑍
control region is shown in Figure2(a), and for illustration the distribution in the 3ℓ preselection region is
also shown in Figure2(b). The normalisation factor is applied to the 𝑊 𝑍 MC contribution. The sum of
estimated backgrounds agrees with data within the assigned systematic uncertainties.
7.2 Electron charge-flip background
In the 2ℓscchannel, a background contribution is expected from events with opposite-charge lepton pairs
where the charge of one of the leptons is misidentified. The charge-flip background is only significant for electrons and is mainly due to interactions of the electron with the ID material.
The misidentification rate is measured using a large data sample of dielectron events originating mainly
from 𝑍 → 𝑒+𝑒−decays selected by requiring two tight electrons with an invariant mass between 80 and
100 GeV. The sample contains mostly opposite-charge dielectron pairs, with a small fraction of same-charge dielectron pairs. The fraction of same-charge dielectron events is used to extract the charge misidentification rate as a function of the electron 𝑝Tand 𝜂, using the method described in Ref. [105]. This rate is found to
range between 0.01% and 4%, where higher values are obtained at large rapidities due to the larger amount of material traversed by the electrons. The statistical uncertainty of this estimate varies between 2% and 26% and is taken as a systematic uncertainty in the charge misidentification rate. The background in both the opposite-charge and same-charge samples is estimated in a cubic polynomial function fit of the high
varying the sidebands and propagates to a 3% uncertainty in the estimated charge misidentification rate. The final systematic uncertainty combines all the sources mentioned.
The charge-flip background in a given region is estimated by selecting data events with opposite-charge dilepton pairs, but otherwise identical selection, and weighting them by the probability that the charge of the electrons is misidentified. Another source of systematic uncertainty is estimated by comparing, in simulated 𝑉 +jets, 𝑡 ¯𝑡, and 𝑊𝑊 events, the number of same-charge events estimated from opposite-charge events with the prediction; it accounts for differences between the charge misidentification rates in different processes and is found to be approximately 10%. For this test, the misidentification rate was measured
using 𝑍 → 𝑒+𝑒−MC simulations, using the same method as for the measurement performed with data.
7.3 Non-prompt-lepton background
The composition of the non-prompt-lepton background in the SRs varies considerably among the analysis
channels. Therefore, the methods to estimate these contributions are different for the 2ℓsc, 3ℓ and 4ℓ
channels. In the 2ℓscand 3ℓ channels the non-prompt-lepton background is estimated using a fake-factor
method [23], while the simulation is corrected with scale factors measured in data for the 4ℓ channel.
Non-prompt-lepton background estimate for the 2ℓscchannel
The estimate of the background from non-prompt leptons assumes that these contributions can be extrapolated from a control region enriched in non-prompt leptons with a so-called fake factor. The control region is selected using the kinematic requirements of the preselection or the signal regions but alternative lepton selection criteria. The latter means that at least one of the selected leptons is required to satisfy the loose but not the tight lepton requirements.
The fake factors are calculated separately for electrons and muons in control regions with kinematic selections designed to enhance their content in non-prompt leptons. This is achieved by applying the
preselection requirements of the 2ℓscchannel, except that 𝐸missT must be lower than 70 GeV. Only events
with electron and muon same-charge pairs are then used. The fake factor is defined as ratio of the number of events in the control region with all the selected leptons required to pass the tight signal requirements, to the number of events in the same region but with one of the selected leptons satisfying alternative lepton
requirements. The measurement is performed as a function of the lepton 𝑝T. The fake factor dependency
on the lepton 𝜂 was also checked and found to be negligible. The SM processes with prompt leptons and the charge-flip contributions are subtracted in the control region. For the electron and muon fake-factor
measurements, the lepton with the second highest 𝑝T is assumed to be the non-prompt one.
The measured fake factors are 0.03± 0.01 for electrons and muons up to 𝑝T = 40 GeV, and increase to
0.16± 0.05 and 0.09 ± 0.02, respectively, for electrons and muons with 𝑝T > 60 GeV. The uncertainties
are statistical only. A systematic uncertainty of 20% (10%) in the electron (muon) fake factor is estimated by studying the variation of the fake factor with 𝐸Tmiss. For this measurement two 𝐸Tmissbins are considered, < 70 GeV and > 70 GeV. This uncertainty accounts for the different compositions of the non-prompt leptons in the control region and the SRs. Another source of systematic uncertainty accounts for how
often the non-prompt lepton is actually the one with the highest lepton 𝑝Tand not the one with the second
highest 𝑝T, as assumed. It is estimated from generator-level studies performed with MC simulations.
This source is dominant in the region with the lepton 𝑝T > 60 GeV, where the uncertainty reaches 45%
(80%) for electrons (muons). Uncertainties in the SM processes with prompt leptons (approximately 20%) and electron charge-flip (15%) background subtraction are also included. The overall uncertainty
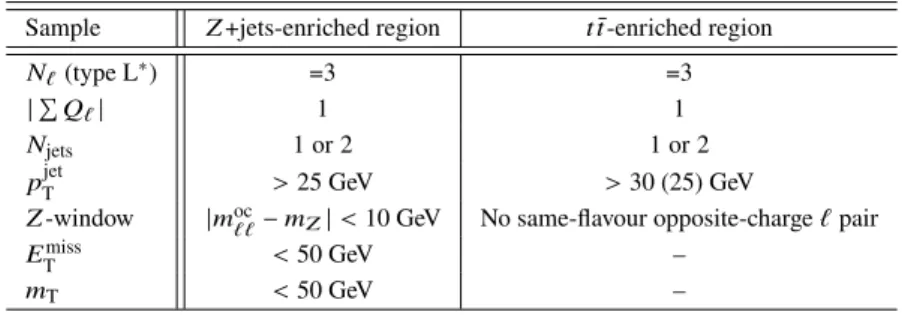
Table 6: The selection criteria that define the control regions enriched in non-prompt leptons used to determine the MC scale factors for the 4ℓ channel. The leptons are required to pass the loose and minimally isolated (L∗) requirements. The transverse mass, 𝑚T, is calculated as the invariant mass of the vector sum of the transverse
momentum of the non-prompt-lepton candidate and the missing transverse momentum. The symbol “–” means no requirement is made. The equal sign(=) is used to emphasise that the selection criterion has to be exactly the given number.
Sample 𝑍 +jets-enriched region 𝑡 ¯𝑡-enriched region
𝑁ℓ(type L∗) =3 =3 | Í 𝑄ℓ| 1 1 𝑁jets 1 or 2 1 or 2 𝑝jet T > 25 GeV > 30 (25) GeV 𝑍 -window |𝑚oc
ℓℓ− 𝑚𝑍| < 10 GeV No same-flavour opposite-charge ℓ pair
𝐸miss
T < 50 GeV –
𝑚T < 50 GeV –
amounts to approximately 30% (20%) and 55% (85%) for the fake factors for electrons (muons) with 20 < 𝑝T < 60 GeV and 𝑝T > 60 GeV, respectively.
Non-prompt-lepton background estimate for the 3ℓ channel The same method as the one employed for the 2ℓscchannel is used in the 3ℓ channel. Here the opposite-charge lepton ℓ0passes the loose selection,
and it is assumed to be prompt, an assumption that is found to be valid in MC simulation. The control region used to calculate the fake factors uses the 3ℓ preselection requirements, except that exactly one jet is required. Only events with electron and muon same-charge pairs are then used. The muon fake
factor is found to be 0.032± 0.009 and the electron fake factor is found to be 0.021 ± 0.009, where the
uncertainties are statistical only. A systematic uncertainty of 15% is estimated by measuring the lepton fake factor in a control region enriched in events from 𝑡 ¯𝑡 production. This uncertainty accounts for the different compositions of the non-prompt leptons in the control region and the SRs. Uncertainties in the subtraction of the SM processes with prompt leptons are found to be approximately 55% (45%) for the electron (muon) fake factor. Another 20% uncertainty comes from generator-level studies performed with MC simulations
to test the assumption that ℓ0is a prompt lepton. The fake factors’ dependency on the lepton 𝑝Tis also
studied, and the deviations from the nominal fake factors are within the statistical uncertainty. When all sources of systematic uncertainty are combined, the total systematic uncertainty of the electron (muon) fake factor is found to be 60% (50%).
Non-prompt-lepton background estimate for the 4ℓ channel There are too few data events to use the fake-factor method in the 4ℓ channel. Instead, the non-prompt-lepton yields are estimated from simulation corrected using scale factors that are extracted in control regions enriched in non-prompt leptons. The main sources of non-prompt leptons are 𝑏- and 𝑐-hadron decays. For electrons a small component from light-flavour hadrons is also present, while for muons this component is negligible. The scale factor is measured separately for non-prompt leptons from 𝑏-hadron decays and light-flavour hadrons.
Two data samples enriched in non-prompt leptons originating from 𝑍 +jets and 𝑡 ¯𝑡 events are used to study how well the MC simulations describe the non-prompt leptons originating from light-flavour (LF) and
𝜆𝑒
HF, 𝜆 𝑒
LFand 𝜆
𝜇
HF, are obtained by solving the system of equations:
𝑁Data|𝑍+jets𝑒 − 𝑁Prompt|𝑍+jets𝑒 = 𝜆𝑒 HF𝑁 𝑒 HF|𝑍+jets+ 𝜆 𝑒 LF𝑁 𝑒 LF|𝑍+jets , 𝑁Data|𝑡𝑡𝑒 − 𝑁Prompt|𝑡𝑡𝑒 = 𝜆𝑒 HF𝑁 𝑒 HF|𝑡𝑡+ 𝜆 𝑒 LF𝑁 𝑒 LF|𝑡𝑡 , 𝑁𝜇 Data|𝑡𝑡− 𝑁 𝜇 Prompt|𝑡𝑡− 𝑁 𝜇 LF|𝑡𝑡 = 𝜆 𝜇 HF𝑁 𝜇 HF|𝑡𝑡 ,
with the event yields 𝑁ℓ, ℓ = 𝑒, 𝜇 in data (Data), and the background from prompt leptons (Prompt),
light-flavour leptons (LF) and heavy-flavour leptons (HF), in the 𝑡𝑡-enriched (𝑡𝑡) and the 𝑍 +jets-enriched (𝑍 +jets) control regions.
The scale factors are measured to be 𝜆𝑒HF= 0.98 ±0.18, 𝜆𝑒LF= 1.34 ±0.17 and 𝜆HF𝜇 = 0.94 ±0.04, where the uncertainties are statistical only. Systematic uncertainties of 5%, 4% and 2% for the 𝜆𝑒HF, 𝜆𝑒LFand 𝜆𝜇HFscale factors, respectively, are estimated by varying the jet multiplicity and the lepton 𝑝Tthreshold in the nominal
𝑍+jets- and 𝑡 ¯𝑡-enriched control regions. These uncertainties account for the different compositions of the non-prompt leptons in the control regions and the SRs. Uncertainties in the prompt-lepton subtraction are dominated by theoretical uncertainties. The total systematic uncertainties combine all the sources mentioned and are approximately 6%, 15% and 4% for the 𝜆𝑒HF, 𝜆𝑒LFand 𝜆𝜇HFscale factors, respectively.
7.4 Validation
The data-based methods employed to estimate the backgrounds are validated by comparing the event yields in data with the combined predictions for these backgrounds, added to MC predictions for SM processes
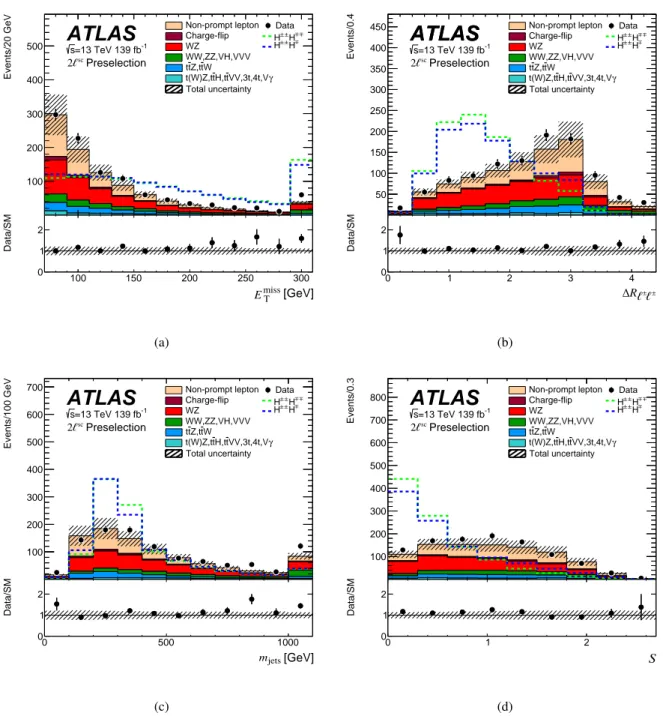
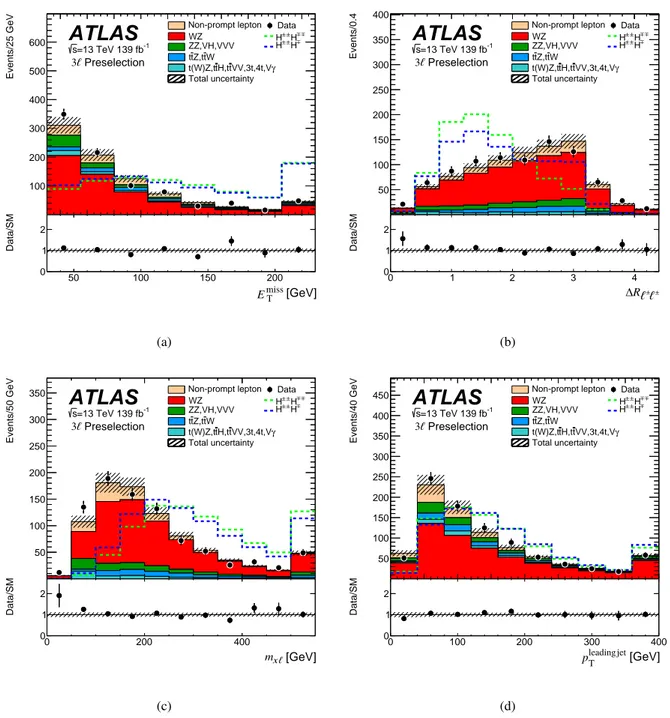
with prompt signal leptons. Distributions of selected variables in the 2ℓsc, 3ℓ and 4ℓ channels are shown
in Figures3,4and5, respectively, after the preselection requirements from Table4are applied. Good
agreement is observed in both normalisation and shape, demonstrating that the background contributions
are well estimated. The expected distributions of both signal models are shown for 𝑚𝐻±±= 300 GeV to
illustrate the discrimination power of the selected variables.
The signal contamination at the preselection level was studied for 𝑚𝐻±± = 300 GeV and 𝑚𝐻±± = 200 GeV
mass hypotheses, corresponding to the 𝐻±±pair production mode and the 𝐻±±and 𝐻±associated production
mode, respectively. These mass hypotheses were selected because they are close to the sensitive mass
range of the current analysis. A maximum value of 8.5% (2%) 𝐻±±𝐻∓∓(𝐻±±𝐻∓) signal contamination
was found in all the individual 2ℓsc, 3ℓ and 4ℓ channels at preselection level.
8 Systematic uncertainties
Uncertainties in the signal and background yields arise from experimental uncertainties and from the theoretical accuracy of the prediction of the SM background yields. The experimental uncertainties arise from the luminosity determination, modelling of pile-up interactions, the reconstruction and identification of electrons, muons and jets and from the uncertainties associated with the data-based methods that are used to estimate the non-prompt lepton and charge-flip electron backgrounds.
The uncertainty in the combined 2015–2018 integrated luminosity is 1.7% [113], obtained using the
LUCID-2 detector [114] for the primary luminosity measurements. Uncertainties in the modelling of
100 150 200 250 300 100 200 300 400 500 Events/20 GeV 100 150 200 250 300 0 1 2 Data/SM =13 TeV 139 fb s -1 Total uncertainty Data H±±H∓∓ H±±H∓ Non-prompt lepton Charge-flip WZ W t Z,t t t WW,ZZ,VH,VVV γ VV,3t,4t,V t H,t t t(W)Z,t Preselection 2ℓsc 𝐸missT [GeV]
ATLAS
(a) 0 1 2 3 4 50 100 150 200 250 300 350 400 450 Events/0.4 0 1 2 3 4 0 1 2 Data/SM =13 TeV 139 fb s -1 Total uncertainty Data H±±H∓∓ H±±H∓ Non-prompt lepton Charge-flip WZ W t Z,t t t WW,ZZ,VH,VVV γ VV,3t,4t,V t H,t t t(W)Z,tATLAS
Δ𝑅ℓ±ℓ± Preselection 2ℓscATLAS
(b) 0 500 1000 100 200 300 400 500 600 700 Events/100 GeV 0 500 1000 0 1 2 Data/SM =13 TeV 139 fb s -1 Total uncertainty Data H±±H∓∓ H±±H∓ Non-prompt lepton Charge-flip WZ W t Z,t t t WW,ZZ,VH,VVV γ VV,3t,4t,V t H,t t t(W)Z,t 𝑚jets [GeV] Preselection 2ℓscATLAS
(c) 0 1 2 100 200 300 400 500 600 700 800 Events/0.3 0 1 2 0 1 2 Data/SM =13 TeV 139 fb s -1 Total uncertainty Data H±±H∓∓ H±±H∓ Non-prompt lepton Charge-flip WZ W t Z,t t t WW,ZZ,VH,VVV γ VV,3t,4t,V t H,t t t(W)Z,tATLAS
𝑆 Preselection 2ℓsc (d)Figure 3: Distribution of selected variables used to define the 2ℓscSRs. The events are selected with the preselection requirements listed in Table4. The data (dots) are compared with the expected contributions from the relevant background sources (histograms). The expected signal distributions for 𝑚𝐻±± = 300 GeV are also shown, scaled to the observed number of events. The last bin includes overflows. In each figure the bottom panel shows the ratio of data to the estimated background. The hatched band around unity represents the total uncertainty of the background.
per bunch crossing in the simulation, such that the average number of interactions changes by±9%. The
impact of these uncertainties on the background event yields estimated from MC simulation is found to be lower than 2%.
40 60 80 100 120 140 160 180 200 220 100 200 300 400 500 600 Events/25 GeV 50 100 150 200 0 1 2 Data/SM Non-prompt lepton ZZ,VH,VVV WZ Total uncertainty W t Z,t t t γ VV,3t,4t,V t H,t t t(W)Z,t Data H±±H∓∓ H±±H∓ =13 TeV 139 fb s -1 Preselection 3ℓ 𝐸missT [GeV]
ATLAS
(a) 0 1 2 3 4 50 100 150 200 250 300 350 400 Events/0.4 0 1 2 3 4 0 1 2 Data/SM Non-prompt lepton ZZ,VH,VVV WZ Total uncertainty W t Z,t t t γ VV,3t,4t,V t H,t t t(W)Z,t Data H±±H∓∓ H±±H∓ =13 TeV 139 fb s -1 Preselection 3ℓ Δ𝑅ℓ±ℓ±ATLAS
(b) 0 200 400 50 100 150 200 250 300 350 Events/50 GeV 0 200 400 0 1 2 Data/SM Non-prompt lepton ZZ,VH,VVV WZ Total uncertainty W t Z,t t t γ VV,3t,4t,V t H,t t t(W)Z,t Data H±±H∓∓ H±±H∓ =13 TeV 139 fb s -1 Preselection 3ℓ 𝑚𝑥ℓ [GeV]ATLAS
(c) 0 50 100 150 200 250 300 350 400 50 100 150 200 250 300 350 400 450 Events/40 GeV 0 100 200 300 400 0 1 2 Data/SM Non-prompt lepton ZZ,VH,VVV WZ Total uncertainty W t Z,t t t γ VV,3t,4t,V t H,t t t(W)Z,t Data H±±H∓∓ H±±H∓ =13 TeV 139 fb s -1 Preselection 3ℓ 𝑝Tleadingjet [GeV]ATLAS
(d)Figure 4: Distribution of selected variables used to define the 3ℓ SRs. The events are selected with the preselection requirements listed in Table4. The data (dots) are compared with the expected contributions from the relevant background sources (histograms). The expected signal distributions for 𝑚𝐻±± = 300 GeV are also shown, scaled to the observed number of events. The last bin includes overflows. In each figure the bottom panel shows the ratio of data to the estimated background. The hatched band around unity represents the total uncertainty of the background.
and resolutions, and the uncertainties of the 𝐸Tmisssoft term [108]. The overall impact on the background from SM processes with prompt leptons and the signal yields in the SRs from these systematic uncertainties is found to be lower than 10%. The dominant contribution comes from the jet energy scale component. The uncertainties in the efficiencies of the electron [116] and muon [106] reconstruction, identification and
50 100 150 10 20 30 40 50 Events/15 GeV 50 100 150 0 1 2 Data/SM Non-prompt lepton ZZ WW,WZ,VH,VVV W t Z,t t t γ VV,3t,4t,V t H,t t t(W)Z,t Data Total uncertainty H±±H∓∓ H±±H∓ Preselection =13 TeV 139 fb s -1 4ℓ 𝐸missT [GeV]
ATLAS
(a) 0 1 2 3 4 5 10 15 20 25 30 Events/0.4 0 1 2 3 4 0 1 2 Data/SM Non-prompt lepton ZZ WW,WZ,VH,VVV W t Z,t t t γ VV,3t,4t,V t H,t t t(W)Z,t Data Total uncertainty H±±H∓∓ H±±H∓ Preselection =13 TeV 139 fb s -1 4ℓ Δ𝑅ℓmin±ℓ±ATLAS
(b) 200 400 600 5 10 15 20 25 30 35 40 Events/60 GeV 200 400 600 0 1 2 Data/SM Non-prompt lepton ZZ WW,WZ,VH,VVV W t Z,t t t γ VV,3t,4t,V t H,t t t(W)Z,t Data Total uncertainty H±±H∓∓ H±±H∓ Preselection =13 TeV 139 fb s -1 4ℓ 𝑚𝑥ℓ [GeV]ATLAS
(c) 50 100 150 200 10 20 30 40 50 Events/20 GeV 50 100 150 200 0 1 2 Data/SM Non-prompt lepton ZZ WW,WZ,VH,VVV W t Z,t t t γ VV,3t,4t,V t H,t t t(W)Z,t Data Total uncertainty H±±H∓∓ H±±H∓ Preselection =13 TeV 139 fb s -1 4ℓ [GeV] 𝑝ℓ1 TATLAS
(d)Figure 5: Distribution of selected variables used to define the 4ℓ SRs. The events are selected with the preselection requirements listed in Table4. The data (dots) are compared with the expected contributions from the relevant background sources (histograms). The expected signal distributions for 𝑚𝐻±± = 300 GeV are also shown, scaled to the observed number of events. The last bin includes overflows. In each figure the bottom panel shows the ratio of data to the estimated background. The hatched band around unity represents the total uncertainty of the background.
trigger are also included. Their impact on the estimated yields in the SRs for the signal and the background from SM processes with prompt leptons is lower than 5%. The uncertainties in the 𝑏-jet identification are found to be negligible.
𝑒𝑒 and 𝑒𝜇 channels. The uncertainties in the non-prompt-lepton contributions in the SRs are between 25%
and 90% and include the uncertainties described in Section7.3, and statistical uncertainties in the control
regions where the contributions are estimated.
For the background from 𝑍 𝑍 , 𝑊𝑊 and 𝑉𝑉𝑉 multiboson processes, and 𝑉 𝛾, 𝑡 𝑍 and 𝑡 ¯𝑡𝑋 processes (𝑡 ¯𝑡𝑊 , 𝑡 ¯𝑡𝑍, 𝑡 ¯𝑡𝐻), the systematic uncertainties due to higher-order QCD corrections are evaluated by varying the renormalisation and factorisation scales independently by factors of two and one-half, and removing
combinations where the variations differ by a factor of four. The uncertainties due to the PDF and the 𝛼s
value used in the PDF determination are evaluated using the PDF4LHC prescription [117]. In the SRs
defined for 𝑚𝐻±± = 300 GeV, the theory uncertainty in the background yields from 𝑍 𝑍 and 𝑊𝑊 processes
varies between 15% and 40%. For the background from 𝑉𝑉𝑉 it is approximately 10%, for the background from 𝑉 𝛾 it is approximately 35% and for the 𝑡 𝑍 and 𝑡 ¯𝑡𝑋 processes it is approximately 14%.
The total uncertainty in the estimated 𝑊 𝑍 yields is 9% and includes the statistical uncertainty as well as two sources of theoretical uncertainty. Systematic uncertainties due to higher-order QCD corrections are evaluated using the same prescription as for the other diboson processes, and are found to be 3%. The
second source is evaluated by comparing the results obtained with the linear fit model (Section7.1) in
the 𝑊 𝑍 control region, and in a region defined with the 𝑊 𝑍 control region requirements except that three jets must be in the event. This uncertainty is found to be 8.4%. To validate the assigned uncertainty, several checks are performed. The linear fit function is changed to a quadratic one to check the quality of the fit model. The fit parameterisation is studied in the 𝑊 𝑍 -enriched region and in a region defined with the 𝑊 𝑍 control region requirements except that three jets must be in the event. The differences between the obtained results are found to be covered by the total uncertainty. The choice of parton shower model is studied in the 𝑊 𝑍 control region by comparing event samples simulated with Sherpa v2.2.1 and MadGraph5_aMC@NLO, and the differences are found to be covered by the total uncertainty. For the 𝑊 𝑍 background in regions with lower jet multiplicities, the uncertainty is estimated with the same methodology as for the other diboson processes described above.
An uncertainty of 50% is assigned to the other backgrounds (𝑡 ¯𝑡𝑡, 𝑡 ¯𝑡𝑡 ¯𝑡, 𝑡 ¯𝑡𝑊𝑊 and 𝑉 𝐻), This large value is assigned to cover uncertainties from missing higher-order corrections and the PDF sets. Since these processes produce a larger number of jets at the first order of the perturbative expansion, they are less sensitive to parton shower modelling uncertainties.
The relative uncertainty in the background yields obtained in a fit of background to the observed data is
shown in Figure6for all SRs. The statistical uncertainties originate from the limited number of preselected
and opposite-charge data events used in the fake-factor method and the charge-flip electron background estimate, respectively, as well as the effect of the limited number of simulated events for SM processes with prompt leptons. The total uncertainty is computed using all sources of uncertainty, and they are treated as uncorrelated. The uncertainties range from 10% to 30% and are dominated by the statistical
uncertainties in the non-prompt-lepton estimate and the theory uncertainties. An exception is the 2ℓsc
SR defined for 𝑚𝐻±± = 300 GeV, where the uncertainties from most sources are of similar size. The
uncertainties associated with the charge-flip background are small in all 2ℓscSRs. In the 4ℓ channel, the
statistical uncertainty of the non-prompt leptons comes from the limited number of events in the 𝑍 +jets, 𝑡 ¯𝑡 and 𝑡𝑊 MC simulation samples.
The theoretical uncertainties in the predicted signal yields arise from the parton shower model, missing higher-order corrections, and parton distribution functions. The systematic uncertainty due to the parton shower model is evaluated by comparing event samples simulated by Pythia 8 using the A14 tune with
3 − 10 2 − 10 1 − 10 1 10 Relative uncertainty 3ℓ 4ℓ 3ℓ 4ℓ 3ℓ 4ℓ 3ℓ 4ℓ = 500 GeV = 400 GeV = 300 GeV = 200 GeV ±± 𝑚𝐻 𝑚𝐻±± 𝑚𝐻±± 𝑚𝐻±± sc sc sc sc
ATLAS
-1 =13 TeV 139 fb s Total uncertainty MC statistical unct.Background normalisation unct. Experimental unct.
Non-prompt lepton stat Non-prompt lepton syst Charge-flip stat
Charge-flip syst
Figure 6: Contributions from different categories of uncertainties relative to the expected background yields in the defined SRs. The uncertainties are shown for the combination of the individual channels of the 2ℓsc, 3ℓ and 4ℓ SRs. The 𝑚𝐻±± = 220 GeV, 350 GeV and 450 GeV signal hypotheses use the signal regions defined for the 𝑚𝐻±± = 200 GeV, 300 GeV and 400 GeV signal. The 𝑚𝐻±± = 550 GeV and 𝑚𝐻±± = 600 GeV signal hypotheses use the signal regions defined for the 𝑚𝐻±± = 500 GeV signal. The SRs are indicated along the horizontal axis.
SS2L200 Trilep200 Fourlep200 SS2L300 Trilep300 Fourlep300 SS2L400 Trilep400 Fourlep400 SS2L500 Trilep500 Fourlep500
channel Charge-flip Non-Prompt lepton WZ ZZ WW,VH,VVV Z t W,t t t γ VV,3t,4t,V t H,t t t(W)Z,t Data Total uncertainty
ATLAS
-1 =13 TeV 139 fb s Yield Data/SM 0 5 15 20 25 30 35 0 1 2 10 3ℓ 4ℓ 3ℓ 4ℓ 3ℓ 4ℓ 3ℓ 4ℓ = 500 GeV = 400 GeV = 300 GeV = 200 GeV ±± 𝑚𝐻 𝑚𝐻±± 𝑚𝐻±± 𝑚𝐻±± sc sc sc scFigure 7: Data event yields compared with the expected contributions from relevant background sources, for the combination of the individual channels of the 2ℓsc, 3ℓ and 4ℓ SRs. The 𝑚𝐻±± = 220 GeV, 350 GeV and 450 GeV signal hypotheses use the signal regions defined for the 𝑚𝐻±± = 200 GeV, 300 GeV and 400 GeV signal. The 𝑚𝐻±± = 550 GeV and 𝑚𝐻±± = 600 GeV signal hypotheses use the signal regions defined for the 𝑚𝐻±± = 500 GeV signal. The total uncertainties in the expected event yields are shown as the hatched bands.
5%. The uncertainties due to the PDFs are found to be less than 5%. The uncertainty due to missing
higher-order corrections is less than 10% [52]. When those uncertainties are combined in quadrature, an