HAL Id: inserm-01147406
https://www.hal.inserm.fr/inserm-01147406
Submitted on 30 Apr 2015HAL is a multi-disciplinary open access archive for the deposit and dissemination of sci-entific research documents, whether they are pub-lished or not. The documents may come from teaching and research institutions in France or abroad, or from public or private research centers.
L’archive ouverte pluridisciplinaire HAL, est destinée au dépôt et à la diffusion de documents scientifiques de niveau recherche, publiés ou non, émanant des établissements d’enseignement et de recherche français ou étrangers, des laboratoires publics ou privés.
accelerometer-assessed physical activity: the role of
sociodemographic factors.
Séverine Sabia, Vincent van Hees, Martin Shipley, Michael Trenell, Gareth
Hagger-Johnson, Alexis Elbaz, Mika Kivimaki, Archana Singh-Manoux
To cite this version:
Séverine Sabia, Vincent van Hees, Martin Shipley, Michael Trenell, Gareth Hagger-Johnson, et al.. Association between questionnaire- and accelerometer-assessed physical activity: the role of sociode-mographic factors.. American Journal of Epidemiology, Oxford University Press (OUP), 2014, 179 (6), pp.781-90. �10.1093/aje/kwt330�. �inserm-01147406�
Practice of Epidemiology
Association Between Questionnaire- and Accelerometer-Assessed Physical
Activity: The Role of Sociodemographic Factors
Séverine Sabia*, Vincent T. van Hees*, Martin J. Shipley, Michael I. Trenell, Gareth
Hagger-Johnson, Alexis Elbaz, Mika Kivimaki, and Archana Singh-Manoux
* Correspondence to Dr. Séverine Sabia, Department of Epidemiology and Public Health, University College London, 1-19 Torrington Place,
London WC1E 6BT, United Kingdom (e-mail: [email protected]); or Dr. Vincent T. van Hees, MoveLab—Physical Activity and Exercise Research,
Institute of Cellular Medicine, Newcastle University, Newcastle upon Tyne NE2 4HH, United Kingdom (e-mail: [email protected]). Initially submitted September 27, 2013; accepted for publication December 4, 2013.
The correlation between objective and self-reported measures of physical activity varies between studies. We examined this association and whether it differed by demographic factors or socioeconomic status (SES). Data
were from 3,975 Whitehall II (United Kingdom, 2012–2013) participants aged 60–83 years, who completed a
phys-ical activity questionnaire and wore an accelerometer on their wrist for 9 days. There was a moderate correlation
between questionnaire- and accelerometer-assessed physical activity (Spearman’s r = 0.33, 95% confidence
inter-val: 0.30, 0.36). The correlations were higher in high-SES groups than in low-SES groups (P’s = 0.02), as defined by
education (r = 0.38 vs. r = 0.30) or occupational position (r = 0.37 vs. r = 0.29), but did not differ by age, sex, or mar-ital status. Of the self-reported physical activity, 68.3% came from mild activities, 25% from moderate activities, and only 6.7% from vigorous activities, but their correlations with accelerometer-assessed total physical activity were
comparable (range of r’s, 0.21–0.25). Self-reported physical activity from more energetic activities was more
strongly associated with accelerometer data (for sports, r = 0.22; for gardening, r = 0.16; for housework, r = 0.09). High-SES persons reported more energetic activities, producing stronger accelerometer associations in these groups. Future studies should identify the aspects of physical activity that are most critical for health; this involves better understanding of the instruments being used.
accelerometry; cohort studies; elderly; epidemiologic methods; physical activity; questionnaires
Abbreviations: CI, confidence interval; MET, metabolic equivalent; SES, socioeconomic status.
Physical inactivity has a deleterious effect on health; it is estimated that a 25% decrease in its prevalence would prevent over 1.3 million deaths worldwide every year (1). However, these estimates are imprecise, as much of the evidence comes from self-reported data on physical activity (2). The Spear-man correlation (r) between objectively measured physical activity (e.g., accelerometry, doubly labeled water, heart rate monitoring) and activity measured via questionnaire var-ies between studvar-ies and ranges from−0.71 to 0.96 (3–5), but it is typically low to moderate (mean across studies: r = 0.37; standard deviation, 0.25) (4). The reasons for this inconsis-tency are poorly understood. Differences in the measurement instruments used (4,6,7) and the sociodemographic character-istics of study populations (such as age, sex, and education)
might affect the association, although their role remains un-clear (4,8–15).
Our aim in the present study was to examine whether the correlation between questionnaire-assessed and accelerometer-assessed physical activity differed by sociodemographic factors in a large British cohort. In addition, we assessed the potential influence of level and type of physical activity reported.
METHODS Study population
Data were drawn from the Whitehall II Study, a United Kingdom cohort study of 10,308 persons (67% men) aged
American Journal of Epidemiology
© The Author 2014. Published by Oxford University Press on behalf of the Johns Hopkins Bloomberg School of Public Health. This is an Open Access article distributed under the terms of the Creative Commons Attribution Non-Commercial License (http://creativecommons.org/licenses/by-nc/3.0), which permits unrestricted reuse, distribution, and reproduction in anymedium, provided the original work is properly cited.
Vol. 179, No. 6 DOI: 10.1093/aje/kwt330 Advance Access publication: February 4, 2014
by guest on March 12, 2015
http://aje.oxfordjournals.org/
35–55 years that was established in 1985–1988 (16). Partic-ipants gave written informed consent, and the University Col-lege London ethics committee approved the study protocol. Since the study’s inception, sociodemographic, behavioral, and health-related factors, including self-reported physical activity, have been assessed approximately every 5 years
(1985–1988, 1991–1993, 1997–1999, 2002–2004, 2007–
2009 and 2012–2013). Accelerometry measurements were
added to the study during the 2012–2013 wave of data collec-tion for participants seen at the central London clinic and those living in the southeastern regions of England, who were screened at home.
Questionnaire-based assessment of physical activity
For questionnaire assessment of physical activity, we used a modified version of a previously validated questionnaire, the Minnesota Leisure Time Physical Activity Questionnaire (17,18). The questionnaire instructions stated,“We would like to know about your activities at work and in your free time that involve physical activity.” It included 20 items on the amount of time spent in the following activities: walking, sports (cycling, soccer, golf, swimming, and 2 open-ended
questions on“other sports”), gardening (weeding, mowing,
and 1 open-ended question on“other gardening activities”), housework (carrying heavy shopping items, cooking,
hang-ing out washhang-ing, and 2 open-ended questions on “other
housework”), and do-it-yourself activity (building, modify-ing, or repairing something without the aid of experts or professionals, such as manual car-washing, painting, or dec-orating, and 1 open-ended question on“other do-it-yourself activity”), as well as 2 open-ended questions on “other activ-ities.” For each item, participants were required to take into account activity patterns over the past 4 weeks to give an in-dication of their usual activity and to provide the total number of hours spent in that activity per week (19).
For each activity, including open-ended items, we assigned a metabolic equivalent (MET) value by using a compendium of activity energy costs (20). One MET reflects the intensity of an activity relative to lying quietly. Each activity was as-signed a MET value. For values lower than 3 METs (e.g., dish-washing, boating), the activity was recoded as mild physical activity; for values ranging from 3 METs to 5.9 METs (e.g., cycling, weeding), the activity was recoded as moderate physical activity; and for values of 6 METs or above (e.g., swimming, mowing), the activity was recoded as vigorous physical activity. Overall physical activity level was estimated in MET-hours/week, the sum of the product of the intensity (MET) and weekly duration (hours/week) of all activities reported. We also calculated the number of MET-hours/week spent at different levels of physical activity (mild, moderate, or vigorous) and in each type of physical ac-tivity: walking, sports, gardening, housework, do-it-yourself activities, and other activities (21).
Accelerometer-assessed physical activity
For accelerometer assessment of physical activity, a wrist-worn triaxial accelerometer (GeneActiv; Activinsights Ltd., Cambs, United Kingdom) was used, and participants were
asked to wear the accelerometer on their nondominant wrist nonstop for 9 consecutive 24-hour days. The accelerometer was sampled at 87.5 Hz, and data were stored in gravity (g) units (1 g = 9.81 m/second²). Calibration error was estimated on the basis of static periods in the data and corrected if nec-essary (22). The Euclidean norm (magnitude) of the 3 raw signals minus 1 g, with negative numbers rounded to zero, was used to quantify the acceleration related to the movement registered and was expressed in milligrams (23). Participants were also asked to complete a diary in addition to wearing the accelerometer to report overnight sleep periods (falling asleep/standing-up times), cycling, and nonwear time.
Accelerometer data were processed in R (R Core Team, Vienna, Austria) using the software package GGIR and were managed on MOVEeCloud (MoveLab, Newcastle Uni-versity, Newcastle-upon-Tyne, United Kingdom), a cloud computing system for physical activity research (24). Data
extracted between thefirst midnight and the last midnight
were retained for the analysis, leading to a maximum of 24-hour measurements for 8 days. Participants were included in the analysis if they had data for≥16 hours/day from at least 2 weekdays and 2 weekend days. As in other studies (23,25), accelerometer nonwear time was estimated on the basis of the standard deviation and value range of each accelerometer axis, calculated for moving windows of 60 minutes with 15-minute increments. A time window was classified as non-wear time if, for at least 2 out of the 3 axes, the standard de-viation was less than 13.0 mg (1 mg = 0.00981 m/second2) or if the value range was less than 50 mg. A more detailed description of this technique can be found in a previous pub-lication (23). For each participant, for each 15-minute period detected as device nonwear time, data were replaced by their own data from the same time of day, averaged across the other recorded days to provide a person-specific informed approach (based on activity at the same time on other days) to imputing data (25). This method does not equate nonwear time with inactivity or assume that daily wear time is representative of the rest of the day (25,26).
Because the observation period covered 8 days, the data were recoded so that our measure reflected physical activity over the course of 1 week to match the self-reported weekly physical ac-tivity. If a participant had 3 weekend days or 6 weekdays, the wrist accelerations of thefirst and last full days of measurement (for example, 2 Tuesdays 1 week apart) were averaged to rep-resent 1 unique day. The average of the wrist acceleration over weekdays (even if less than 5) was calculated to represent daily weekday physical activity level, and the same was done for weekend days. Thus, the weekly accelerometer-assessed total physical activity (mg/week) was calculated as: [(5 × mean daily weekday wrist acceleration) + (2 × mean daily weekend
wrist acceleration)]. Only days with ≥16 hours per day of
wear, the“valid days,” were included in this calculation.
Sociodemographic factors
Demographic variables included age, sex, ethnicity (white, South Asian, black, or other), and marital status (married/co-habiting, single, widowed, or divorced/separated). Results for participants reporting“other” ethnicity were not analyzed be-cause of small numbers in this category (n = 31).
by guest on March 12, 2015
http://aje.oxfordjournals.org/
Socioeconomic status (SES) measures included occupa-tional position at age 50 years and education. Education was the highest qualification attained upon leaving full-time education and was categorized as less than primary school (up to age 11 years), lower secondary school (up to age 16 years), higher secondary school (up to age 18 years), or uni-versity degree or higher. Occupational position was defined using the British civil service employment grade as high (ad-ministrative), intermediate ( professional or executive), or low (clerical or support). This measure in the Whitehall II data is a comprehensive marker of socioeconomic circumstances and is related to salary, social status, and level of responsibility at work.
Statistical analysis
In order to show agreement between physical activity as-sessed by questionnaire (MET-hours/week) and accelerome-try (mg/week), wefirst compared tertiles of these measures using theκ index. Because of nonnormality of the physical activity measures, we used Spearman correlations between MET-hours/week and wrist acceleration/week in the total population, and then separately in the different sociodemo-graphic groups. Since the Spearman correlation coefficient is equal to the slope of the regression between the ranked val-ues of the two measures, sex differences were tested by re-gressing the sex-specific rank of wrist acceleration/week on
the sex-specific rank of MET-hours/week together with the
interaction term (sex × rank of MET-hours/week) using a lin-ear model. The P value for interaction was used to test whether the correlation between questionnaire-based and accelerometer-assessed physical activity differed by sex. This analysis was repeated for each sociodemographic vari-able under consideration. For age, educational level, and oc-cupational position, a P value for trend across the categories
was also calculated byfitting a linear group interaction term with rank of MET-hours/week.
The correlations of reported level (mild, moderate, or vig-orous) and type (walking, sports, gardening, housework, do-it-yourself, or other) of physical activity (MET-hours/ week) with questionnaire-assessed (MET-hours/week) and accelerometer-assessed (mg/week) total physical activity were also evaluated using Spearman correlations.
Finally, for each participant, the contribution of reported level of physical activity to the total questionnaire-assessed physical activity level was expressed as a percentage, calcu-lated as [100 × physical level under consideration (MET-hours/week)/total physical activity (MET-hours/week)]. The Kruskal-Wallis rank test was used to determine whether the contribution of each physical activity level differed according to sociodemographic factors. A similar analysis was under-taken for type of physical activity.
A minority of the participants wore the accelerometer on their dominant hand. We undertook sensitivity analyses to test whether this influenced results by repeating the analysis of correlation between questionnaire- and accelerometer-assessed physical activity levels using data only from partic-ipants who wore the accelerometer on their nondominant hand. Because accelerometers are known not to measure cy-cling correctly, we repeated the analysis in participants who did not report cycling in the diary that accompanied the accel-erometer. Analyses were performed with SAS, version 9.2 (SAS Institute, Inc., Cary, North Carolina).
RESULTS
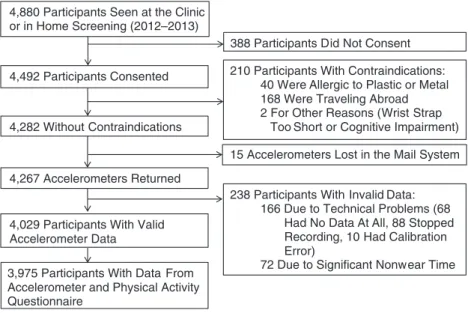
Among the 4,880 participants to whom the accelerometer was proposed, 388 did not consent and 210 had contraindica-tions (allergies to metal or plastic, traveling abroad during the wear period, etc.) (Figure1). A total of 4,029 participants had
4,267 Accelerometers Returned
4,029 Participants With Valid Accelerometer Data
388 Participants Did Not Consent 210 Participants With Contraindications:
40 Were Allergic to Plastic or Metal 168 Were Traveling Abroad 2 For Other Reasons (Wrist Strap
Too Short or Cognitive Impairment) 15 Accelerometers Lost in the Mail System
238 Participants With Invalid Data: 166 Due to Technical Problems (68
Had No Data At All, 88 Stopped Recording, 10 Had Calibration Error)
72 Due to Significant Nonwear Time 3,975 Participants With Data From
Accelerometer and Physical Activity Questionnaire
4,880 Participants Seen at the Clinic or in Home Screening (2012–2013)
4,492 Participants Consented
4,282 Without Contraindications
Figure 1. Selection of participants for the Whitehall II Study, United Kingdom, 2012–2013. Possession of invalid data was defined as having fewer
than 2 valid weekend days and 2 valid weekdays of accelerometer measurement (a valid day was defined as≥16 hours of accelerometer wear time).
Questionnaire and Accelerometer Physical Activity Assessments 783
by guest on March 12, 2015
http://aje.oxfordjournals.org/
valid data (≥16 hours/day) for at least 2 weekdays and 2 weekend days. Of these persons, 3,975 also responded to the self-administered physical activity questionnaire, consti-tuting the analytic sample for the present analysis. Compared with the 905 participants who were not included, the analytic sample was composed of more men than women (74.0% vs. 67.4%; P < 0.0001) but did not differ with regard to other so-ciodemographic characteristics. The median delay between responding to the questionnaire and accelerometer wear was 5 days (interquartile range, 1–22 days).
Among the 3,975 participants included in the analytic
sample, 3,861 (97.1%) had data for≥16 hours/day for the
full 8 days; 45 (1.1%) had such data for 7 days; 31 (0.8%) had data for 6 days; and 38 (1.0%) had data for 4–5 days. In all, missing data were replaced for 1–2 hours for 26.2% of the participants, >2–5 hours for 1.4% of the participants, >5–10 hours for 1.1% of the participants, and >10–25 hours for 0.4% of the participants.
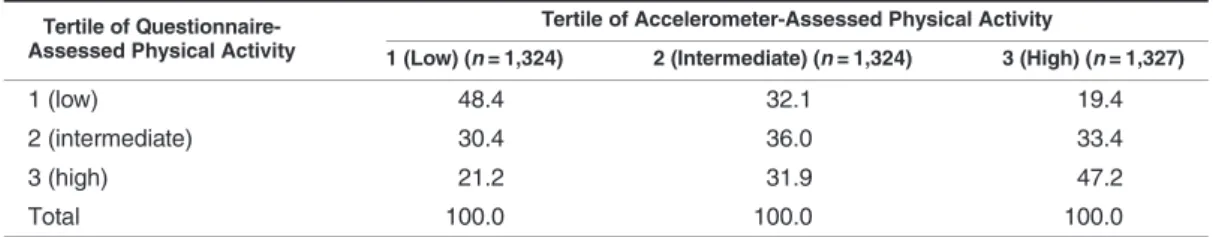
Table 1 shows the cross-classification of tertiles of
questionnaire- and accelerometer-assessed physical activity.
Theκ coefficient was 0.16, suggesting poor overall
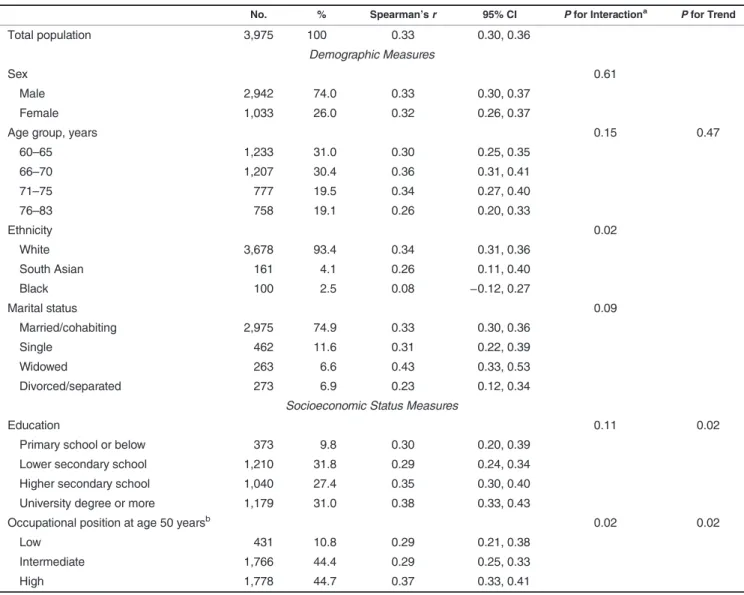
agree-ment; fewer than 50% of participants were classified in the same tertile by the two methods. The correlation between questionnaire- and accelerometer-assessed total physical ac-tivity (Table2) in the total analytic sample was 0.33 (95%
confidence interval (CI): 0.30, 0.36). Among the
demo-graphic measures, the correlation differed only as a function of ethnicity; it was higher in white participants (r = 0.34, 95% CI: 0.31, 0.36; P for interaction = 0.02). Both SES measures (occupational position and education) affected the correla-tions; correlations were higher in the higher-SES group
than in the lower-SES group (P’s for trend = 0.02). For
example, the correlation was greater in persons with a high occupational position (r = 0.37, 95% CI: 0.33, 0.41) than in those with a low occupational position (r = 0.29, 95% CI: 0.21, 0.38).
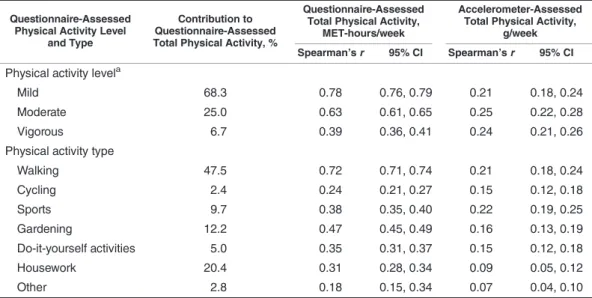
Table3shows the correlation of questionnaire-assessed physical activity level or type (MET-hours/week) with over-all MET-hours/week and accelerometer-assessed total phys-ical activity. Moderate and vigorous physphys-ical activities contributed to less than one-third of the total reported phys-ical activity (25.0% and 6.7%, respectively). Mild activities contributed the most (68.3%) and had the strongest correla-tion with total reported physical activity (r = 0.78, 95% CI: 0.76, 0.79). However, the correlations with
accelerometer-assessed total physical activity were comparable for mild, moderate, and vigorous activity (all r’s = 0.21–0.25). Given that mild activities dominated physical activity, this result suggests a stronger“true” association of moderate and vigor-ous activities with accelerometer-assessed physical activity. The correlations between reported type of physical activity, analyzed using MET-hours/week, and accelerometer-assessed total physical activity were strongest for sports (r = 0.22, 95% CI: 0.19, 0.25) and walking (r = 0.21, 95% CI: 0.18, 0.24), followed by activities performed around the house, such as gardening (r = 0.16, 95% CI: 0.13, 0.19) and do-it-yourself activities (r = 0.15, 95% CI: 0.12, 0.18), while a lower correlation was observed for housework (r = 0.09, 95% CI: 0.05, 0.12).
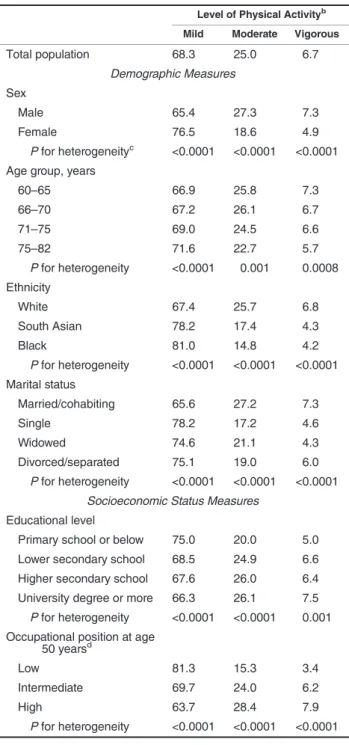
The contribution of level of reported physical activity to the total MET-hours/week derived from the questionnaire differed according to all sociodemographic factors examined (Table4) (all P’s < 0.001). More of the physical activity came from mild activities among women, among older, nonwhite, and not-married/cohabiting participants, and among partici-pants from the lower educational and occupational position groups. A similar pattern was observed for different types of physical activity (Appendix Table1).
There was no association between wearing the accelerom-eter on the dominant wrist (n = 145; 3.6%) and sociodemo-graphic variables (P > 0.18). Removing these participants from the analysis did not alter results (correlation between MET-hours/week and wrist acceleration/week: r = 0.33, 95% CI: 0.30, 0.36). When participants who reported cycling were removed from the analysis (n = 3,458), the correlation between questionnaire data and accelerometer data was 0.31 (95% CI: 0.28, 0.34).
DISCUSSION
In a large British cohort of older adults aged 60–83 years, the overall correlation between questionnaire-assessed and accelerometer-assessed physical activity was low and dif-fered across sociodemographic groups. It was higher in the
high-SES groups, as defined by occupational position at
age 50 years or highest academic qualification, and in whites compared with nonwhite participants. However, it did not differ as a function of age, sex, or marital status.
Accelerometers were initially used in epidemiologic research to validate questionnaires, primarily in small studies (4).
Table 1. Agreementa(%) Between Tertiles of Questionnaire-Assessed Physical Activity and Tertiles of
Accelerometer-Assessed Physical Activity, Whitehall II Study, United Kingdom, 2012–2013
Tertile of Questionnaire-Assessed Physical Activity
Tertile of Accelerometer-Assessed Physical Activity
1 (Low) (n = 1,324) 2 (Intermediate) (n = 1,324) 3 (High) (n = 1,327)
1 (low) 48.4 32.1 19.4 2 (intermediate) 30.4 36.0 33.4 3 (high) 21.2 31.9 47.2 Total 100.0 100.0 100.0 a κ = 0.16. by guest on March 12, 2015 http://aje.oxfordjournals.org/ Downloaded from
However, the low-to-moderate correspondence between questionnaire-based and accelerometer-assessed physical ac-tivity measurements, along with the growing affordability of accelerometers, is increasingly leading to use of accelerome-ters to measure physical activity in large studies (27–35). Ac-celerometry is often used in validation studies (4,8), but it is far from a“gold standard,” since it measures the movement of only 1 body part (increasingly the wrist due to ease of wear) but the resulting inferences are applied to the whole body. In addition, although several authors have proposed thresholds to define mild, moderate, and vigorous levels of physical ac-tivity (34,36–42) and have developed algorithms for detect-ing types of physical activity (43–46), there is no consensus on the best method and there is considerable inconsistency in results derived from different algorithms (39). It is likely that
both questionnaires and accelerometers will continue to be used to assess physical activity in order to examine associations with health outcomes. Therefore, better understanding of the association between physical activity assessed using question-naires and that assessed using accelerometers is needed.
The overall correlation between questionnaire- and accelerometer-assessed physical activity in our study (r = 0.33) was in the range reported by other investigators (3–5). Our study differed in 2 ways: 1) wear position—the acceler-ometer was worn on the wrist rather than the waist, and
2) wear time each day—24 hours as opposed to waking
hours only. Previous studies used nonwaterproof waist-mounted devices that are removed before sleep or before
water-based activities such as swimming (4). Because we
used a waterproof wrist-worn accelerometer which allowed
Table 2. Spearman Correlation Between Questionnaire-Assessed Total Physical Activity (MET-hours/week) and Accelerometer-Assessed Total
Physical Activity (mg/week), According to Sociodemographic Characteristics, Whitehall II Study, United Kingdom, 2012–2013
No. % Spearman’s r 95% CI P for Interactiona P for Trend
Total population 3,975 100 0.33 0.30, 0.36
Demographic Measures
Sex 0.61
Male 2,942 74.0 0.33 0.30, 0.37
Female 1,033 26.0 0.32 0.26, 0.37
Age group, years 0.15 0.47
60–65 1,233 31.0 0.30 0.25, 0.35 66–70 1,207 30.4 0.36 0.31, 0.41 71–75 777 19.5 0.34 0.27, 0.40 76–83 758 19.1 0.26 0.20, 0.33 Ethnicity 0.02 White 3,678 93.4 0.34 0.31, 0.36 South Asian 161 4.1 0.26 0.11, 0.40 Black 100 2.5 0.08 −0.12, 0.27 Marital status 0.09 Married/cohabiting 2,975 74.9 0.33 0.30, 0.36 Single 462 11.6 0.31 0.22, 0.39 Widowed 263 6.6 0.43 0.33, 0.53 Divorced/separated 273 6.9 0.23 0.12, 0.34
Socioeconomic Status Measures
Education 0.11 0.02
Primary school or below 373 9.8 0.30 0.20, 0.39
Lower secondary school 1,210 31.8 0.29 0.24, 0.34
Higher secondary school 1,040 27.4 0.35 0.30, 0.40
University degree or more 1,179 31.0 0.38 0.33, 0.43
Occupational position at age 50 yearsb 0.02 0.02
Low 431 10.8 0.29 0.21, 0.38
Intermediate 1,766 44.4 0.29 0.25, 0.33
High 1,778 44.7 0.37 0.33, 0.41
Abbreviations: CI, confidence interval; MET, metabolic equivalent.
aRefers to the interaction calculated with the exposure variable entered as an ordinal variable rather than a categorical variable.
bOccupational position was defined using the British civil service employment grade as high (administrative), intermediate (professional or
executive), or low (clerical or support).
Questionnaire and Accelerometer Physical Activity Assessments 785
by guest on March 12, 2015
http://aje.oxfordjournals.org/
data to be collected over 24 hours, we expected a stronger cor-relation than was obtained in previous studies. However, wrist-worn devices may be poorer measures of total body movement than waist-worn devices (42,47). This might ex-plain why the overall correlation in our study was similar to correlations observed using waist-worn accelerometers.
Cycling, classified as a moderate-to-vigorous activity, is poorly measured by accelerometers (14). In the present data, this is unlikely to have contributed to the low correlation be-tween reported and accelerometer-assessed physical activity, since removing participants who reported cycling did not change the overall correlation. We used a 20-item question-naire to assess reported physical activity; it might be argued that a more elaborate questionnaire would be better able to measure the diversity in physical activities. A possible source of error is that questionnaires like ours (17,48,49) assess du-ration and frequency but not the intensity at which activities are performed. The unique MET value assigned to an activity represents a mean intensity at which the activity is usually performed, although walking, for example, could have MET values ranging from 2.0 to 12.0 (20) if walking speed and ground slope were taken into account. There are some question-naires, such as the International Physical Activity Question-naire (5) or the National Health and Nutrition Examination Survey physical activity questionnaire (15), that also request information on intensity of physical activity. However, the re-sulting correlation with objective measures of physical activity is similar to that in the present study (5,15), suggesting that re-porting biases in intensity and duration might be drivers of the poor association with accelerometer data.
Few studies have examined the influence of
sociodemo-graphic factors on the correlation between
questionnaire-and accelerometer-assessed measures of physical activity, and they suggest better correlation in men (4,8–12), younger subjects (8–10,12), and persons with higher education (12). Our data showed higher correlations in higher-SES groups but no differences as a function of age or sex in older adults. The correlation in our study of moderate and vigorous phys-ical activities with accelerometer-assessed total physphys-ical activity was comparable to that of mild activities, whereas these activities contributed to less than one-third of the total reported physical activity, suggesting a stronger“true” asso-ciation between accelerometer data and reported moderate and vigorous activities, as was also observed in previous studies (6,17). The stronger association could be explained by better estimation by the participants of the duration of vig-orous activities (e.g., sports) (6). There is also some evidence from laboratory and free-living experiments that accelerome-ters record vigorous activity more accurately than light-to-moderate activity (50–52), perhaps also contributing to the weaker association with mild activities. In addition, we observed that more energetic activities (e.g., sports or garden-ing) contributed more to the overall reported physical activity in persons from high-SES groups, as was suggested by a re-cent review (53). Taken together, these results provide one ex-planation for the lower correlation between self-reported and accelerometer-assessed physical activity in sociodemographic groups where mild activities constitute the bulk of reported physical activity.
This study had several strengths, including its large size, use of a waterproof wrist-worn accelerometer, use of raw data rather than“counts” data (23,54), and a high level of compliance for accelerometer wear. Our study also had some limitations. First, although the sample covered a wide
Table 3. Spearman Correlations of Type and Level (MET-hours/week) of Reported Physical Activity With
Questionnaire- and Accelerometer-Assessed Total Physical Activity, Whitehall II Study, United Kingdom, 2012–2013
Questionnaire-Assessed Physical Activity Level
and Type
Contribution to Questionnaire-Assessed Total Physical Activity, %
Questionnaire-Assessed Total Physical Activity,
MET-hours/week
Accelerometer-Assessed Total Physical Activity,
g/week Spearman’s r 95% CI Spearman’s r 95% CI
Physical activity levela
Mild 68.3 0.78 0.76, 0.79 0.21 0.18, 0.24
Moderate 25.0 0.63 0.61, 0.65 0.25 0.22, 0.28
Vigorous 6.7 0.39 0.36, 0.41 0.24 0.21, 0.26
Physical activity type
Walking 47.5 0.72 0.71, 0.74 0.21 0.18, 0.24 Cycling 2.4 0.24 0.21, 0.27 0.15 0.12, 0.18 Sports 9.7 0.38 0.35, 0.40 0.22 0.19, 0.25 Gardening 12.2 0.47 0.45, 0.49 0.16 0.13, 0.19 Do-it-yourself activities 5.0 0.35 0.31, 0.37 0.15 0.12, 0.18 Housework 20.4 0.31 0.28, 0.34 0.09 0.05, 0.12 Other 2.8 0.18 0.15, 0.34 0.07 0.04, 0.10
Abbreviations: CI, confidence interval; MET, metabolic equivalent.
aMild physical activity was defined as activities with corresponding MET values lower than 3 (e.g., dish-washing,
boating), moderate physical activity as activities with MET values of 3–5.9 (e.g., cycling, weeding), and vigorous
physical activity as activities with MET values of 6 or above (e.g., swimming, mowing).
by guest on March 12, 2015
http://aje.oxfordjournals.org/
socioeconomic range, with annual full-time salaries ranging from £4,995 ($8,213) to £150,000 ($246,600), data were from an occupational cohort and cannot be assumed to be representative of the general population. Second, although our results are in accordance with those of previous studies that used different instruments, the International Physical Activity Questionnaire, or a different type of accelerometer (e.g., the Actigraph (Actigraph Corporation, Pensacola, Florida)), they are specific to the instruments used, so results might not be generalizable to other instruments.
To our knowledge, this was thefirst study of its kind in a population of older adults. Physical activity is seen to be key for successful aging (55), and in order to estimate its impact on health at older ages, the discrepancies in its measurement need to be better understood. In the present study, we found that the correlation between questionnaire-assessed and accelerometer-assessed physical activity did not differ by age. Because the age range of participants in our study was limited, we cannot exclude the possibility of age effects in the oldest old. Questionnaire-assessed physical activity was more strongly correlated with accelerometer data in higher-SES groups, and our data suggest that a source of this dis-crepancy may be the pattern of reported physical activity. Indeed, the type of reported physical activity determines the magnitude of the association between questionnaire-based and accelerometer-assessed physical activity; in gen-eral terms, associations are stronger for more energetic activities. Thus, groups with a more intense physical activ-ity pattern show stronger associations with accelerometer-assessed physical activity. In future studies, researchers need to identify the aspects of physical activity that are most critical for health; this involves paying closer atten-tion to measurement issues.
ACKNOWLEDGMENTS
Author affiliations: Department of Epidemiology and
Public Health, Institute of Epidemiology and Health Care, University College London, London, United Kingdom (Séverine Sabia, Martin J. Shipley, Gareth Hagger-Johnson,
Mika Kivimaki, Archana Singh-Manoux); MoveLab—
Physical Activity and Exercise Research, Institute of Cellular Medicine, Newcastle University, Newcastle upon Tyne, United Kingdom (Vincent T. van Hees, Michael I. Trenell); MRC Centre of Epidemiology for Child Health, Institute of Child Health, University College London, London, United Kingdom (Gareth Hagger-Johnson); Centre for Research in Epidemiology and Population Health, National Institute of Health and Medical Research, Unit 1018, Villejuif, France (Alexis Elbaz, Archana Singh-Manoux); University of Paris 11, Villejuif, France (Alexis Elbaz, Archana Singh-Manoux); University of Versailles Saint-Quentin-en-Yvelines, Boulogne-Billancourt, France (Archana Singh-Manoux); and Gerontol-ogy Center, Saint Périne Hospital, Public Assistance-Hospital of Paris, Paris, France (Archana Singh-Manoux).
Drs. Séverine Sabia and Vincent T. van Hees contributed equally to this work.
Table 4. Mean Contributionsa(%) of Different Levels of Physical
Activity to Questionnaire-Assessed Physical Activity Level, by
Socio-demographic Group, Whitehall II Study, United Kingdom, 2012–2013
Level of Physical Activityb
Mild Moderate Vigorous
Total population 68.3 25.0 6.7 Demographic Measures Sex Male 65.4 27.3 7.3 Female 76.5 18.6 4.9 P for heterogeneityc <0.0001 <0.0001 <0.0001
Age group, years
60–65 66.9 25.8 7.3 66–70 67.2 26.1 6.7 71–75 69.0 24.5 6.6 75–82 71.6 22.7 5.7 P for heterogeneity <0.0001 0.001 0.0008 Ethnicity White 67.4 25.7 6.8 South Asian 78.2 17.4 4.3 Black 81.0 14.8 4.2 P for heterogeneity <0.0001 <0.0001 <0.0001 Marital status Married/cohabiting 65.6 27.2 7.3 Single 78.2 17.2 4.6 Widowed 74.6 21.1 4.3 Divorced/separated 75.1 19.0 6.0 P for heterogeneity <0.0001 <0.0001 <0.0001
Socioeconomic Status Measures Educational level
Primary school or below 75.0 20.0 5.0
Lower secondary school 68.5 24.9 6.6
Higher secondary school 67.6 26.0 6.4
University degree or more 66.3 26.1 7.5
P for heterogeneity <0.0001 <0.0001 0.001
Occupational position at age
50 yearsd
Low 81.3 15.3 3.4
Intermediate 69.7 24.0 6.2
High 63.7 28.4 7.9
P for heterogeneity <0.0001 <0.0001 <0.0001
Abbreviation: MET, metabolic equivalent.
a
Calculated as [100 × physical activity level (type) under consideration (MET-hours/week)/total physical activity (MET-hours/ week)].
bMild physical activity was defined as activities with corresponding
MET values lower than 3 (e.g., dish-washing, boating), moderate
physical activity as activities with MET values of 3–5.9 (e.g., cycling,
weeding), and vigorous physical activity as activities with MET values of 6 or above (e.g., swimming, mowing).
c
Calculated using a Kruskal-Wallis test.
dOccupational position was defined using the British civil service
employment grade as high (administrative), intermediate ( profes-sional or executive), or low (clerical or support).
Questionnaire and Accelerometer Physical Activity Assessments 787
by guest on March 12, 2015
http://aje.oxfordjournals.org/
This research was supported by the US National Institutes of Health (grant R01AG013196 to A.S.-M., grant R01AG034454 to A.S.-M. and M.K., and grant R01HL036310 to M.K.) and the Medical Research Council (grant K013351 to M.K.). M.J. S. was partly supported by the British Heart Foundation. M.K. was supported by a professorial fellowship from the Economic and Social Research Council. G.H.-J. was supported by a grant from the Economic and Social Research Council.
We thank all of the participating United Kingdom civil ser-vice departments and their welfare, personnel, and
establish-ment officers; the British Occupational Health and Safety
Agency; the British Council of Civil Service Unions; and all members of the Whitehall II study team. The Whitehall II study team comprises research scientists, statisticians, study coordinators, nurses, data managers, administrative assistants, and data entry staff. We also thank Drs. Simon Woodman, Hugo Hiden, and Paul Watson of Newcastle Uni-versity for their support with the computational infrastructure.
Conflicts of interest: none declared.
REFERENCES
1. Lee IM, Shiroma EJ, Lobelo F, et al. Effect of physical inactivity on major non-communicable diseases worldwide: an analysis of burden of disease and life expectancy. Lancet. 2012;
380(9838):219–229.
2. van Hees V. The challenge of assessing physical activity in
populations. Lancet. 2012;380(9853):1555–1556.
3. Lee PH, Macfarlane DJ, Lam TH, et al. Validity of the International Physical Activity Questionnaire Short Form (IPAQ-SF): a systematic review. Int J Behav Nutr Phys Act. 2011;8:115.
4. Prince SA, Adamo KB, Hamel ME, et al. A comparison of direct versus self-report measures for assessing physical activity in adults: a systematic review. Int J Behav Nutr Phys Act. 2008;5:56. 5. Craig CL, Marshall AL, Sjostrom M, et al. International
Physical Activity Questionnaire: 12-country reliability and
validity. Med Sci Sports Exerc. 2003;35(8):1381–1395.
6. Kim Y, Park I, Kang M. Convergent validity of the International Physical Activity Questionnaire (IPAQ): meta-analysis. Public
Health Nutr. 2013;16(3):440–452.
7. Mader U, Martin BW, Schutz Y, et al. Validity of four short physical activity questionnaires in middle-aged persons. Med
Sci Sports Exerc. 2006;38(7):1255–1266.
8. Cust AE, Smith BJ, Chau J, et al. Validity and repeatability of the EPIC physical activity questionnaire: a validation study using accelerometers as an objective measure. Int J Behav Nutr Phys Act. 2008;5:33.
9. Ferrari P, Friedenreich C, Matthews CE. The role of
measurement error in estimating levels of physical activity. Am
J Epidemiol. 2007;166(7):832–840.
10. Friedenreich CM, Courneya KS, Neilson HK, et al. Reliability and validity of the Past Year Total Physical Activity
Questionnaire. Am J Epidemiol. 2006;163(10):959–970.
11. Hagstromer M, Ainsworth BE, Oja P, et al. Comparison of a subjective and an objective measure of physical activity in a
population sample. J Phys Act Health. 2010;7(4):541–550.
12. Lee PH, Yu YY, McDowell I, et al. Performance of the International Physical Activity Questionnaire (Short Form) in subgroups of the Hong Kong Chinese population. Int J Behav Nutr Phys Act. 2011;8:81.
13. Scheers T, Philippaerts R, Lefevre J. Assessment of physical activity and inactivity in multiple domains of daily life: a comparison between a computerized questionnaire and the SenseWear Armband complemented with an electronic diary. Int J Behav Nutr Phys Act. 2012;9:71.
14. Slootmaker SM, Schuit AJ, Chinapaw MJM, et al.
Disagreement in physical activity assessed by accelerometer and self-report in subgroups of age, gender, education and weight status. Int J Behav Nutr Phys Act. 2009;6:17. 15. Tooze JA, Troiano RP, Carroll RJ, et al. A measurement error
model for physical activity level as measured by a questionnaire
with application to the 1999–2006 NHANES questionnaire. Am
J Epidemiol. 2013;177(11):1199–1208.
16. Marmot MG, Smith GD, Stansfeld S, et al. Health inequalities among British civil servants: the Whitehall II study. Lancet.
1991;337(8754):1387–1393.
17. Jacobs DR Jr, Ainsworth BE, Hartman TJ, et al. A simultaneous evaluation of 10 commonly used physical activity
questionnaires. Med Sci Sports Exerc. 1993;25(1):81–91.
18. Richardson MT, Leon AS, Jacobs DR Jr, et al. Comprehensive evaluation of the Minnesota Leisure Time Physical Activity
Questionnaire. J Clin Epidemiol. 1994;47(3):271–281.
19. Whitehall II Study Team. Health Survey: Stress and Health Study. London, United Kingdom: University College London;
2010:38–43. (http://www.ucl.ac.uk/whitehallII/pdf/S7_HSQ.
pdf). (Accessed December 3, 2013).
20. Ainsworth BE, Haskell WL, Herrmann SD, et al. 2011 Compendium of Physical Activities: a second update of codes and MET values. Med Sci Sports Exerc. 2011;43(8):
1575–1581.
21. Sabia S, Dugravot A, Kivimaki M, et al. Effect of intensity and type of physical activity on mortality: results from the Whitehall II cohort study. Am J Public Health. 2012;102(4):
698–704.
22. Lukowicz P, Junker H, Tröster G. Automatic calibration of body worn acceleration sensors. In: Ferscha A, Mattern F, eds. Pervasive Computing: Second International Conference, PERVASIVE 2004. Linz/Vienna, Austria, April 2004. Proceedings. (Lecture Notes in Computer Science, no. 3001). New York, NY: Springer Publishing Company; 2004:
176–181.
23. van Hees VT, Gorzelniak L, Dean Leon EC, et al. Separating movement and gravity components in an acceleration signal and implications for the assessment of human daily physical activity. PLoS One. 2013;8(4):e61691.
24. Hiden H, Woodman S, Watson P, et al. Developing cloud applications using the e-Science central platform. Philos Trans A Math Phys Eng Sci. 2013;371(1983):20120085.
25. van Hees VT, Renstrom F, Wright A, et al. Estimation of daily energy expenditure in pregnant and non-pregnant women using a wrist-worn tri-axial accelerometer. PLoS One. 2011;6(7): e22922.
26. Catellier DJ, Hannan PJ, Murray DM, et al. Imputation of missing data when measuring physical activity by accelerometry. Med Sci Sports Exerc. 2005;37(11 suppl):
S555–S562.
27. Buchman AS, Boyle PA, Yu L, et al. Total daily physical activity and the risk of AD and cognitive decline in older adults.
Neurology. 2012;78(17):1323–1329.
28. Buman MP, Hekler EB, Haskell WL, et al. Objective light-intensity physical activity associations with rated health in
older adults. Am J Epidemiol. 2010;172(10):1155–1165.
29. Hagstromer M, Oja P, Sjostrom M. Physical activity and inactivity in an adult population assessed by accelerometry.
Med Sci Sports Exerc. 2007;39(9):1502–1508.
by guest on March 12, 2015
http://aje.oxfordjournals.org/
30. Healy GN, Matthews CE, Dunstan DW, et al. Sedentary time and cardio-metabolic biomarkers in US adults: NHANES
2003–06. Eur Heart J. 2011;32(5):590–597.
31. Henson J, Yates T, Biddle SJ, et al. Associations of objectively measured sedentary behaviour and physical activity with markers of cardiometabolic health. Diabetologia. 2013;56(5):
1012–1020.
32. Kozakova M, Palombo C, Morizzo C, et al. Effect of sedentary
behaviour and vigorous physical activity on segment-specific
carotid wall thickness and its progression in a healthy
population. Eur Heart J. 2010;31(12):1511–1519.
33. Ottevaere C, Huybrechts I, De Bourdeaudhuij I, et al. Comparison of the IPAQ-A and Actigraph in relation to
VO2max among European adolescents: the HELENA study.
J Sci Med Sport. 2011;14(4):317–324.
34. Troiano RP, Berrigan D, Dodd KW, et al. Physical activity in the United States measured by accelerometer. Med Sci Sports
Exerc. 2008;40(1):181–188.
35. Vallance JK, Winkler EA, Gardiner PA, et al. Associations of objectively-assessed physical activity and sedentary time with
depression: NHANES (2005–2006). Prev Med. 2011;53(4-5):
284–288.
36. Brage S, Wedderkopp N, Franks PW, et al. Reexamination of validity and reliability of the CSA monitor in walking and
running. Med Sci Sports Exerc. 2003;35(8):1447–1454.
37. Esliger DW, Rowlands AV, Hurst TL, et al. Validation of the GENEA accelerometer. Med Sci Sports Exerc. 2011;43(6):
1085–1093.
38. Freedson PS, Melanson E, Sirard J. Calibration of the Computer Science and Applications, Inc. accelerometer. Med Sci Sports
Exerc. 1998;30(5):777–781.
39. Ham SA, Reis JP, Strath SJ, et al. Discrepancies between methods of identifying objectively determined physical
activity. Med Sci Sports Exerc. 2007;39(1):52–58.
40. Hendelman D, Miller K, Baggett C, et al. Validity of accelerometry for the assessment of moderate intensity physical
activity in thefield. Med Sci Sports Exerc. 2000;32(9 suppl):
S442–S449.
41. Matthew CE. Calibration of accelerometer output for adults.
Med Sci Sports Exerc. 2005;37(11 suppl):S512–S522.
42. Swartz AM, Strath SJ, Bassett DR Jr, et al. Estimation of energy expenditure using CSA accelerometers at hip and wrist sites.
Med Sci Sports Exerc. 2000;32(9 suppl):S450–S456.
43. Skotte J, Korshøj M, Kristiansen J, et al. Detection of physical activity types using triaxial accelerometers. J Phys Act Health.
2014;11(1):76–84.
44. van Hees VT, Golubic R, Ekelund U, et al. Impact of study design on development and evaluation of an activity-type
classifier. J Appl Physiol. 2013;114(8):1042–1051.
45. Zhang S, Murray P, Zillmer R, et al. Activity classification
using the GENEA: optimum sampling frequency and number of axes. Med Sci Sports Exerc. 2012;44(11):
2228–2234.
46. Zhang S, Rowlands AV, Murray P, et al. Physical activity
classification using the GENEA wrist-worn accelerometer. Med
Sci Sports Exerc. 2012;44(4):742–748.
47. Rosenberger ME, Haskell WL, Albinali F, et al. Estimating activity and sedentary behavior from an accelerometer on the
hip or wrist. Med Sci Sports Exerc. 2013;45(5):964–975.
48. The InterAct Consortium. Validity of a short questionnaire to assess physical activity in 10 European countries. Eur J
Epidemiol. 2012;27(1):15–25.
49. Hekler EB, Buman MP, Haskell WL, et al. Reliability and validity of CHAMPS self-reported sedentary-to-vigorous intensity physical activity in older adults. J Phys Act Health.
2012;9(2):225–236.
50. Bassett DR Jr, Ainsworth BE, Swartz AM, et al. Validity of four motion sensors in measuring moderate intensity physical activity. Med Sci Sports Exerc. 2000;32(9 suppl):
S471–S480.
51. Crouter SE, Dellavalle DM, Haas JD, et al. Validity of ActiGraph 2-regression model, Matthews cut-points, and NHANES cut-points for assessing free-living physical activity.
J Phys Act Health. 2013;10(4):504–514.
52. Welch WA, Bassett DR, Thompson DL, et al. Classification
accuracy of the wrist-worn Gravity Estimator of Normal Everyday Activity accelerometer. Med Sci Sports Exerc. 2013;
45(10):2012–2019.
53. Bauman AE, Reis RS, Sallis JF, et al. Correlates of physical activity: why are some people physically active and others not?
Lancet. 2012;380(9838):258–271.
54. Stiles VH, Griew PJ, Rowlands AV. Use of accelerometry to
classify activity beneficial to bone in premenopausal women.
Med Sci Sports Exerc. 2013;45(12):2353–2361.
55. King AC, Guralnik JM. Maximizing the potential of an aging
population. JAMA. 2010;304(17):1944–1945.
(Appendix follows)
Questionnaire and Accelerometer Physical Activity Assessments 789
by guest on March 12, 2015
http://aje.oxfordjournals.org/
Appendix Table 1. Mean Contributionaof Different Types of Activity (%) to Questionnaire-Assessed Physical Activity Level, by
Sociodemographic Group, Whitehall II Study, United Kingdom, 2012–2013
Type of Physical Activity
Walking Cycling Sports Gardening DIY Activities Housework Other
Total population 47.5 2.4 9.7 12.2 5.0 20.4 2.8 Demographic Measures Sex Male 48.0 2.9 10.2 12.9 6.2 16.9 2.9 Female 46.1 1.1 8.5 10.1 1.5 30.3 2.4 P for heterogeneityb 0.11 <0.0001 0.02 <0.0001 <0.0001 <0.0001 0.004
Age group, years
60–65 47.1 3.2 10.0 11.7 5.8 19.6 2.6 66–70 47.2 2.6 10.7 12.2 5.1 19.6 2.6 71–75 47.9 2.0 9.7 12.5 4.3 20.7 3.0 75–82 48.3 1.3 7.8 12.5 4.2 22.8 3.1 P for heterogeneity 0.47 <0.0001 <0.0001 0.81 0.002 0.02 0.68 Ethnicity White 47.2 2.6 9.8 12.5 5.2 19.8 2.9 South Asian 49.1 0.2 8.4 8.8 3.1 28.4 2.0 Black 55.2 1.3 8.7 6.6 1.8 26.0 0.4 P for heterogeneity 0.0009 0.0003 0.07 <0.0001 <0.0001 0.001 0.0003 Marital status Married/cohabiting 46.9 2.8 10.4 13.1 5.7 18.3 2.8 Single 51.3 1.1 7.0 9.0 2.7 26.5 2.4 Widowed 48.5 2.7 8.2 8.6 3.6 25.9 2.4 Divorced/separated 46.7 0.5 8.9 10.3 3.0 27.6 2.9 P for heterogeneity 0.0003 <0.0001 0.01 <0.0001 <0.0001 <0.0001 0.11
Socioeconomic Status Measures Educational level
Primary school or below 50.3 1.9 7.6 9.1 4.0 25.0 2.2
Lower secondary school 47.8 2.4 9.4 12.1 5.3 20.2 2.8
Higher secondary school 47.3 2.1 9.7 13.1 5.1 19.9 2.8
University degree 46.4 2.8 10.7 12.7 4.9 19.5 2.9
P for heterogeneity 0.009 0.007 0.007 <0.0001 0.001 0.002 0.0006
Occupational position at age 50 yearsc
Low 52.1 1.3 6.3 7.8 1.7 29.3 1.5
Intermediate 48.2 2.4 8.7 11.6 5.2 21.2 2.8
High 45.7 2.8 11.6 13.8 5.6 17.5 3.1
P for heterogeneity <0.0001 <0.0001 <0.0001 <0.0001 <0.0001 <0.0001 <0.0001
Abbreviations: DIY, do-it-yourself; MET, metabolic equivalent.
a
Calculated as [100 × physical activity level (MET-hours/week)/total physical activity (MET-hours/week)].
b
Calculated using a Kruskal-Wallis test.
c
Occupational position was defined using the British civil service employment grade as high (administrative), intermediate (professional or executive), or low (clerical or support).
by guest on March 12, 2015
http://aje.oxfordjournals.org/