HAL Id: hal-01579726
https://hal-univ-rennes1.archives-ouvertes.fr/hal-01579726
Submitted on 31 Aug 2017HAL is a multi-disciplinary open access archive for the deposit and dissemination of sci-entific research documents, whether they are pub-lished or not. The documents may come from teaching and research institutions in France or
L’archive ouverte pluridisciplinaire HAL, est destinée au dépôt et à la diffusion de documents scientifiques de niveau recherche, publiés ou non, émanant des établissements d’enseignement et de recherche français ou étrangers, des laboratoires
Human exposure to power frequency magnetic fields up
to 7.6 mT: An integrated EEG/fMRI study
Julien Modolo, Alex W. Thomas, Alexandre Legros
To cite this version:
Julien Modolo, Alex W. Thomas, Alexandre Legros. Human exposure to power frequency magnetic fields up to 7.6 mT: An integrated EEG/fMRI study. Bioelectromagnetics, Wiley, 2017, 38 (6), pp.425-435. �10.1002/bem.22064�. �hal-01579726�
Human Exposure to power frequency Magnetic Fields up to
7.6 mT: an Integrated EEG/fMRI Study
Julien Modolo1,2,3,4,5, Alex W Thomas1,2,3, and Alexandre Legros1,2,3,6*
1Human Threshold Research Group and Bioelectromagnetics, Imaging Program, Lawson Health
Research Institute, London, Canada
2Department of Medical Biophysics, Western University, London, Canada 3Department of Medical Imaging, Western University, London, Canada 4Institut National de la Santé et de la Recherche Médicale (INSERM), France 5Laboratoire Traitement du Signal et de l’Image (LTSI), U1099, Rennes 1 University, France
6School of Kinesiology, Western University, London, Canada
*Corresponding Author
Alexandre Legros, Human Threshold Research Project, Lawson Health Research Institute, 268 Grosvenor Street, London, ON, Canada, N6A 4V2
alegros@lawsonimaging.ca
Conflict of interest: none.
Financial Disclosure
Grant sponsors: Hydro-Québec (Canada) (http://www.hydroquebec.com/en/); EDF-RTE (France) (http://www.edf.com/the-edf-group-42667.html and http://www.rte-france.com/fr/).
Grant sponsor: CIHR (Canadian Institutes of Health Research (http://www.cihr-irsc.gc.ca/e/193.html); grant number: grant #187204.
Grant sponsor: CFI/ORF (Canadian Fund for Innovation / Ontario Research Fund, http://www.innovation.ca/en); grant number: Biomedical Multimodality Hybrid Imaging grant #11358.
The funders had no role in study design, data collection and analysis, decision to publish, study approvals, or preparation of the manuscript.
Abstract
We assessed the effects of power-line frequency (60 Hz in North America) magnetic fields (MF) in humans using simultaneous electroencephalography (EEG) and functional magnetic resonance imaging (fMRI). Twenty-five participants were enrolled in a pseudo-double-blind experiment involving “real” or “sham” exposure to sinusoidal 60 Hz MF exposures delivered using the gradient coil of a MRI scanner following two conditions: 1) 10 second exposures at 3 mT (10 repetitions); 2) 2 second exposures at 7.6 mT (100 repetitions). Occipital EEG spectral power was computed in the alpha range (8-12 Hz, reportedly the most sensitive to MF exposure in the literature) with/without exposure. Brain functional activation was studied using fMRI blood-oxygen level dependent (BOLD, inversely correlated with EEG alpha power) maps. No significant effects were detected on occipital EEG alpha power during or post-exposure for any exposure condition. Consistent with EEG results, no effects were observed on fMRI BOLD maps in any brain region. Our results suggest that acute exposure (2 to 10 s) to a 60 Hz MF from 3 to 7.6 mT (30,000 to 76,000 times higher than average public exposure levels for 60 Hz MF) does not induce detectable changes in EEG or BOLD signals. Combined with previous findings in which effects were observed on the BOLD signal after a 1 h exposure to a 3 mT, 60 Hz MF, this suggests that MF exposure in the low mT range (< 10 mT) might require prolonged durations of exposure to induce detectable effects.
Keywords: Extremely low-frequency magnetic fields, 50 and 60 Hz, human, EEG,
Introduction
Experimental evidence suggests that human exposure to extremely low-frequency (ELF, < 300 Hz) magnetic fields (MF) can modulate specific aspects of human physiology [Sastre et al., 1998; Sait et al., 1999; Graham et al., 2000; Sastre et al., 2000; Ghione et al., 2004; Tabor et al., 2004] and neurophysiology [Heusser et al., 1997; Cook et al., 2004; Marino et al., 2004; Cook et al., 2005; Ghione et al., 2005; Legros et al., 2011a; Legros et al., 2015]. Due to the continuously increasing human exposure to ELF MF since the industrial revolution, there is a growing need to understand the effects and underlying mechanisms of ELF MF exposure in humans. The levels of ELF MF for safe exposure are evaluated by international organizations such as the International Commission on Non-Ionizing Radiation Protection (ICNIRP) and the Institute of Electrical and Electronics Engineers (IEEE), who provide recommendations aiming to protect the general public and workers [ICNIRP, 1998; IEEE, 2002]. In the current guidelines (from 2010), ICNIRP guidelines are expressed in terms of electric field induced at the level of tissue [ICNIRP, 2010], and provide a recommendation of 0.12 V/m at 60 Hz (corresponding, for occupational exposure, to 1000 µT according to ICNIRP, or 2710 µT according to IEEE). This value results in a MF flux density of 6366 µT using a 0.1-meter radius head (maximal value for occupational exposure of the CNS tissue of the head). For comparison purpose, the average level of 60 Hz MF exposure for the general public is on the order of 0.1 µT [WHO, 2007]. Obviously, these values have to be taken with caution, since using an homogeneous sphere model is a simplification. Indeed, the detailed head geometry, tissue anisotropies in electrical conductivity and
realistic, non-homogeneous magnetic field distributions have to be considered for accurate estimates.
Previous studies suggest that global head exposure to an ELF MF can modulate electroencephalographic activity (EEG) and evoked potentials in healthy human volunteers [Lyskov et al., 1993; Lyskov et al., 2001; Cook et al., 2004; Marino et al., 2004; Cook et al., 2005; Ghione et al., 2005]. For example, a possible increase in EEG alpha (8-12 Hz) activity due to a specific pulsed ELF MF exposure has been suggested [Cook et al., 2004; Cook et al., 2005]. In terms of effects on brain functional activity (measured using functional magnetic resonance imaging, fMRI), a 1 h human exposure to a 3 mT sinusoidal MF at 60 Hz has been reported to result in a modulation of brain activation associated with a finger tapping task or a mental rotation task [Legros et al., 2015]. Interestingly, EEG alpha activity is known to be negatively correlated with the Blood Oxygen Level Dependent (BOLD) signal [Laufs et al., 2003] measured by fMRI. Since previous work reports that exposure to ELF MF increases EEG alpha oscillations of healthy subjects [Cook et al., 2004; Ghione et al., 2005], ELF MF exposure should have resulted, if fMRI had been used in parallel, in decreased BOLD activation. Reported effects of ELF MF on brain activity often indicate that the human EEG is prone to modulation in the occipital lobe in the alpha band [Cook et al., 2002; Cook et al., 2004; Ghione et al., 2005]. Importantly, the duration of exposure is a critical factor to take into account to address the problem of biological mechanisms involved into the experimentally recorded effect: in the case of biological effects reported after the cessation of prolonged exposure (> 30 min), it has indeed been suggested that changes in
synaptic plasticity could be involved [Modolo et al., 2013a; Modolo et al., 2013b] with some recent experimental support for this hypothesis [Xiong et al., 2013]. In the case of acute exposure, changes in synaptic plasticity are unlikely since such effects take time to develop. Since recommendations at the core of ICNIRP and IEEE recommendations are based on the effects of acute exposure, there is a strong need to understand and characterize the effects of acute MF exposure at power frequencies. More specifically, ICNIRP and IEEE recommendations are based on the most reliable biological effect on humans from MF exposure, which is the perception of magnetophosphenes (flickering lights perceived eyes closed when exposed to a sufficiently strong MF) [Lovsund et al. 1980; ICNIRP 2010]. The threshold for magnetophosphene perception, which is still not precisely evaluated (taken into account in guidelines by a safety factor), needs to be therefore explored and exceeded to consolidate the estimation of its value, using high levels of MF exposure.
Therefore, in this paper, we studied the effect of acute MF exposure at power frequencies on human brain activity using hybrid neuroimaging, for MF flux density values exceeding current ICNIRP and IEEE recommendations, in order to observe acute brain tissue responses (different from magnetophosphenes).
To achieve this objective, we used EEG, a measurement of electrical activity produced by cortical sources with excellent temporal resolution (on the millisecond scale). However, EEG has fundamental limitations regarding 1) the spatial resolution (on the order of the square centimetre), and 2) the inability to measure the activity from deep brain regions.
Therefore, in order to compensate for these limitations and provide novel insights into the effects of power-frequency MF on human brain activity, we also used, simultaneously, functional magnetic resonance imaging fMRI. fMRI offers a greatly improved spatial resolution compared to EEG (cubic millimeter). By combining EEG and fMRI, we chose complementary imaging modalities in an original approach in bioelectromagnetics to characterize possible spatiotemporal patterns of brain activity changes and improve existing characterization of the MF flux density threshold resulting in reliable effects in humans.
A typical fMRI experiment involves a repetitive pattern of “task/no task” blocks, with the BOLD signal being measured in “task” and “no task” conditions. The BOLD signal is then compared between conditions, in order to identify brain regions involved during a specific task. In this paper, we used the MRI scanner itself to deliver the MF exposure, using the Z-gradient, as developed and described previously by our group [Legros et al., 2011b]. In the present protocol, no specific task was performed, and the “task” condition corresponded to the delivered MF exposure. The “no task” condition corresponded to a period free of exposure immediately following the “task” period. Unfortunately, since the MRI scanner is used both to deliver the exposure and to measure functional brain activity while the subject lies within the scanner, it is not possible to measure the BOLD signal during the “task” condition, but rather just after. However, the temporal course of the BOLD response to a stimulus is relatively slow, and features a small post-stimulus “dip” of negative amplitude following the larger positive response (due to a blood flow
increase) during the task itself [Kim and Ogawa, 2012]. As a consequence, we hypothesized the following:
1) Performing BOLD measurements immediately after MF exposure should enable the measure of possible changes in brain functional activity due to acute MF exposure.
2) Acute 60 Hz MF exposure should induce a transient decrease of EEG alpha activity in the occipital cortex along with a decrease of functional brain activation as measured by BOLD in this region.
3) Magnetophosphene perception, if reported by subjects, should be associated with a transient decrease of EEG alpha activity and BOLD signal in the occipital (visual) cortex.
Hypothesis 2 is based on the fact that the EEG alpha rhythm and BOLD response are inversely correlated, therefore an alpha decrease should result in a positive BOLD response during the stimulus, and to a negative BOLD “dip” post-stimulus. These hypotheses where tested through an experimental protocol testing two different flux/exposure durations, which were defined according to the maximal capabilities of our scanner.
Methods
General. A total of N=25 (n=13 for Group 1 5 males and 8 females, n=12 for Group 2,
-5 males and 7 females-) healthy volunteers (age 24.16 ± 6.2, standard error of the mean) were enrolled in this experiment, with ethics approval (REB #17816) from the Health Sciences Research Ethics Board of Western University (London, ON, Canada). Exclusion criteria included the presence of any metallic object implanted in body, the possibility of pregnancy (as a precautionary measure and required statement of our Ethics committee), and intake of caffeine, alcohol or tobacco in the last 24 h; or any cardiovascular/neurological disorder. After providing consent to participate to the experiment, subjects were equipped with a 64-channel MRI-compatible EEG cap (Compumedics-Neuroscan, Charlotte, NC) before moving to the MRI control room. Participants were then asked to fill an MRI screening questionnaire to ensure participant safety in the MRI environment. After the experimenter reviewed the MRI screening questionnaire to confirm safety requirements were met, the participant was setup on the MRI patient table with a pulse oximeter (for post-processing of ballistocardiogram artefacts) on the index finger from one hand and a button-press on the other hand to report possible magnetophosphene perception (flickering lights perceived when exposed to sufficiently strong time-varying magnetic fields, see [Lovsund et al., 1980]). Participants had to wear earplugs during the entire experiment to reduce the noises produced by the MRI scanner, and also to prevent them from hearing the slight buzzing sound produced by the MRI scanner during the 60 Hz MF exposure. When subjects were equipped with earplugs, they were unable to detect this buzzing sound that could provide,
in theory, an auditory clue regarding the MF exposure status. After direct interaction with the participant was finished, they were then randomly assigned to one of two different groups (Fig. 1). Subsequent interaction with the subject was through the MRI intercom using scripted, standardized instructions before each sequence. For each sequence during which EEG and/or BOLD signals were acquired, subjects were instructed to remain calm, stay still and let their mind wander. The pseudo-double-blind was partially broken at this time as the operator was now aware of the MF exposure condition.
MF exposure. 60 Hz MF exposures were delivered using a special programming of the
gradient system within a Siemens 3T MRI/PET Biograph scanner (Siemens, Munich, Germany) dedicated to research purposes. This scanner has dual simultaneous MRI/PET capability, however, the present experiment was involving the MRI functionality only and none of the PET related functions were used at any time. Two different levels of MF flux density were used in this experiment (as mentioned in Fig. 1) with a different duration and imaging paradigm for each: 3 mT (10 s), and 7.6 mT (2 s). As mentioned previously, these MF flux density values were chosen as the best compromise between the scientific questions addressed, the chosen imaging modalities, and the technical constraints of using the MRI scanner as an active 60 Hz sinusoidal MF exposure device. First, regarding the 3 mT (10 seconds) sequence, 3 mT was actually the highest MF flux density that we were able to reach (by moving the MRI table further away from the isocentre) without compromising BOLD images quality, while using the maximal Z-gradient field value (38 mT/m). Regarding the duration of 10 s, it was fixed in order to acquire a few BOLD images after each block of exposure, which resulted in 8 BOLD
images per block of 10 seconds. We therefore chose the values of 3 mT and 10 seconds were obtained. Second, regarding the 7.6 mT (2 s) sequence, 7.6 mT was the highest MF flux density value reachable at the maximal Z-gradient field value (38 mT/m) at the maximal possible distance from the isocentre still in the linearity zone of the gradient field (20 cm). This resulted in a MF flux density value of 7.6 mT. The duration itself was chosen to be short, in order to capture a possible immediate, acute EEG response to the MF exposure, while being sufficiently long in order to allow EEG analysis during the MF exposure itself. We have therefore set this duration to 2 s. Let us mention that, in theory, it would have been possible to include in the protocol periodic patient table movements further in the bore in the Z-direction to obtain a higher MF flux density before resuming to the original position to acquire fMRI images. However, these numerous table movements may had induced electric current in the subject (movement within the MRI 3T static field) with different frequency content and intensity than those of interest, potentially interfering with the effects we aimed to identify. Finally, during each exposure condition, subjects had to keep their eyes closed in order to maximize alpha activity, and also to allow for magnetophosphene perception (which are reported to be observed best eyes closed).
Fig. 1. Neuroimaging and 60 Hz MF exposure protocol followed for Groups 1 (N=13)
and 2 (N=12). Imaging modalities used are indicated for each MF exposure conditions (3 and 7.6 mT), along with the type of exposure (“sham” and “exposed”), exposure duration and number of repetitions. Let us note that the “exposed” group in the 7.6 mT condition consisted in succession of 100 exposure epochs separated each by 2 seconds free of exposure.
EEG. Subjects were setup using an MRI-compatible system, 64-channel EEG cap
connected to a Synamps 2 amplifier (Compumedics-Neuroscan, USA) synchronized with the MRI scanner clock. EEG electrodes were pre-filled using QuikCell sponges (Compumedics-Neuroscan, USA) before being expanded using injection of a saline solution to decrease electrodes’ impedance below 10 kΩ. Impedances values were checked 1) during the EEG cap setup; 2) once the subject was setup on the MRI patient table before beginning the imaging and exposure protocol; and 3) between each MRI sequence; to ensure optimal EEG signal quality throughout the entire experiment. To
maximize signal-to-noise-ratio of the EEG signal in the MRI environment, the MRI Cold Head device (used to retain the helium cooling for the MRI coil in liquid form to maintain superconductivity) was turned “off” for the entire experiment. As can be seen in Figure 1, EEG was recorded continuously, even during imaging and MF exposure sequences, thanks to the MRI-compatibility of our EEG system. Artefacts induced in the EEG signals due to the MRI environment, such as ballistocardiogram or gradient field artefacts; were post-processed before bandpass-filtering between 5 and 15 Hz using CURRY 7.0 (Compumedics-Neuroscan, USA). The EEG spectral power in the alpha band was calculated for the “exposure” and “sham” conditions for occipital electrodes (O2, O1 and OZ), for each of the three MF exposure conditions aforementioned using Matlab (The Mathworks, USA) custom-made scripts. Regarding the 3 mT exposure sequence (10 s), we calculated the alpha power of the EEG on the averaged 10-second EEG responses both in the “sham” and in the “exposure” condition (over the 12 repetitions). Regarding the 7.6 (2 s on vs. 2 s off, 100 repetitions), we performed an averaging of the 100, 2 s epochs during exposure, similarly to the 100 epochs without exposure. An ANOVA with multiple comparisons and a within/between subject factor was conducted to detect possible significant effects of the 60 Hz MF exposure on EEG alpha power. The standard p-value of 0.05 was used as a threshold for significance (Bonferroni-corrected value).
fMRI. Two novel fMRI sequences were designed and developed (in collaboration with
Siemens Canada, Montreal) specifically for this experiment in order to perform functional imaging and deliver MF exposure within the same imaging sequence. The first
sequence interleaved BOLD blocks with MF exposure blocks (see Fig. 2, top row), and
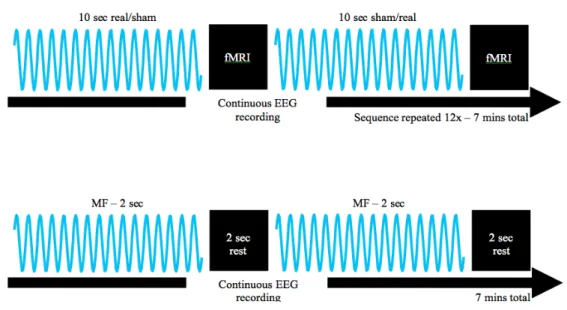
aimed to detect post-stimulus decreases in BOLD signal [Kim and Ogawa, 2012]. In this design, we considered the 10-second, 3 mT MF exposure as the stimulus. Another constraint was that it is not possible to simultaneously perform BOLD imaging and deliver MF exposure (both involving the MRI scanner Z-gradient). For this sequence, a total of 96 functional images (12 repetitions with 8 images per repetition) were acquired using the following parameters: TR=2540 ms (repetition time), TE=45 ms (echo time), FOV=192x192 mm (field of view), matrix size 64x64 (image resolution), slice thickness=3.5 mm. MF exposure and BOLD imaging blocks were 10000.5 and 10160 ms in duration (10.0005 and 10.16 s), respectively. In other words, BOLD images were acquired during blocks of 10 seconds, which immediately followed each exposure block (either “real” or “sham”). The second sequence, used for the 7.6 mT conditions (see Fig. 2, bottom row) aimed to provide MF exposure (100 blocks of 2 s separated by 2 s without exposure for the 7.6 mT condition) while the EEG was simultaneously recorded. The design of these sequences is illustrated in Figure 2.
Fig. 2. Top row. fMRI sequence 1 designed to record possible evoked responses in the
EEG due to short episodes (10 s) of MF exposure, and also possible functional brain activation immediately after exposure using BOLD.Bottom row. Illustration of sequence
2, designed to record possible responses in the EEG evoked by intermittent 7.6 mT 60 Hz MF exposures. In this specific condition, the MRI scanner is purely used as an MF exposure device, since the MRI Z-gradient coil is used to provide the 60 Hz MF exposures. This condition was delivered for all subjects, and was performed as the last sequence for both groups. EEG was continuously recorded (with and without MF exposure).
In order to combine functional and anatomical images during post-processing, a complete anatomical image of each subject’s brain was acquired (176 images total) prior to functional images. Anatomical and functional images were then imported in BrainVoyager QX 2.8 (Brain Innovation, The Netherlands), and correlated before being transformed in the standard Talairach space to enable group analysis. Functional images
were then analyzed using BrainVoyager QX using a general linear model (GLM), while the Bonferroni correction was utilized to account for multiple comparisons.
Note that, in an attempt to deliver with the MRI Z-gradient the highest MF flux density possible, we identified a maximum value of 3 mT as a compromise between the quality of fMRI images and the MF flux density. As a reminder, at the MRI bore isocentre, the MF flux density has zero variation applied to the static MF (3T) and linearly increases up to a certain distance from the isocentre along the Z-axis before decaying (for our specific scanner, 20 cms). In this study, the maximal usable Z-gradient value avoiding MRI amplifiers safety shutoff (built-in MRI software safety preventing amplifiers heating and damage) was 38 mT/m, translating into a maximal MF flux density variation of 7.6 mT that can be repeatedly delivered during short periods of time (on the order of three s). Regarding the use of fMRI along with MF exposure, given that the quality of fMRI images can be preserved up to approximately 8 cms from the isocentre on our specific MRI scanner, this resulted in a 3 mT MF exposure using a Z-gradient value of 38 mT/m. In addition, in an attempt to use the maximum MF flux density, we also included a condition including EEG only (no fMRI) with repeated 7.6 mT MF exposure (as detailed in the Methods Section) at 20 cms from the isocentre. This supplementary condition involving EEG was added to identify possible responses evoked by short MF stimulus (event-related potentials, ERPs). Let us mention that the same sequence was used for the 7.6 mT in both groups, since it involved both exposed and non-exposed epochs (2 seconds each, 100 repetitions), enabling the comparison of EEG alpha power with and without exposure. This protocol was designed on the model of an Evoked-Related
Potential (ERP) protocol, treating the MF exposure as the stimulus, hence we did not include a sham-sham condition (which would correspond to look for a response to no stimulus).
Questionnaires
Before being setup in the MRI scanner, subjects had to complete a standard MRI screening questionnaire for their safety, ensuring that they did not have metallic implants or tattoos for example. Subjects were then setup in the MRI room once the experimenter validated satisfactory replies to the MRI screening questionnaire (no counter-indication for MRI). After each of the three MF exposure conditions, subjects were asked to answer, through the MRI intercom, a questionnaire related to the MF exposure condition they just completed. They had to rate their level of comfort (1=best, 10=worst), and level of perceived stress (1=worst, 10=best) for each sequence. Subjects were also asked if they had any perception of magnetophosphenes (described as “flickering lights” occurring in the field of vision eyes closed in the absence of light).
Results
In this section, the acronyms “sham” and “exp” are used to designate the sham condition (no exposure) and the exposure condition, respectively.
Levels of stress and comfort
In the 3 mT 60 Hz sinusoidal MF condition, stress scores for exposed subjects were not significantly different from sham subjects (p=0.22, F=0.77, 7.3 in the sham group vs 6.5 in the exposed group, standard t-test). No significant difference in the level of comfort was found between the two groups (p=0.33, F=0.41, 3.5 in the exposed group vs 3.15 in the sham group). In the 7.6 mT condition, levels of stress were comparable (7.84 for the sham group vs. 7.66 for the exposed group) while the level of comfort was slightly decreased in the exposed group (3.08 in the exposed group vs. 2.77 in the sham group); but these differences in stress and comfort were not significant (p=0.42, F=0.7; and p=0.32, F=0.6; respectively). Overall, levels of stress and comfort were not statistically different in any of the two tested MF exposure conditions.
Occipital EEG alpha power
We present below results regarding EEG spectral power calculated on the occipital electrodes (O2, O1 and OZ) in the alpha range (8-12 Hz) for the two aforementioned MF exposure conditions.
• 3 mT, 60 Hz condition (10 s, 12 repetitions)
We present in Figure 3 the EEG results regarding the 3 mT MF exposure condition, that involved 10 s duration blocks, with 12 blocks of exposure.
Fig. 3. EEG alpha power (in µV2 per Hz) in occipital electrodes without (“sham”) and with (“exp”) exposure to a 60 Hz MF at 3 mT (10 s blocks, repeated 12 times) delivered using the MRI Z-gradient coil (n=13 and n=12 subjects for Groups 1 and 2, respectively). As a reminder, subjects in Group 1 were never exposed to the 3 mT MF exposure during this sequence, while subjects in Group 2 were alternatively exposed (3 mT, 60 Hz) and not exposed (no MF). Error bars represent standard error of the mean (SEM).
The ANOVA conducted on the results shown in Figure 3 concluded that there was no main effect of the exposure factor (“no MF” vs. “MF”) for any of the three occipital electrodes regarding EEG alpha power (O1: F = .278, p = .6, partial η2 = .01, power = .08; O2: F = .001, p = .97, partial η2 < .01, power = .05; OZ: F = .493, p = .49, partial η2 = .02, power = .1); and no exposure x group (“actual exposure” vs. “sham exposure”) interaction effect (O1: F = .950, p = .34, partial η2 = .04, power = 0.15; O2: F = 2.057, p
• 7.6 mT, 60 Hz condition (2 s, 100 repetitions)
Finally, we present EEG results obtained in the second condition in Figure 4.
Fig. 4. EEG alpha power (averaged over the 100 repetitions, expressed in µV2 per Hz) in
occipital electrodes without (“sham”) and with (“exp”) exposure to a 60 Hz MF at 7.6 mT (2 second blocks, repeated 100 times) delivered using the MRI Z-gradient coil. Error bars represent standard error of the mean (SEM).
Regarding the 7.6 mT MF exposure condition, results shown in Figure 4 regarding EEG alpha power did not identify any significant exposure effect for any of the three occipital electrodes (O1: F = 1.265, p = .27, partial η2 = .05, power = .19; O2: F = 1.285, p = .27, partial η2 = .05, power = .19; OZ: F = 3.483, p = .07, partial η2 = .13, power = .43).
Brain functional activation - fMRI
In order to detect possible differences in brain functional activation due to the 3 mT 60 Hz MF exposures (10 s, 12 repetitions), we produced BOLD activation maps as a subtraction of “exposure” minus “rest” images (see Fig. 2), where the “exposure” condition could be either “MF exposed” (“exp”) or “sham”. We present in Figure 5 the GLM results regarding fMRI group results (N=25), and emphasize the left motor cortex and cerebellum. The reason for this emphasis is that, in a previous experiment, these regions have been shown to have their activity modulated in a finger tapping task after a 60-min exposure to a 60 Hz MF of identical MF flux density (3 mT, see [Legros et al., 2011b; Legros et al., 2015]). However, since the experimental protocol was different (e.g., a motor task was involved, whereas no task was included in the present study), it was not obvious that these regions could be modulated in the present experiment.
Fig. 5. Example of GLM results in the left cerebellum (left panel) and in the left motor
cortex (right panel). No significant changes (increase or decrease) of functional activation are observed. Results are displayed over the averaged anatomical image (over the brain images of the 25 participants), and use a Bonferroni-corrected p-value of 0.05.
As can be seen in Figure 5, the GLM analysis did not reveal any brain region with significant change in functional activation, including the left cerebellum and motor cortex (p > 0.05 for every voxel, Bonferroni-corrected value). This result is consistent with the absence of effects on the EEG alpha power for this specific MF exposure condition. This
lack of effects after a shorter MF exposure duration (but identical MF flux density and frequency) than in previous work [Legros et al., 2011b; Legros et al., 2015] is commented in Discussion.
Buttonpress data
No subject among the 25 enrolled in this study reported any perception of magnetophosphenes, which was confirmed both from the absence of buttonpresses during the course of the experiment and from verbal confirmation when completing the questionnaire following exposure sequences. This absence of magnetophosphene perception is consistent with the lack of changes in EEG alpha activity or functional activity as assessed by BOLD.
Discussion
We have presented the results of an experiment integrating simultaneous EEG and fMRI investigating the effect of two 60 Hz MF exposure conditions of different MF flux densities (3 and 7.6 mT) and durations (2 and 10 s) on 1) cortical electrical activity, and 2) brain functional activity (related to oxygen consumption by brain tissue). To the best of our knowledge, this study is the first using EEG and fMRI simultaneously to explore the effects of power-line frequency MF above reference levels for the general public and workers. The MF flux density and exposure duration values were chosen as the best compromise between our MRI scanner specifications (linked to the MF flux density that
it is possible to produce using the Z-gradient) and neuroimaging data quality in order to detect changes in brain electrical/functional activation due to acute MF exposure.
The fMRI BOLD maps produced, aiming to identify immediately post-exposure (60 Hz, 3 mT, 10 s, 12 repetitions) acute effects on brain functional activation did not identify any significant measurable effects. As mentioned previously, since the MF exposure was delivered using the MRI Z-gradient coil, it was not possible to perform at the same time fMRI BOLD and MF exposure, leading to the choice of measuring the well-established post-stimulus BOLD decreased response. Interestingly, EEG data provides a consistent view with BOLD (acquired simultaneously) results, suggesting an absence of EEG effects due to the 3 mT 60 Hz MF exposure on brain electrical or functional activity. It is worth mentioning that the level of MF flux density during this sequence was identical to previous research in our group [Legros et al., 2015], while the exposure duration was different (60-min in previous research, 10-second repeated 12 times in the present study). In terms of accumulated time of exposure, it sums up to 2 min for the current study versus 60 min in previous research where significant effects on brain functional activation were identified [Legros et al., 2015]. Therefore, participants to the present study have been exposed for a duration 30 times lower, with an identical MF flux density, suggesting that MF exposure duration might be a critical parameter in possible neurophysiological effects. Our current results support that, for a 60 Hz sinusoidal MF at 3 mT, there might exist a minimal exposure duration (between 2 and 60 min) required to induce brain activity modulation; and that no acute effects are induced on brain electrical or functional activity. Importantly, our EEG and fMRI results consistently point at an
absence of acute electrical/functional activity modulation due to a 10-second 3 mT MF exposure at 60 Hz. Regarding EEG results acquired at the highest 60 Hz MF flux density exposure in this study (7.6 mT, 2 s, 100 repetitions), no significant effects were found on occipital EEG alpha power (p=0.084).
The absence of neurophysiological effects in humans, observed in the present study as a result of 60 Hz MF exposures at 3 and 7.6 mT, is informative in terms of possible interaction mechanisms between power-line frequency MF and the central nervous system. Considering these results in the light of previous research in which effects were observed on brain functional activation with a longer MF exposure period [Legros et al., 2015] suggests the possibility of a “cumulative effect” of the exposure, which would take a certain time to buildup. One possible biological substrate for this effect is the modulation of ‘synaptic plasticity’, which is one plausible candidate explaining the persistence of effects after exposure, and also that effects take place after some time [Modolo et al., 2013a; Modolo et al., 2013b]. This possibility is supported by recent experimental results on synaptic plasticity mechanisms in rats exposed to 50 Hz MF [Xiong et al., 2013]. To summarize, our results do not provide support for acute effects on brain electrical activity and functional activation due to 60 Hz sinusoidal MF exposure up to 7.6 mT (i.e. about 76,000 times higher than the typical daily exposure of the public to power-line frequency MF). However, these results do not rule out the possibility that subtle residual effects might be induced at these levels for longer MF exposure periods. Importantly, there remains the possibility that effects of the MF exposure protocols used in this study were affected by the onset of the MRI Z-gradient coil. When MRI gradient
coils are turned on, the frequency content of the produced MF can reach several hundreds of Hertz, and it cannot be excluded that this interfered with the EEG or BOLD physiological response that we aimed to identify. That being said, in a previous study (Legros et al. 2015), we were able to identify changes in BOLD activation in a group exposed to a 60 Hz MF as compared to a sham group. This demonstrates, even if the exposure duration in this previous study (Legros et al., 2015) was longer than in the present study (60 min vs. 10 s) that the experimental protocol is in theory able to detect physiological changes due to MF exposure as assessed by BOLD.
One limitation of our study, and more specifically regarding functional brain activation results as measured by BOLD imaging, is that the post-stimulus decrease in the BOLD signal (post-stimulus, the stimulus being the 10-second MF exposure) that we were aiming to detect is lower in amplitude compared to the increase in BOLD signal that is expected during a motor or cognitive task. Consequently, it is not possible to exclude the possibility that the 60 Hz MF exposure induced a decrease in the BOLD signal immediately post-exposure, but that the signal-to-noise ratio was too low to be detected with our BOLD imaging parameters. One possible solution to overcome this issue would be to increase the number of BOLD images in the sequence, however this would increase the chances of subjects moving excessively or falling asleep given that the current sequence lasts over 8 min. Also, if the 60 Hz MF exposure effect is purely acute, it is possible that the associated BOLD response decays faster than it is possible to measure it, which might result in a failure to detect an effect. Second, the amplitude of the BOLD response undershoot is significantly smaller than the amplitude of the main (positive)
BOLD response, which means that the amplitude of the effect due to the MF exposure might be too small to be detected using our experimental protocol. Third, there were no published values on using BOLD to image short-term effects of MF exposure, which we could have used as guides for our experimental protocol. Consequently, in the limits of what can done realistically using an MRI as an active MF exposure device, we did not detect any changes in post-stimulus brain activation due to 60 Hz sinusoidal MF exposures using BOLD. Based on the results from the O1 electrode for example, we can compute a posteriori for the 3 mT condition that the required number of subjects to reach a statistical power of 0.8 for our observed partial η2 of .01 and p-value (on the order of .6) would have been 32. Therefore, what we can conclude from the statistical power of our study, is that our results do not point at any effect on EEG signals, but cannot completely exclude that some effects are present. If they exist, the effect size would be a 20% difference or less in the EEG alpha spectral power.
Finally, none of the subjects enrolled in this experiment reported the magnetophosphene perception. Previous reports indicated that the magnetophosphene threshold was between 5 and 10 mT at 20 Hz, and increases with frequency [Lovsund et al., 1980], therefore the absence of magnetophosphene perception in our study is consistent with these previous reports.
Conclusion
We conducted a simultaneous EEG/fMRI experiment in up to 25 healthy human volunteers to identify possible neurophysiological correlates of 60 Hz sinusoidal MF
exposure effects. Two conditions of 60 Hz sinusoidal MF exposures were tested (3 mT, 10 s, 12 repetitions; 7.6 mT, 2 s, 100 repetitions). First, in the 3 mT condition, our results did not identify any significant acute effect on post-stimulus fMRI BOLD signal, which was confirmed by an absence of occipital EEG changes in the alpha range. Second, in the 7.6 mT condition where EEG only was monitored, there was no significant effects on occipital EEG alpha activity. Overall, we did not identify any significant effect of power-line frequency 60 Hz sinusoidal MF exposure at 3 and 7.6 mT for durations from 2 s to 10 s, either on human brain electrical activity as recorded by EEG, or functional activation as measured with fMRI BOLD. No magnetophosphene perception was reported by the subjects. Taken together, our results support the absence of specific acute effects on human brain activity as a result of acute power-line frequency MF exposure up to 7.6 mT. These results suggest that power-frequency MF cannot trigger acute effects on the central nervous system detectable using the currently fMRI and EEG technologies below the magnetophosphene detection threshold, which is consistent with the basic restrictions and the reference levels recommended by both ICNIRP and IEEE [ICNIRP, 2010; IEEE, 2002].
Acknowledgments
The authors thank Drs. Jean Théberge (Lawson Health Research Institute, London, ON) and Raphaël Paquin (Siemens Canada, Montréal, QC) for their help in programming and installing the MF sequences on the MRI scanner.
References
Cook CM, Thomas AW, Keenliside L, Prato FS. 2005. Resting EEG effects during exposure to a pulsed ELF magnetic field. Bioelectromagnetics 26:367-376.
Cook CM, Thomas AW, Prato FS. 2002. Human electrophysiological and cognitive effects of exposure to ELF magnetic and ELF modulated RF and microwave fields: a review of recent studies. Bioelectromagnetics 23:144-157.
Cook CM, Thomas AW, Prato FS. 2004. Resting EEG is affected by exposure to a pulsed ELF magnetic field. Bioelectromagnetics 25:196-203.
Ghione S, Del Seppia C, Mezzasalma L, Bonfiglio L. 2005. Effects of 50 Hz electromagnetic fields on electroencephalographic alpha activity, dental pain threshold and cardiovascular parameters in humans. Neurosci Lett 382:112-117. Ghione S, Del Seppia C, Mezzasalma L, Emdin M, Luschi P. 2004. Human head
exposure to a 37 Hz electromagnetic field: effects on blood pressure, somatosensory perception, and related parameters. Bioelectromagnetics 25:167-175.
Graham C, Sastre A, Cook MR, Kavet R, Gerkovich MM, Riffle DW. 2000. Exposure to strong ELF magnetic fields does not alter cardiac autonomic control mechanisms. Bioelectromagnetics 21:413-421.
Heusser K, Tellschaft D, Thoss F. 1997. Influence of an alternating 3 Hz magnetic field with an induction of 0.1 millitesla on chosen parameters of the human occipital EEG. Neurosci Lett 239:57-60.
ICNIRP. 1998. Guidelines for limiting exposure to time-varying electric, magnetic, and electromagnetic fields (up to 300 GHz). International Commission on Non-Ionizing Radiation Protection. Health Phys 74:494-522.
ICNIRP. 2010. Guidelines for limiting exposure to time-varying electric and magnetic fields (1 Hz to 100 kHz). Health Phys 99:818-836.
IEEE. 2002. C95.6 - IEEE Standard for safety levels with respect to human exposure to electromagnetic fields, 0-3 kHz. IEEE: New York.
Kim SG, Ogawa S. 2012. Biophysical and physiological origins of blood oxygenation level-dependent fMRI signals. Journal of cerebral blood flow and metabolism : official journal of the International Society of Cerebral Blood Flow and Metabolism 32:1188-1206.
Laufs H, Kleinschmidt A, Beyerle A, Eger E, Salek-Haddadi A, Preibisch C, Krakow K. 2003. EEG-correlated fMRI of human alpha activity. Neuroimage 19:1463-1476. Legros A, Corbacio M, Beuter A, Modolo J, Goulet D, Prato FS, Thomas AW. 2011a.
Neurophysiological and behavioral effects of a 60 Hz, 1,800 muT magnetic field in humans. Eur J Appl Physiol:1751-1762.
Legros A, Miller J, Modolo J, Corbacio M, Robertson J, Goulet D, Lambrozo J, Plante M, Souques M, Prato F, Thomas A. 2011b. Multi-modalities investigation of 60 Hz magnetic field effects on the human central nervous system. Electra 256:4-18. Legros A, Modolo J, Brown S, Roberston J, Thomas AW. 2015. Effects of a 60 Hz
Lovsund P, Oberg PA, Nilsson SE, Reuter T. 1980. Magnetophosphenes: a quantitative analysis of thresholds. Med Biol Eng Comput 18:326-334.
Lyskov E, Juutilainen J, Jousmaki V, Hanninen O, Medvedev S, Partanen J. 1993. Influence of short-term exposure of magnetic field on the bioelectrical processes of the brain and performance. Int J Psychophysiol 14:227-231.
Lyskov E, Sandstrom M, Mild KH. 2001. Provocation study of persons with perceived electrical hypersensitivity and controls using magnetic field exposure and recording of electrophysiological characteristics. Bioelectromagnetics 22:457-462.
Marino AA, Nilsen E, Chesson AL, Jr., Frilot C. 2004. Effect of low-frequency magnetic fields on brain electrical activity in human subjects. Clin Neurophysiol 115:1195-1201.
Modolo J, Thomas AW, Legros A. 2013a. Neural mass modeling of power-line magnetic fields effects on brain activity. Frontiers in computational neuroscience 7:34. Modolo J, Thomas AW, Legros A. 2013b. Possible mechanisms of synaptic plasticity
modulation by extremely low-frequency magnetic fields. Electromagnetic biology and medicine 32:137-144.
Sait ML, Wood AW, Sadafi HA. 1999. A study of heart rate and heart rate variability in human subjects exposed to occupational levels of 50 Hz circularly polarised magnetic fields. Med Eng Phys 21:361-369.
Sastre A, Cook MR, Graham C. 1998. Nocturnal exposure to intermittent 60 Hz magnetic fields alters human cardiac rhythm. Bioelectromagnetics 19:98-106.
Sastre A, Graham C, Cook MR. 2000. Brain frequency magnetic fields alter cardiac autonomic control mechanisms. Clin Neurophysiol 111:1942-1948.
Tabor Z, Michalski J, Rokita E. 2004. Influence of 50 Hz magnetic field on human heart rate variability: linear and nonlinear analysis. Bioelectromagnetics 25:474-480. WHO. 2007. Extremely Low Frequency Fields Environmental Health Criteria
Monograph No.238. Geneva: WHO.
Xiong J, He C, Li C, Tan G, Li J, Yu Z, Hu Z, Chen F. 2013. Changes of dendritic spine density and morphology in the superficial layers of the medial entorhinal cortex induced by extremely low-frequency magnetic field exposure. PloS one 8:e83561.