Detection of Brain Metabolites in
Magnetic Resonance Spectroscopy
by
Trina Kok
B.Eng, Electrical and Computer Engineering Duke University, 2005
MASSAHUSETTS INStrI E OF TECHNOLOGY
MAR
0 5
2009
LIBRARIES
Submitted to the Department of Electrical Engineering and Computer Science in Partial Fulfillment of the Requirements for the Degree of
Master of Science in Electrical Engineering and Computer Science at the
MASSACHUSETTS INTITUTE OF TECHNOLOGY Feb 2009
©2008 Massachusetts Institute of Technology. All rights reserved.
Certified by_
v' De-partment of Electrical Engineering and Computer Science Dec 29, 2008
Elfar Adalsteinsson Associate Professor of Electrical Engineering and Computer Science Associate Professor of Harvard-MIT Health Sciences & Technology Thesis Supervisor
Accepted by_
Terry P. Orlando Professor of Electrical Engineering and Computer Science Chairman, EECS Committee of Graduate Students
ARCHINE
Author
Detection of Brain Metabolites in
Magnetic Resonance Spectroscopy
by
Trina Kok
Submitted to the
Department of Electrical Engineering and Computer Science
Dec 29, 2008
In Partial Fulfillment of the Requirements for the Degree of Master of Science in Electrical Engineering and Computer Science
ABSTRACT
While magnetic resonance imaging (MRI) derives its signal from protons in water, additional and potentially important biochemical compounds are detectable in vivo within the proton spectrum. The detection and mapping of these much weaker signals is known as magnetic resonance spectroscopy or spectroscopic imaging. Among the complicating factors for this modality applied for human clinical imaging are limited chemical-shift dispersion and J-coupling that cause spectral overlap and complicated spectral shapes that limit detection and separation of several brain metabolites using MR spectroscopic imaging. Existing techniques for improved detection include so-called 2D spectroscopy, where additional encoding steps aid in the separation of compounds with overlapping chemical shift. This is achieved by collecting spectral data over a range of timing parameters and introducing an additional frequency axis, fl. Spectral editing techniques attempt to enhance metabolite signal detection along fl in order to resolve specific metabolite signals. While these techniques have been shown to improve signal separation, they carry a penalty in scan time and more complicated reconstruction compared to conventional spectroscopy, and are often prohibitive when combined with spectroscopic imaging. The task of this thesis is to characterize and optimize existing 2D spectroscopy techniques for improved metabolite resolution with reduced number of timing steps through numerical simulation and experimental validation in phantoms.
Thesis Supervisor: Elfar Adalsteinsson
Title: Associate Professor of Electrical Engineering and Computer Science; Associate Professor of Harvard-MIT Health Sciences & Technology
Acknowledgements
The completion of most undertakings is seldom, if not never a solo effort. This thesis is possible through the efforts of many people.
In addition to directing me to interesting problems, I thank my advisor, Elfar for being always encouraging and patient with my work. His overflowing optimism and profound insight
have been a great source of inspiration.
I would like to thank the members of the MRI group Borjan, Kawin, Div, Joonsung,
Adam, Padraig and Audrey for their fruitful discussions and fantastic company. Borjan has helped me a lot in setting up and troubleshooting my sequences. Kawin, Joonsung and Div have provided me useful suggestions for improving my analysis and presentation.
My family is my pillar of support. I thank my dad and mom for always putting me first in
their priorities for every decision they make, and for their encouraging and comforting weekly phone-calls. I also thank my brother who always calms my qualms with his sound advice.
My closest friends have brought me lots of cheer in the dismal winter days of Boston. I
thank Naijia for his quiet fortitude and cheerful spirit. I thank Jinwei for standing by me all these years since high school despite my sparse contact. The Singaporean community at MIT has
provided a home away from home and I really appreciate them for it.
I would like to acknowledge support from the National Science Scholarship of the
Contents
ABSTRACT... ... .... ... ... ... 3 1. INTRODUCTION ... 13 1.1. MRSI ... 13 1.2. J-COUPLING ... ... ... ... 15 1.3. 2D MRS ... ... 16 1.4. PROBLEM STATEMENT... ... ... ... ... 16 1.5. CONTRIBUTIONS ... ... 1717... 1.6. ORGANIZATION ... ... 18 2. 2D MRS ... ... ... 20 2.1. M OTIVATION ... ... ... ... .. ... ... 20 2.2. 2DJ-PRESS... ... ... ... ... 21 2.3. CT-PRESS ... ... 22 2.4. TE-AVERAGING PRESS ... ... .23 2.5. SPECTRAL EDITING ... ... .... 233. COMPARTMENTAL ANALYSIS WITH 1D MRSI ... 24
3.1. MODEL FOR METABOLITE RATIO ANALYSIS COMBINED WITH SEGMENTED STRUCTURAL IMAGING ... 24
3.2. M ETHO D... ... . ... ... 27
3.3. RESULTS AND DISCUSSION ... ... 29
4. NUMERICAL SIMULATIONS OF IDEALIZED EXCITATION FOR 2DJ-PRESS AND CT-PRESS ... 33
4.1. 2D-MRS AND 1D METHODS ... ... ... 33
4.2. SIMULATION WITH SPINEVOLUTION ... ... ... 34
4.3. ESTIMATION USING SIMULATED SPECTRA ... ... ... ***** 36
4.4. ORTHOGONALITY OF BASIS FUNCTIONS FROM SIMULATED SPECTRA ... 38
4.5. BIAS AND VARIANCE IN ESTIMATES A OF METABOLITE CONCENTRATIONS ... ... 40
5. EXPERIMENTAL ANALYSIS OF 2D-JPRESS AND CT-PRESS ... ... 47
5.1. M ETHOD... ... ... 47
5.2. ORTHOGONALITY OF BASIS FUNCTIONS FROM SCAN ... 49
6. EXPERIMENTAL ANALYSIS OF 2D-JPRESS AND CT-PRESS ... ... 52
6.1. DISCUSSION ... ... 52...52
6.2. FUTURE WORK... 53
7. APPENDIX ... ... ... ... 55
7.1. SIMULATION INPUT FILES FOR SPINEVOLUTION ... 55
7.1.1. 1D spin- echo experim ent at TE=35ms ... 55
7.1.2. 16-step 2DJ-PRESS experim ent... ... ... ... ... ... 56
7.1.3. 128-step CT-PRESS experim ent ... 57
8. BIBLIOG RAPHY ... 59
List of Figures
FIGURE 1.1H NMR SPECTRUM OF ACETIC ACID (CH3COOH) ... ... . ... 15
FIGURE 2. ENERGY TRANSITIONS FOR TWO SPINS THAT ARE WEAKLY COUPLED ... ... 15
FIGURE 3. LINE SPLITTING DUE TO WEAK COUPLING RESULTS IN TWO LINES OF RESONANCE SEPARATED BY THE COUPLING CONSTANT JAM 15 FIGURE 4. A TYPICAL HUMAN BRAIN METABOLITE SPECTRUM FROM A 1 D SPIN-ECHO ACQUISITION AT 3T WITH TE/TR = 35MS/2S FOR A VOXEL SIZE OF 8CC AT 1000HZ BANDWIDTH, 20 AVERAGES AND 1024 ADC PO INTS. ... ... .. ... ... ... ... 17
FIGURE 5. PULSE SEQUENCE OF 2DJ-PRESS [12] ... ... 21
FIGURE 6. PULSE SEQUENCE OF CT-PRESS [13] ... ... ... ... 22
FIGURE 7. AN EXAMPLE 2D SPECTRUM OF A HEALTHY RAT BRAIN. CROSS-PEAKS ARE ELIMINATED AS ENERGY IS ONLY DEPOSITED ON THE DIAGONAL OF THE SPECTRUM. [13] ... .... ... . ... 22
FIGURE 8. GRAY MATTER COMPOSITION DETERMINED FROM SEGMENTED STRUCTURAL DATA ASSUMING RECTANGULAR SOLID VOXELS FOR SPECTROSCOPIC VOXELS ASSIGNED AS CONTAINING GRAY MATTER ONLY. ... ... ... ... ... ... ... 27
FIGURE 9. WHITE MATTER COMPOSITION DETERMINED FROM SEGMENTED STRUCTURAL DATA ASSUMING RECTANGULAR SOLID VOXELS FOR SPECTROSCOPIC VOXELS ASSIGNED AS CONTAINING WHITE MATTER ONLY. .... ... ... ... . 2 8 FIGURE 10. ANALYSIS OF NAA' FOR ALD PATIENTS ... ... 30
FIGURE 11. ANALYSIS OF INS FOR ALD PATIENTS ... ... ... 30
FIGURE 12. ANALYSIS OF CHO' FOR ALD PATIENTS... 30
FIGURE 13. ANALYSIS OF GLX FOR ALD PATIENTS ... ... ... 30
FIGURE 14. ANALYSIS OF NAA' FOR CONTROL PATIENTS ... . ... ... 31
FIGURE 15. ANALYSIS OF INS FOR CONTROL PATIENTS ... ... ... 31
FIGURE 16. ANALYSIS OF CHO' FOR ALD PATIENTS ... ... ... ... ... 31
FIGURE 17. ANALYSIS OF GLX FOR ALD PATIENTS ... ... ... ... 31
FIGURE 18 COMPARISON BETWEEN ALD AND CONTROL SUBJECTS FOR THE GLOBAL VALUES OF NAA'/CR SHOWS A SIGNIFICANT DECREASE IN BOTH GRAY (P = 0.084) AND WHITE MATTER (P=0.016) IN ALD PATIENTS. P-VALUES ARE OBTAINED FROM AN ANOVA TEST ... ... 32
FIGURE 19. TIMING PARAMETERS FOR THE CT-PRESS EXPERIMENT. PRESS WAS IMPLEMENTED WITH TE = 14MS. THE LOCATION OF THE LAST 1800 PULSE IS VARIED WITHIN A FIXED INTERVAL AND THE ADC READOUT STARTS AT A FIXED TIME RELATIVE TO THE 900 EXCITATION PULSE ... 34
FIGURE 20. TIMING PARAMETERS FOR THE 16-STEP 2DJ-PRESS EXPERIMENT. PRESS WAS IMPLEMENTED WITH VARYING 35MS< TE < 185MS IN 10MS INCREMENTS. ADC READOUT IS SHIFTED ALONG WITH THE VARYING TE ... ... 35
FIGURE 21. TIMING PARAMETERS FOR THE 38-STEP 2DJ-PRESS EXPERIMENT. PRESS WAS IMPLEMENTED WITH VARYING 5MS< TE < 190MS IN 10MS INCREMENTS. ... ... 35
FIGURE 22. THE SET-UP AND SOLUTION OF THE ESTIMATION PROBLEM FROM SIMULATED SPECTRA. SIMULATED BASIS FUNCTIONS ARE WEIGHTED AND ADDED WITH NOISE TO FORM THE SIMULATED SPECTROSCOPIC DATA. FIGURE 23. INNER PRODUCT OF NOISE-FREE 1D SPECTRA OBTAINED FROM 2D-JPRESS, CT-PRESS AND 1D SPIN-ECHO AT TE = 35MS SIMULATIONS. ... .. ... ... 38
FIGURE 24. INNER PRODUCT OF NOISE-FREE METABOLITE BASIS FUNCTIONS FOR EACH TE STEP OF A 38-STEP 2DJ-PRESS EXPERIMENT . ... ... .. ... ... 39
FIGURE 25. INNER PRODUCT OF NOISE-FREE METABOLITE BASIS FUNCTIONS FOR EACH T1 STEP OF A 128-STEP CT-PRESS EXPERIMENT. ... ... 40 FIGURE 26. AVERAGE OF ESTIMATES A OF METABOLITES OF INTEREST FOR A 38-STEP 2D-JPRESS AND
128-STEP CT-PRESS SIMULATION SHOWN WITH CORRESPONDING STANDARD DEVIATION BARS ... 41 FIGURE 27. STANDARD DEVIATION OF THE ESTIMATE OF CONCENTRATION OF CR NORMALIZED WITH THE SIGNAL
ENERGY IN THE BASIS FUNCTION OF THE METABOLITE CR. STANDARD DEVIATION SHOWS VARIATION WITH TE OF A 38-STEP 2DJ-PRESS SEQUENCE. ... ... ... 42 FIGURE 28. STANDARD DEVIATION OF THE ESTIMATE OF CONCENTRATION OF NAA NORMALIZED WITH THE SIGNAL
ENERGY IN THE BASIS FUNCTION OF THE METABOLITE NAA. STANDARD DEVIATION SHOWS VARIATION WITH TE OF A 38-STEP 2DJ-PRESS SEQUENCE. ... ... 42 FIGURE 29. STANDARD DEVIATION OF THE ESTIMATE OF CONCENTRATION OF GLU NORMALIZED WITH THE SIGNAL
ENERGY IN THE BASIS FUNCTION OF THE METABOLITE GLU. STANDARD DEVIATION SHOWS VARIATION WITH TE OF A 38-STEP 2DJ-PRESS SEQUENCE. ... ... ... 43 FIGURE 30. STANDARD DEVIATION OF THE ESTIMATE OF CONCENTRATION OF GLN NORMALIZED WITH THE SIGNAL
ENERGY IN THE BASIS FUNCTION OF THE METABOLITE GLN. STANDARD DEVIATION SHOWS VARIATION WITH TE OF A 38-STEP 2DJ-PRESS SEQUENCE. ... 43 FIGURE 31. STANDARD DEVIATION OF THE ESTIMATE OF CONCENTRATION OF CR NORMALIZED WITH THE SIGNAL
ENERGY IN THE BASIS FUNCTION OF THE METABOLITE CR. STANDARD DEVIATION SHOWS LITTLE VARIATION WITH T1 STEP OF THE CT-PRESS SEQUENCE. ... 44 FIGURE 32. ZOOMED VIEW OF THE STANDARD DEVIATION OF THE ESTIMATE OF CONCENTRATION OF CR
NORMALIZED WITH THE SIGNAL ENERGY IN THE BASIS FUNCTION OF THE METABOLITE CR. STANDARD
DEVIATION SHOWS LITTLE VARIATION WITH Tl STEP OF THE CT-PRESS SEQUENCE. ... 45 FIGURE 33. STANDARD DEVIATION OF THE ESTIMATE OF CONCENTRATION OF NAA NORMALIZED WITH THE SIGNAL
ENERGY IN THE BASIS FUNCTION OF THE METABOLITE NAA. STANDARD DEVIATION SHOWS LITTLE VARIATION WITH Tl STEP OF THE CT-PRESS SEQUENCE... ... ... 45 FIGURE 34. ZOOMED VIEW OF THE STANDARD DEVIATION OF THE ESTIMATE OF CONCENTRATION OF GLU
NORMALIZED WITH THE SIGNAL ENERGY IN THE BASIS FUNCTION OF THE METABOLITE GLU. STANDARD DEVIATION SHOWS LITTLE VARIATION WITH Tl STEP OF THE CT-PRESS SEQUENCE. ... 46 FIGURE 35. ZOOMED VIEW OF THE STANDARD DEVIATION OF THE ESTIMATE OF CONCENTRATION OF GLN
NORMALIZED WITH THE SIGNAL ENERGY IN THE BASIS FUNCTION OF THE METABOLITE GLN. STANDARD DEVIATION SHOWS LITTLE VARIATION WITH Tl STEP OF THE CT-PRESS SEQUENCE. ... 46 FIGURE 36. CONCENTRATED SOLUTIONS OF CR, NAA, GLU AND GLN AT 98MM, 251MM, 500MM AND 180MM
RESPECTIVELY WERE INJECTED INTO DIFFERENT PING-PONG BALLS OF DIAMETER 40MM. THE OPENING WAS SEALED WITH WAX BEFORE WRAPPING THE PHANTOM WITH PARAFILM ... ... 47 FIGURE 37. TIMING PARAMETERS FOR THE CT-PRESS EXPERIMENT IMPLEMENTED ON SCANNER. PRESS WAS
IMPLEMENTED WITH TE = 35MS. THE LOCATION OF THE LAST 1800 PULSE IS VARIED IN 32 STEPS RESULTING IN UNDERSAMPLING IN T1. ... ... ... 49 FIGURE 38. INNER PRODUCT OF SPECTRA OBTAINED FROM 2D-JPRESS, CT-PRESS AND 1D SPIN-ECHO AT TE
= 35MS ACQUISITIONS AT 3. T SCANNER... .. ... ... ... 50 FIGURE 39. INNER PRODUCT OF METABOLITE BASIS FUNCTIONS FOR EACH TE STEP OF A 16-STEP 2DJ-PRESS
EXPERIMENT IMPLEMENTED ON A 3.0 T SCANNER... ... 51 FIGURE 40. INNER PRODUCT OF METABOLITE BASIS FUNCTIONS FOR EACH TE STEP OF A 32-STEP CT-PRESS
List of Tables
TABLE 1. CHEMICAL SHIFTS AND COUPLING CONSTANTS OF PROTONS IN GLU AND GLN AS REPORTED IN [9] WHICH ARE USED IN SIMULATION STUDIES IN CHAPTER 4... ... 21 TABLE 2. CONCENTRATIONS AND PH OF INDIVIDUAL METABOLITE SOLUTIONS INJECTED INTO PHANTOMS ... 48
1.
Introduction
Nuclear Magnetic Resonance (NMR) was discovered independently by Felix Bloch [1]
and Edward Purcell [2] in 1946. In the 1950's, NMR was used extensively in chemistry and
physics for the evaluation of molecular structure and kinematics. In 1973, Paul Lauterbur
demonstrated using linear gradient fields to spatially map molecules in a strong magnetic field.
This opened up new applications for Magnetic Resonance Imaging (MRI), particularly in medical
diagnostics for imaging soft tissue without the ionizing radiation effects of X-ray and Computer Tomography (CT) imaging.
In addition to anatomical imaging, magnetic resonance can also provide physiological and biochemical information via Magnetic Resonance Spectroscopic Imaging (MRSI, also known as chemical shift imaging (CSI)).
1.1. MRSI
MRSI is an imaging technique where one obtains a frequency spectrum of signals, e.g. brain metabolites in vivo, from an isolated volume of tissue. MRSI is based on the MR phenomenon of chemical shift, a subtle frequency shift in the signal that is dependent on the chemical environment of the particular compound. It is due to this frequency shift that there is a potential for physiological evaluation and material characterization of a volume of interest.
Chemical shift is defined as a small displacement of the resonance frequency due to
shielding created by the orbital motion of the surrounding electrons in response to the main Bo
field. By placing a sample of material in a uniform magnet, exciting it, recording the signal from its Free Induction Decay (FID), and then Fourier transforming the FID, the resultant MR spectrum shows resonances at different frequencies corresponding to different chemical shifts
[3]. The amount of displacement and the amplitude of the peaks in the spectrum depend on the molecular structure of the compound of interest.
In the presence of the main magnetic field Bo, the effective field experienced by the nucleus is
B,ff = Bo - BSo = Bo(t - o)
(1.1)
where a represents a shielding constant dependent on the chemical environment. From the
Larmor relationship, we can write the above equation as
,,ff = OC) - , o" = WO(t- )(1.2)
(1.2)
where wOa0 is the displacement of the resonant frequency. Thus the change in frequency is proportional to the magnetic field Bo. By expressing this displacement in resonant frequency in units of "parts per million" (ppm) with respect to a reference frequencyWo, the displacement in frequency can be compared across scans with different main magnetic field Bo strengths. If the
resonant frequency of the sample is ws, then the chemical shift 6 in ppm is
6 -= x 106 = - x 106 ( -- , o)x 106 because a ~ < 1 (1.3)
The frequency axis in MRSI, for historical reasons, is such that the frequency decreases
from left to right. Figure 1 shows an example of such a spectrum which is the 1H spectrum of
acetic acid (CH3COOH). The three protons of the CH3 experience a different chemical shift than
the proton in the COOH group. The valency of the oxygen in the COOH group leads to an attraction of the electron away from the proton, so that there is less shielding for the proton in
the COOH group compared to the protons in the CH3 group and the resonant frequency for
COON
12 8 4 0 -4 .4
Figure 1.'H NMR spectrum of acetic acid (CH3COOH)
1.2. J-coupling
In addition to chemical shifts caused by the shielding of electrons, subtle chemical shifts also result from J-coupling effects within molecules. Nuclei which are close to one another in
chemical shift exert an influence on each other's magnetic field and this influence is known as J-coupling. Consider a molecule containing two different spin-% nuclei, A and M, where their nuclei could be either spin-up (+%) or spin-down (-%). Without any J-coupling, we would expect one line of resonance in the frequency spectrum obtained from spectroscopic imaging of either
+2', -IA
-J-lL
Figure 2. Energy transitions for two spins Figure 3. Line splitting due to weak coupling
that are weakly coupled results in two lines of resonance separated
by the coupling constant JAm
change is allowed in one transition, so the four possible spin configurations of A and M results in four different transitions in Figure 2- two for nucleus A and two for nucleus M [4]. Thus, the frequency spectrum obtained from MRSI of nucleus M (or A) exhibits two lines of resonance with reduced amplitudes instead of a single line of resonance in Figure 3. This effect is known as line-splitting.
1.3. 2D MRS
By introducing an additional time variable, a 2D frequency spectrum of metabolites could
be obtained. The additional time variable encompasses additional information on nuclear interactions including J-coupling information. The simplest 2D MRS sequence comprises two
900 pulses with two time variables tl and t2. Figure 5 is an example of such a sequence.
Magnetization is allowed to precess freely in tl before FID detection during t2. Repeating the
experiment for a range of tl values leads to a two dimensional set of NMR data which can be
Fourier transformed in both dimensions to obtain a 2D frequency spectrum in w1 and w2.The 2D
frequency spectrum reveals coupling information between different metabolites.
1.4. Problem statement
The spectrum in Figure 4 is an example of in vivo signal from human brain, with amount of signal contributed from the water and the lipid groups in the scanned volume significantly suppressed by means of applying RF pulse that was spectrally selective. This is crucial in MRSI, since the metabolite signals of interest are of very small concentration compared to the
water and fat signals (1-10 mM for observable brain metabolites in vivo vs. ~50M for water).
Therefore, spectroscopy scans have intrinsically low SNR compared to conventional MRI of water [5].
However, low SNR is not the only challenge in MRSI. Line splitting caused by J-coupling between different nuclei of the same compound further reduces the SNR of the frequency spectrum of the metabolites. Complicated J-coupling results in multiplets for a single metabolite and these multiplets often overlap with the spectra of other metabolites, thus making metabolite quantification and detection difficult.
In addition, inherent B0 and B1 inhomogeneities depend on several factors, including
main field strength, RF coil design, and subject-induced magnetic susceptibility variations, and further complicate low-SNR metabolite estimates. Other types of signal contaminations, such as patient movement, contribute to the challenge of obtaining spectroscopic images of high quality.
NAA
ml Cho, Cr
GIx
4 3 2 1
Figure 4. A typical human brain metabolite spectrum from a 1D spin-echo acquisition at
3T with TE/TR = 35ms/2s for a voxel size of 8cc at 1000Hz bandwidth, 20 averages and 1024 ADC points.
1.5. Contributions
Several factors complicate quantification of brain metabolites, including inhomogeneities
in the Bo and B1 fields. To enable comparison across subjects under different scanning
conditions, expressing the metabolite signals as ratios to the sum of the metabolite signal from Cr and PCr (Cr') is a common technique, which while providing robustness to factors such as
partial voluming and B1 inhomogeneities, relies on inherent assumptions about the stability of a
reference signal (often Cr). Work presented in this thesis extends compartmental analysis of absolute metabolite measures to ratio measure, with applications to human imaging at 7T in adrenoleukdoystrophy (ALD) [6][7].
A second contribution of this thesis concerns 2D MRS. These methods require stepping through a range of times in order to obtain a 2D metabolite spectrum, which can yield improved spectral information for coupled or overlapping spin systems compared to conventional 1D chemical shift spectroscopy. The number of time steps depends on the methods used and
typically ranges from 16 to 128 steps. By observing the different J-modulation effects on
metabolites of interests at different time steps, it is possible to obtain some combination of metabolite spectra that will result in better resolution of metabolites. This work explores the potential combination of metabolite spectra that may contribute to a better detection of metabolites.
1.6. Organization
The remainder of this thesis is as follows. Chapter 2 contains a more detailed description of 2D MRS and spectral editing, and the predominant methods for resolving the metabolites Glutamate (Glu) and Glutamine (Gln). Chapter 3 contains the extension of compartmental analysis of MRSI absolute metabolite measures to ratio measures. Chapter 4 contains the analysis from simulated spectra of CT-PRESS, 2DJ-PRESS, TE-averaging PRESS and concatenated spectra. Chapter 5 contains the analysis of spectra of CT-PRESS, 2D-JPRESS, TE-averaging PRESS and concatenated spectra obtained from a 3T MRI scanner (Siemens,
Bibliographical Note
The problem formulation and the results of Chapter 3 have been presented at the following meeting:
* Kok T, Ratai E-M, Eichler F, Adalsteinsson E, "Analysis of 1H Metabolite Ratios Using Image Segmentation at 7T in adult patients with X-linked Adrenoleukodystrophy", Toronto, Canada, ISMRM Proc., #1596
* Ratai E, Kok T, Wiggins C, Wiggins G, Grant E, Gagoski B, O'Neill G, Adalsteinsson E, Eichler F, "Seven-Tesla proton magnetic resonance spectroscopic imaging in adult X-linked adrenoleukodystrophy," Arch Neurol. 2008 Nov;65(11):1488-94.
2.
2D MRS
2.1. Motivation
2D MR spectroscopy introduces a second frequency axis to chemical shift spectroscopy.
By notational convention, w2 (or f2) is used to resolve chemical shift, while wl (fl) encodes
additional physical characteristics of the underlying spins, often J-coupling or a combination of
J-coupling and chemical shift. The time variables corresponding to w1 and w2, are ti and t2. The
precise meaning of the additional frequency axis w, depends on the kind of experiment performed. There exist a number of different 2D MRS experiments [8], and this thesis will focus on those experiments that attempt to resolve glutamate (Glu) and glutamine (Gin) for human brain spectroscopy at 3T. Glutamate is the most abundant amino acid found in the brain at approximately 12 mM/kg [9], and acts as an excitatory neurotransmitter. Glu has four protons in two methylene groups at 2.0375ppm, 2.1200ppm, 2.3378pm and 2.3520ppm, and one proton in a methine group at 3.7433ppm that are strongly coupled with one another, giving a complex spectrum at 3T with low-intensity multiplets. The coupling constants and chemical shifts are
summarized in Table 1. The Glu spectrum overlaps with resonances of Gin, y-Aminobutyric acid
(GABA) and N-Acetyl aspartate (NAA), making detection and quantification in vivo difficult. Gin is a storage form of Glu and is present in the range of 2-4 mM/kg [9]. A large increase of Gin occurs when the Glu/Gln cycle is altered with disease [10][11]. Gin has four protons in two methylene groups at 2.1090ppm, 2.1290ppm, 2.4320ppm and 2.4540ppm and another proton in a methine group at 3.7530ppm that are strongly coupled at 3T. The coupling constants and chemical shifts of Glu and Gin as reported from Ref. [9] are summarized in Table 1. Separation of Gin and Glu is very difficult at low field, and this thesis explores methods to resolve the two metabolites.
Metabolite Group Chemical shift (ppm) Connectivity Coupling Constant J (Hz) Glutamate 1 CH 3.7433 1-2 7.331 2 CH2 2.0375 1-2' 4.651 2' 2.1200 2-2' -14.849 3 CH2 2.3378 2-3' 8.406 3' 2.3520 2'-3' 6.875 2-3 6.413 2'-3 8.478 3-3' -15.915 Glutamine 1 CH 3.7530 1-2 5.847 2 CH2 2.1290 1-2' 6.500 2' 2.1090 2-2' -14.504 3 CH2 2.4320 2-3 9.165 3' 2.4520 2-3' 6.347 2'-3 6.324 2'-3' 9.209 3-3' -15.371
Table 1. Chemical shifts and coupling constants of protons in Glu and GIn as reported in [9] which are used in simulation studies in chapter 4
2.2. 2DJ-PRESS
In 2DJ-PRESS [12], data is acquired as a function of tl = TE and t2 = time and Fourier
transformed in both tl and t2 domains. The timing sequence is shown in Figure 5. Because
J-coupling manifests itself in both f, and f2, the spectrum for coupled spins is tilted along the
450-axis in the (fl, f2) plane. In post-processing, the 2D spectrum is tilted by 450 along the diagonal to obtain the J-coupling information in f, and chemical shift information in f2. Since the signal is distributed amongst the coupled peaks, the SNR for each peak in the 2D frequency spectrum is decreased compared to equal concentration of a singlet.
F .tig r /4 t-2 1 -14 -t 2
2.3. CT-PRESS
In CT-PRESS [13], a refocusing 1800 pulse of the sequence is shifted within a constant time interval between RF excitation and signal acquisition. The scheme is shown in Figure 6. Cross-peaks in the 2D Fourier representation indicating J-coupling are eliminated because magnetization is not transferred to the cross-peaks. All magnetization is instead transferred to the diagonal spectrum which contains signals of all uncoupled spins and diagonal peaks of coupled spins. Thus, the SNR from the diagonal spectrum is increased compared to 2DJ-PRESS. SNR of coupled resonances can be further increased by optimizing the timing parameter tc for the size and number of spin couplings. However, CT-PRESS requires a considerably larger number of tl steps compared to 2DJ-PRESS. About 128 ti steps are
required for a 1H chemical shift range of 5-10ppm with sufficient spectral resolution. It is
possible to reduce the number of TE steps by noting that only signals near the diagonal will appear in the 2D CT-PRESS spectrum. Nyquist sampling theorem can be violated and this has been demonstrated by Mayer et al [14].
2.0- 7 2.5 --- ---- --- S--.-- ---- ---- -- - t - --- .--- . --- ---.3.0~ 90' 180" 180" 180" 3.0 4 RF 4.0 4 ....J. t... ... .. . . ... - . ... 4.0 3.5 3.0 2.5 2.0 1.5 f2lppm
Figure 6. Pulse sequence of CT-PRESS [13] Figure 7. An example 2D spectrum of a
healthy rat brain. Cross-peaks are
eliminated as energy is only deposited on the diagonal of the spectrum. [13]
2.4. TE-averaging PRESS
TE-averaging with a PRESS sequence [15] has been studied for resolving glutamate signal (Glu) from brain metabolites at 3T. Similar to 2DJ-PRESS, metabolite data is acquired for a
range of TE but Fourier transformed only in the t1 domain. An average of the data from different
TE's is taken and this average represents the fl=0 component of a 2D J-PRESS spectrum. Glu is reasonably resolved at 16 and 32 TE steps but the closely correlated metabolite glutamine (Gin) is difficult to obtained directly.
2.5. Spectral Editing
Spectral editing is a method of suppressing or enhancing metabolite signals by using its spin-spin coupling properties. Due to the effects of J-modulation, different timing parameters result in different metabolite spectra that can be manipulated to resolve the metabolite of interest. Spectral editing has been exploited in [16] to resolve Glu from an in vivo spectrum at 1.5T by the subtraction of metabolite spectra from TE = 12ms and TE = 60ms. However, resolution of Gin is difficult because of the strong correlation between Glu and Gin.
3.
Compartmental analysis with
1D
MRSI
In 1D spectroscopy, absolute metabolite concentrations are estimated from experimental
metabolite data via models such as LCmodel [17], which attempts to account for complexities
arising from macromolecular baseline, J-coupling, multiplets and metabolite signal overlaps. The combination of low-SNR spectroscopy with segmented structural data has been used to provide brain metabolite estimates in separate tissue compartments [18]. Factors such as partial
voluming, coil loading and inhomogeneities in the Bo and B1 fields under different scanning
conditions are challenges to using absolute metabolite estimates for quantification purposes. To correct for comparison across subjects under these different scanning conditions, expressing the metabolite signals as ratios to the sum of the metabolite signal from Cr and PCr (Cr') is a common technique. The work in this chapter extends compartmental analysis of absolute metabolite measures to ratio measure. The detection of metabolites such as NAA provides an indication of neuronal function and could help characterize axonal integrity in X-linked adrenoleukodystrophy (X-ALD).
3.1. Model for Metabolite Ratio Analysis Combined with Segmented Structural Imaging
The model for the gray and white mater contribution to the signal observed for metabolite M is based on the following model from Ref. [19].
y, = g, .Mg + w, -M w + n, (3.1)
where y is the measured metabolite signal, gi and w; are the structural representations of the gray and white matter, Mg and Mw are the gray and white matter contributions to the signal for metabolite M, and ni is the additive Gaussian noise. By expressing MV/Mg as rg,,, a nonlinear
two-dimensional search for Mg and Mw is avoided so that we need only estimate one nonlinear
parameter rgw and one nonlinear parameter Mw.
Y, = MW g, -rg + W,) + n, (3.2)
Using the method of variable projection [20], the least square solution is found first by expressing the estimate Mw assuming rgw is known, as
N
W = N (3.3)
where
f, = g, . r + w, (3.4)
and N is the total number of spectroscopic voxels used in the analysis.
The estimated gray to white ratio F,, is found by evaluating Eq.5 after substituting Eq. 3
into Eq. 2.
N
min y, -M I f (3.5)
rg t=l
Upon finding the optimum value forFw, M~ was found via Eq. 3, and Mg determined via Eq. 6.
Mg = MW • rA g (3.6)
We would like to obtain a model for the signal observed for the metabolite M as a ratio to
the signal observed for Cr'. Using Eq. 1, the ratio r of the signal observed for metabolite M to
the signal observed for Cr', then becomes Y,M g, .-M + w, -M, + n,
r, -
g
(3.7)y,1cr g, .Cr'g + w, Crw + ncr,
g, Mg w, M n(3.8) r,= + + (3.8) g, Crg +w, Cr' +n,c. g, Cr'g +w, •Cr' +n,c g, •Cr'g +w, Cr' +nc, g, Mg M, +nIM r _+_ + -- (3.9) Cr , n =, Cr +- Crg, g, .Cr , + w, .Cr', + nc, ( + Cr g Cr g + ' w, + g, Cr +Cr
The model for the metabolite ratio observed in a particular voxel r, for the metabolite M is
r= +g w (3.10)
=
Cr,
Cro
g = g' 1 w = w, (3.11) Cr ' Cr g •+w --W w,+g, . g, +w, Cr w, +I Cr Cr',We aim to determine the optimal values of the global quantities Mg /Cr'g and Mw /Cr'w for
each subject, which are the gray and white matter contributions to the metabolite M expressed
as ratios to the gray and white matter contributions to the metabolite Cr'. Mg /Cr'g and Mw /Cr'w
indicate the amount of metabolite signal ratio r for particular g" and w;" in a certain voxel. Cr'g and Cr'w were obtained by estimating r,, = Cr'g / Cr' using the absolute metabolite data of Cr' from each voxel of the subject. This estimate of rgw was then used to determine g," and wi". With gi" and wi" expressed as shown, the procedure for finding the optimal values of Mg /Cr'g and Mw /Cr'w is equivalent to the procedure for finding the optimal values of Mg and Mw of Eq. 1 where g;
Method
All imaging was done on a 7.OT MRI scanner (Siemens AG, Erlangen, Germany). The
spectroscopic VOI for the 2D 'H MRSI was selectively excited using PRESS (TE = 35ms, TR =
2s) with CHESS water suppression and six spatial outer volume suppression pulses for fat
suppression. A spectroscopic voxel size of 2.3cm3 resulted from partition the FOV of 20cm with
16 x 16 phase encoding steps. The spectra bandwidth was 4000Hz and the water suppression
bandwidth was 120Hz. The structural image at a resolution of 0.56 x 0.56 x 1 mm3 = 0.31 mm3
were acquired with an axial MPRAGE sequence with timing parameters TE/TR/TI =
3.6/2500/1100 ms.
Gray matter composition of voxels
assigned as gray matter only
20 18 16 -14 • 12 S10 - 6-4
I .4 r4 MLUM
1
lil
0
,r
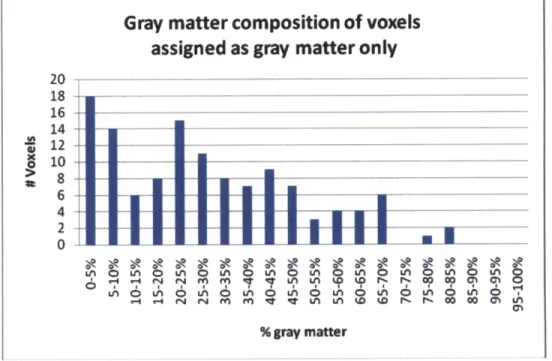
6i I tI~~I16I6I6.6_6 y-4 U4 f4 fLA n 6 0 q LA LA D 0' r a n 0 V- - M V V 0 n W W -r W W 0 I IM % gray matterFigure 8. Gray matter composition determined from segmented structural data assuming rectangular solid voxels for spectroscopic voxels assigned as containing gray matter only.
We demonstrate the use of the model for the metabolite ratio for data obtained from twelve ALD patients and nine healthy subjects. The gray and white matter composition of each of the subject's structural image was determined by a combination of automated segmentation using Freesurfer [21][22] and manual segmentation, and registered to the spectroscopic data. 27 _fl ~II_ 3.2. ~I~: ) !
We assumed an idealized rectangular function for the point spread function of the structural
acquisition and for the spectroscopy. In a previous analysis [7][23], only spectroscopic voxels
manually assigned as containing 100% white matter (predominantly white) or 100% gray matter
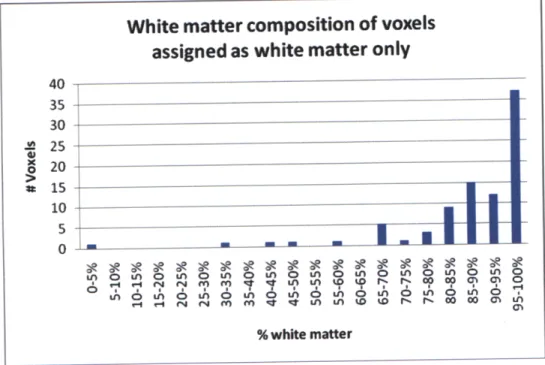
(predominantly gray) were used. Figure 8 and Figure 9 illustrate the gray and white matter
composition as determined from segmentation of the spectroscopic voxels that were previously
manually assigned as containing 100% white matter or 100% gray matter. For the voxels
assigned as containing 100% gray matter, the gray matter content is significantly overestimated.
Figure 9. White matter composition determined from segmented structural data assuming
rectangular solid voxels for spectroscopic voxels assigned as containing white matter only.
For the voxels assigned as containing 100% white matter, the assignment approximates the
content better. This is due to the fact that the anatomy of the selected VOI is such that
gray-matter voxels of full volume are less common than those of white gray-matter. To better reflect the
content of gray and white matter and their corresponding changes in metabolite concentrations,
we incorporated segmented structural data for the same set of spectroscopic voxels into the
analysis of ratios for the following four metabolites, NAA' (N-Acetyl-Aspartyl-Glutamate(NAAG) 28
White matter composition of voxels
assigned as white matter only
40 35 -30 Mc 25 x 20 I 15 -10 5 aR aaR -R 09 al in 0 Ln 0i L 0 in mL 0 In 0 0 L 0 * ~ N-4gp-4~ e~~mm % white matter
+ NAA), myo-Insitol (Ins), Cho' (Glycero-phosphoryl-choline (GPC) + Phosphoryl-choline (PC))
and GIx (Glu and Gin). This corrected metabolic segmentation has relevance to the monitoring of demyelination and axonal degeneration in X-ALD.
3.3. Results and Discussion
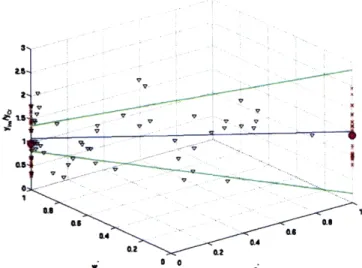
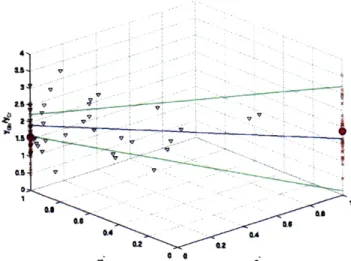
Figure 10, Figure 11, Figure 12 and Figure 13 are examples of the analysis applied to
NAA', Ins, Cho' and GIx of ALD patients. The z-axis shows values of the metabolic ratio ri and the x and y-axis shows values of gi" and wi" respectively. The red crosses ('x') in the figure are obtained by manually assigning spectroscopic voxels as either 100% gray or 100% white. The
averages of ri for both the 100% gray-matter and 100% white matter voxels are shown in purple
('.'). Based on the segmentation, most of these spectroscopic voxels are mixed-volume and their composition is represented by the black triangles in the figure ('V'). Using these
mixed-volume data and applying our model, we obtained an estimate Mg /Cr'g and Mw /Cr for each
ALD patient and averaged these values across the patients. With the averaged Mg /Cr'g and Mw
/Cr', the metabolite ratio ri is expressed as a function of g," and w" in Eq. (3.1) and represented by the blue line ('-') in Figure 10. The green lines ('-') of Figure 10 indicate one standard deviation from the averaged values.
The same procedure in obtaining Figure 10, Figure 11, Figure 12 and Figure 13 is repeated for obtaining Figure 14, Figure 15, Figure 16, and Figure 17 for the control subjects.
The Mg /Cr'g and Mw /Cr'w obtained from this analysis offers a comparison metric for changes in
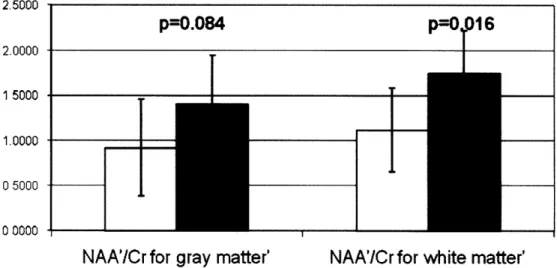
metabolite levels between ALD patients and healthy subjects and we demonstrate its use as such a metric in Figure 18 where an ANOVA test was done and a significant decrease of NAA'
Figure 1 . a of N ...
w" o o
o r
Figure~ nlsso ~ ~~~~''. 10 'frADptet
Ir V 9 Fir ..... AI . . o A . . ients 1 9~b--• ... r •* . ' : I --.. n4_gc -~ :+"~~ , f •n 0~ 0 a o
Figure 1 1. Analysis of Ins for ALD patients
Figure 12. Analysis of Cho' for ALD patients
... . .. ... 1
4... I .. ...
I
-S. So 0. 4
Figure 13. Analysis of GIx for ALD patients
11 as 14 v S 000 V "
Figure 14. Analysis of NAA' for control patients
as
a sa
Figure 16. Analysis of Cho'for ALD patientsi
i. 90 , " , ; .. " . B , . v .. ... ° v" 0,8, " • ' as as as a 54 .41' ata a.
-Figure 15. Analysis of Ins for control patients
o v
Fure17,nayiso GIx for ALD patent
V II
Fiur 17. Anlyi of, G.. fo L ptet
a4 0 0
a g"
Figure 17. Analysis of Glx for ALD patients
Comparison of NAA'ICr' 2.5000 p=0.084 p=016 2.0000 TALD 15000
1.oooo
m
CTRL
0 5000 0 0000NAA'/Cr for gray matter' NAA'/Cr for white matter'
Figure 18 Comparison between ALD and control subjects for the global values of NAA'/Cr shows a significant decrease in both gray (p = 0.084) and white matter (p=0.016) in ALD patients. P-values are obtained from an ANOVA test.
4.
Numerical simulations of idealized excitation for
2DJ-PRESS and CT-2DJ-PRESS
2D MRS methods of 2DJ-PRESS and CT-PRESS were simulated with a software
package SPINEVOLUTION [24] according to timing parameters given in Ref. [15] and Ref. [13].
The performance of these 2D MRS methods were compared with the 1D spin-echo method at
TE=35ms, in terms of the accuracy of the estimation of the concentrations of the following metabolites creatine (Cr), N-acetylaspartate (NAA), glutamate (Glu) and glutamine (Gin). Metabolite NAA is included because part of its spectra centered at 2.008 ppm overlaps with the Glu multiplet centered at 2.05ppm and may potentially complicate the estimation of Glu and Gin. Metabolite Cr is added in the study because it consists only of 2 singlets and serves as an
appropriate control metabolite across the 1D and 2D MRSI methods. Simulation input files for
the simulated spectra of Glu of the 2DJ-PRESS, CT-PRESS and 1D spin-echo acquisitions are
included in the appendix.
4.1. 2D-MRS and 1D methods
In TE-averaging PRESS, the fl=0 component of the 2D spectrum from a 2DJ-PRESS
experiment forms a 1D spectrum from which Glu is resolved [15]. In addition to evaluating the
performance of this 1D TE-averaged spectrum in estimating individual metabolite concentrations, the performance of a spectrum obtained from the concatenation of individual FID's obtained from each TE value of the 2DJ-PRESS experiment was evaluated. In the rest of this thesis, this concatenated spectrum is referred to as 2DJ-PRESS-concatenated. The
performance of the 1D spectra obtained from individual TE steps of the 2DJ-PRESS experiment
was also analyzed and compared with the TE-averaged spectrum and the spectrum obtained from the concatenated FID's.
In CT-PRESS, the projection of the 2D spectrum onto the fl axis results in a 1D spectrum from which metabolites are reported reliably resolved [13]. The performance of this projected 1D-spectrum was compared with the performance of the spectrum obtained from the
concatenation of individual FID's at each t1 step of the CT-PRESS experiment. In the rest of
this thesis, this spectrum is referred to as CT-PRESS-concatenated. In addition, the
performance of the 1D spectra from each individual tl step were evaluated and compared with
the spectra obtained from the concatenated FID's and the projected spectrum.
4.2. Simulation with SPINEVOLUTION
The pulse sequences for the 2DJ-PRESS, CT-PRESS and 1D spin-echo experiments
were implemented in script files which were in turn inputted to the SPINEVOLUTION program. The simulation implemented as single voxel experiments and was executed with very short
rectangular 900 and 1800 RF pulses of length 0.5us, assuming a 3T main magnetic field.
TE= 14ms 31ms 8.5ms 8.5ms --- --- :-->;
1800 1800 i1800
900) ADCBandwidth = 1880Hz
2000 points
1800 pulse moves within this interval in At1 steps
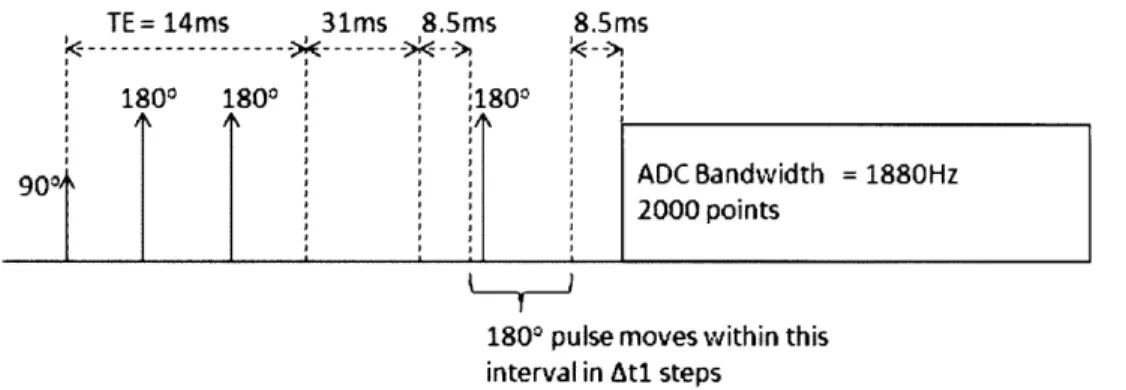
Figure 19. Timing parameters for the CT-PRESS experiment. PRESS was implemented
with TE = 14ms. The location of the last 1800 pulse is varied within a fixed interval and
the ADC readout starts at a fixed time relative to the 900 excitation pulse.
Cross-referencing Figure 19, the press sequence was implemented with TE = 14ms, and
128 t, steps were taken with Atl = 0.133ms. The spectra bandwidth in both f, and f2 were
1880Hz. The 2DJ-PRESS experiment was implemented with TE ranging from 35ms to 185ms in
increments of 10ms and at a spectra bandwidth of 5000Hz with 2000 ADC points. The TE-averaged spectrum and concatenated spectrum are obtained from this 16-step 2DJ-PRESS experiment. In order to study the effects of shorter TE times, a 38-step 2DJ-PRESS experiment
was simulated with TE ranging from 5ms to 190ms in increment of 5ms and a spectra
bandwidth of 5000Hz with 2K ADC points.
TE= 35ms;45ms...
--- --->:,
1800 1800
90o ADC Bandwidth = 5000Hz
2000 points
Figure 20. Timing parameters for the 16-step 2DJ-PRESS experiment. PRESS was implemented with varying 35ms< TE < 185ms in 10ms increments. ADC readout is shifted along with the varying TE
TE = Sms; lOms ....
--- >
1800 1800
9001
{
ADC Bandwidth = 5000Hz 2000 pointsFigure 21. Timing parameters for the 38-step 2DJ-PRESS experiment. PRESS was implemented with varying 5ms< TE < 190ms in 10ms increments.
A separate input file was written for each of Cr, NAA, Glu and Gin incorporating their respective chemical shift and J-coupling constants reported in [9]. The relaxation times of
Cr-CH3 and Cr-CH2 were inputted as T1 = 1.29s and T2 = 165ms, and T1 = 890ms and T2 =
126.5ms respectively. The relaxation times of NAA were inputted as T1 = 1.365s and T2 =
265ms. These relaxation times were obtained by averaging the reported relaxation times for
each metabolite at 3.0T across different brain regions [25]. For Glu, relaxation times were inputted as T1 = 1.2s [26] and T2 = 200ms [27]. The relaxation times for Gin were simulated to be the same as Glu due to the lack of published studies on T1 and T2 times of Gin at 3.OT.
4.3. Estimation using simulated spectra
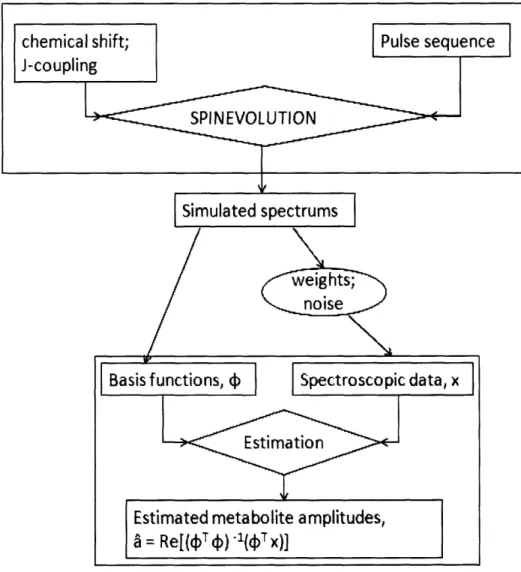
Using the spectra of Cr, NAA, Glu and Gin from simulation, a series of estimation problems are set up in order to evaluate the performance of 2DJ-PRESS and CT-PRESS on estimating individual metabolite concentrations.
In an estimation problem for spectroscopic data obtained from a scanner, individual metabolite concentrations in the scanned object are estimated with a priori information regarding the chemical shifts, phase and T1 and T2 relaxation times of each metabolite. This information is obtained either from separate reference acquisitions or from simulated spectra. The metabolite spectra simulated in SPINEVOLUTION were applied as a priori information and
grouped together to form a matrix of basis functions 4) for estimation. To simulate spectroscopic
data x obtained from the scanner, individual metabolite spectra were weighted in their approximate physiological concentration ratios of the brain and added to noise to form a simulated spectroscopic data. Cr, NAA, Glu and Gin were weighted in the concentration ratio
10: 12.5: 12.5: 3 and white Gaussian noise was added to the combined spectrum such that
SNR of NAA = 20. Once this matrix of basis functions 0, and the spectroscopic data vector x were formed, the estimation problem was solved by linear least-squares method for the individual metabolite concentrations cl, a2, a3 and A4.
S= Re (4.1)
The accuracy of the estimation can be assessed by determining the bias and variance of
the estimates. It has been shown that the estimates & are unbiased and that the variances of the
estimates are of the form of Eq. 4.2 [28] where n is the noise vector added to the spectroscopic
data. The variances of the estimates A depend on the orthogonality and energy of the basis
functions from Cr, NAA, Glu and Gin in the matrix P, which we evaluate in the next section.
Numerical values of the bias and variances were obtained from 3000 monte-carlo trials with different realizations of the noise with the same standard deviation.
Figure 22. The set-up and solution of the estimation problem from simulated spectra. Simulated basis functions are weighted and added with noise to form the simulated spectroscopic data.
Orthogonality of basis functions from simulated spectra
The orthogonality between two spectra is determined by the amount of overlap between
them. It is expected that the estimates & of the individual metabolite concentrations will become
less accurate with greater overlap and reduced orthogonality. In this section, the differences in
orthogonality of all pairings of metabolites generated from the 2DJ-PRESS, CT-PRESS and 1D
spin-echo at TE=35ms sequences were analyzed. Orthogonality is defined and calculated by the inner product between the simulated spectra.
0.8000 o--ooo 0.7000 0.6000 0.5000 0.4000 0.3000 0.2000 0.1000 --0.0000 Cr & NAA Cr & Glu Cr & Gin
NAA& NAA &
Gin Glu Glu & Gin
O CTPRESS
projected
spectrum
I
CTPRESS
concatenated
I
2DJ-PRESS
concatenated
O
TE-averaged
spectrum
Figure 23. Inner product of noise-free 1D spectra obtained from 2D-JPRESS, CT-PRESS and
1D spin-echo at TE = 35ms simulations.
Figure 23 shows the values of the inner products evaluated between different
metabolites generated from different 1D spectra obtained from the 2DJ-PRESS, CT-PRESS
and 1D-spin-echo experiments, namely the TE-averaged spectrum, CT-PRESS projected spectrum and spectra of the concatenated FID's from 2D-PRESS and CT-PRESS. The orthogonality measure in Figure 23 supports known chemical shift information of the overlap between metabolite spectra. Of the 4 metabolites, Glu and Gin has the greatest spectral overlap, followed by NAA and Glu and NAA and Gin. This order of spectral overlap is reflected 38 4.4.
in the values of the inner product s of the basis functions generated from all the schemes except for that of the projected spectrum from CT-PRESS. The projected spectrum from CT-PRESS is successful at maintaining orthogonality between Glu and Gin at a tradeoff of reduced orthogonality between NAA and Gin, and NAA and Glu.
0.6000 0.5000 0.4000 --- Cr & NAA ---- Cr & Glu 0.3000 b _ ... ,Cr&Gln 0.2000 , - - -.*-NAA& Glu -*-NAA&GIn 0.1000 0 -Glu &Gln 0.0000 0 50 100 150 200 TE time Figure 24. Inner product of noise-free metabolite 2DJ-PRESS experiment.
basis functions for each TE step of a 38-step
The inner product of metabolite basis functions from each individual FID of each step of the 2DJ-PRESS and the CT-PRESS experiment was also evaluated and shown in Figure 24 and Figure 25. From Figure 24, the orthogonality of the basis functions varies as a function of TE, and this variation is especially great for the three pairings of NAA & Gin, NAA & Glu and Glu & Gin which gave the largest inner product values and least orthogonality in Figure 23. In particular, TE times between 50ms and 85ms gave the greatest orthogonality between Glu and
Gin which we aim to detect independently. This TE range between 50ms and 85ms indicates an
0.3500 0.3000 0.2500 0.2000 Ia 0.1500 0.1000 0.0500
Glu & Gin
NAA & Gin
NAA & Gin
-Cr&NAA -Cr & Glu -Cr & Gin -NAA& Glu -NAA&Gin -Glu & Gn 0 20 40 60 80 100 120 140 tl ample #
Figure 25. Inner product of noise-free metabolite basis functions for each tl step of a 128-step CT-PRESS experiment.
Variations in the inner product values for each tl step in a CT-PRESS experiment are more subtle than that for 2DJ-PRESS experiment. For increased orthogonality between Glu and Gin, the earlier tl steps perform better in terms of inner product values. It is noted that the maximum value of the inner product between Glu and Gin is 0.32 for CT-PRESS, compared to
0.58 for 2DJ-PRESS in Figure 24.
4.5. Bias and variance in estimates j of metabolite concentrations
In this section, we evaluate the accuracy of the estimates of metabolite concentrations
determined from a priori information of a matrix of basis functions and spectroscopic data built from simulated spectra appropriately weighted and combined. Plotted in Figure 26 is the
average of the metabolite concentration estimates & obtained from the estimation problem
applied to each tl step of the 2D-JPRESS and CT-PRESS simulation, averaged across 3000
trials with random realization of noise. A as calculated from Eq. (4.1) is an unbiased estimate
of the metabolite concentrations and this is supported by the results shown in Figure 26. The standard deviation associated with estimating Gin high because of the low relative metabolite concentration and spectrum overlap with Glu.
1.3 1.2 1.1 0.9 0.8 0.7 0.6 0.5
Cr NAA Glu Gin
2DJPRESS M CTPRESS
Figure 26. Average of estimates a of metabolites of interest for a 38-step 2D-JPRESS
and 128-step CT-PRESS simulation shown with corresponding standard deviation bars.
The variation in standard deviation of the metabolite concentration estimates i with each
individual tl step of the 38-step 2DJ-PRESS for the four metabolites are shown in Figure 27,
Figure 28, Figure 29 and Figure 30. The standard deviations are normalized with the signal
energy of the respective metabolite basis function for the first TE step. For Cr and NAA, the
variation in standard deviation is due mainly to the increasing T2 decay of metabolite signal as
TE increases. Glu and Gin however exhibit peaks and troughs that could be exploited in
selecting a subset of TE times for better separation of Glu and Gin. It is noted that the standard
deviations of concentration estimates for Cr and NAA are much lower than that for Glu and Gin,
with the standard deviation for the estimation of Cr concentration being approximately 15 times
lower than for Glu. The standard deviations of metabolite concentration estimates obtained from
the spectrum of concatenated FID's of the 16-step 2DJ-PRESS experiment, TE-averaged
PRESS and 1D spin-echo experiment at TE = 35ms are included for comparison purposes. The standard deviation of the concentration estimate for each metabolite for the
2DJ-PRESS-concatenated spectrum represents an average of the standard deviation obtained across the individual TE's.
std(i..Cr)
.. wu.ua#tt~UEEEEEEE*uu***u*umm*muuuu 100 150 -- individualTE concatenated TE - TE = 35ms -x- TE-average PRESS 200 TEFigure 27. Standard deviation of the estimate of concentration of Cr normalized with the signal energy in the basis function of the metabolite Cr. Standard deviation shows variation with TE of a 38-step 2DJ-PRESS sequence.
std(S_NAA)
--- individualTE A concatenated TE --- TE= 35ms --*-TE-average PRESS 100 150 200 "TEFigure 28. Standard deviation of the estimate of concentration of NAA normalized with the signal energy in the basis function of the metabolite NAA. Standard deviation shows variation
with TE of a 38-step 2DJ-PRESS sequence. 1.45 1.25 1.05 0.85 0.65 0.45 0.25 0.65 0.60 0.55 0.50 0.45 0.40 0.35 0.30
---
--
---
--
---
--
-std(
_Glu)
18.5018.50
--- --
-
-
--- ---
-
-- ----
~ 16.50 14.50 . 12.50 10.50 8.50 6.50 4.50 2.50 0.50 --W- individualTE * 0***sC-100 A concatenated TE -u- TE = 35ms --X- TE-average PRESS 150 200Figure 29. Standard deviation of the estimate of concentration of Glu normalized with the signal energy in the basis function of the metabolite Glu. Standard deviation shows variation with TE of a 38-step 2DJ-PRESS sequence.
std(._GIn)
I
----Figure 30. Standard deviation of the estimate of concentration of Gin normalized with the signal energy in the basis function of the metabolite Gin. Standard deviation shows variation with TE of a 38-step 2DJ-PRESS sequence.
18.50 16.50 14.50 12.50 10.50 8.50 6.50 4.50 2.50 0.50 M M 1-0.-50 indid--u-a-lT 2.5 -K- T-veae RS --- individualTE A concatenated TE -- TE = 3 5ms -X- TE-average PRESS 200 150 100 i ~--- --- - -- -- --- - --- ---~~--- --;--;-- --~--- ---;.. .~_;~.._~_~~.__~~...___.,. ..,..; ~.~~~~~..~1....-~.~..-....~~...~~ I~----.-~--- --- --- --- ----
-Figure 31, -Figure 32, -Figure 33, -Figure 34 and -Figure 35 illustrates the variation in
standard deviation of the metabolite concentration estimates A with each individual tl step of the
CT-PRESS simulation for the four metabolites. As with the plots for 2DJ-PRESS, the standard deviations are normalized with the signal energy of the respective metabolite basis function for the first t, step. Due to the constant time interval during which the last 1800 pulse is shifted in
CT-PRESS, variations in standard deviation with t, are more subtle that seen for the 2DJ-PRESS experiment. A zoomed-in view shows variation in standard deviation that correlates with the variation in signal energy of the basis functions of each metabolite for individual t, steps. This variation in standard deviations of the metabolite concentration estimates may also be exploited for better separation of Glu and Gin but will not have as large an improvement due to the small scale of the variations. It is noted that the standard deviations of concentration estimates for Cr and NAA are much lower than that for Glu and Gin, with the standard deviation for the estimation of Cr concentration being approximately 30 times lower than for Glu.
std(a .Cr)
2.66 2.56 2.46 2.36 2.26 A.Aih &~ /.lb ---- individual TE 2.06 1.96 a concatenated TE 1.86 M-- CTPRESS projected 1.76 1.66 0 20 40 60 80 100 120 140 TEFigure 31. Standard deviation of the estimate of concentration of Cr normalized with the signal energy in the basis function of the metabolite Cr. Standard deviation shows little variation with tl step of the CT-PRESS sequence.
std(i Cr)
2.55 !p
4
2A40 -2.35 2.30 0 20 40 60 80 100 120 140 TE -- individualTE A concatenated TEFigure 32. Zoomed view of the standard deviation of the estimate of concentration of Cr normalized with the signal energy in the basis function of the metabolite Cr. Standard deviation shows little variation with tl step of the CT-PRESS sequence.
std(S_NAA)
1.29 1.24 1.19 1.14 1.09 1.04 0.99 -- individualTE & concatenated TE -CTPRESS projected 0 20 40 60 80 100 120 140 TEFigure 33. Standard deviation of the estimate of concentration of NAA normalized with the signal energy in the basis function of the metabolite NAA. Standard deviation shows little variation with t1 step of the CT-PRESS sequence
2.50 .---2.45
std~""'
~1~~'
i.. "^'^Cr)
~"
---- - --- - --- - --- --- - - -- -- --- ---0197 T-14-N ""'std(iGlu)
70.00 69.00 68.00 67.00 66.00 65.00 64.00 63.00 62.00 61.00 60.00 -- individualTE A concatenated TE 0 20 40 60 80 100 120 140 TEFigure 34. Zoomed view of the standard deviation of the estimate of concentration of Glu normalized with the signal energy in the basis function of the metabolite Glu. Standard deviation shows little variation with t1 step of the CT-PRESS sequence.
std(
_Gin)
50.00 49.00 48.00 47.00 46.00 45.00 44.00 -- individualTE 43.00 4.... concatenated TE 42.00 41.00 40.00 0 20 40 60 80 100 120 140 TEFigure 35. Zoomed view of the standard deviation of the estimate of concentration of Gin
normalized with the signal energy in the basis function of the metabolite Gin. Standard deviation shows little variation with tl step of the CT-PRESS sequence.
I
i~_________________~__
5.
Experimental analysis of 2D-JPRESS and CT-PRESS
This chapter focuses on the analysis and processing of data acquired from 2D-JPRESS and CT-PRESS pulse sequences implemented on a 3T MRI scanner. The scans were carried out on home-made phantoms containing the same metabolites of Cr, NAA, Glu and Gin that were evaluated with simulated spectra. This work is in preparation for the estimation of metabolites concentrations in vivo or in a phantom containing a mix of metabolites, where the FID and spectra acquired for each metabolite is taken to be the basis function for that metabolite in the estimation problem.
5.1. Method
Figure 36. Concentrated solutions of Cr, NAA, Glu and Gin at 98mM, 251mM, 500mM and 180mM respectively were injected into different ping-pong balls of diameter 40mm. The opening was sealed with wax before wrapping the phantom with Parafilm
Solutions of Cr, NAA, Glu and Gin were made by dissolving the powder form of creatine monohydrate, N-Acetyl-aspartic acid, Glutamic acid (Sigma-Aldrich, Missouri, USA) and L-Glutamine (Hyclone Laboratories Inc., Utah USA) respectively in water to create concentrated


![Table 1. Chemical shifts and coupling constants of protons in Glu and GIn as reported in [9]](https://thumb-eu.123doks.com/thumbv2/123doknet/14724604.571411/21.918.98.815.106.477/table-chemical-shifts-coupling-constants-protons-glu-reported.webp)