Development of
P
honon-Polarit on
THz
Spectroscopy, and The Investigation
of
Relaxor
Ferroelectrics
Benjamin John Paxton
B.A.
Mathematics, B.A.
Chemistry, University of Oregon, 2000
Submitted to the Department of Chemistry
in partial fulfillment of the requirements for the degree of
DOCTOR OF PHILOSOPHY
at the
MASSACHUSETTS INSTITUTE OF TECHNOLOGY
June 2006
@
Massachusetts Institute of Technology, 2006. All rights reserved.
The author hereby grants to MIT permission to reproduce and
distribute publicly paper and electronic copies of this thesis d
in whole or in part.
nn .
-...
...
...
Author
.-.:I.
;Department of Chemistry
M C H ~ V ~
April 30, 2006
. .
Certified by.
%...
Keith
A. Nelson
Professor
Thesis Supervisor
1
-3
Accepted by ...
Robert
W.
Field
Chairman, Department Commit tee on Graduate Students
Development of
Phonon-polarit onTHz Spectroscopy,
and
The Investigation of Relaxor Ferroelectrics
by
Benjamin John Paxton
B. A. Mathematics, B.A. Chemistry, University of Oregon, 2000
Submitted to the Department of Chemistryon May 24, 2006, in partial fulfillment of the requirements for the degree of
DOCTOR OF PHILOSOPHY
Abstract
This thesis develops phonon-polariton based THz spectroscopy and uses this tech- nique to make the first THz frequency dielectric measurements of a relaxor ferro- electric crystal, in particular KT~.982Nb0.01803 (KTN 1.8). THz spectroscopy has emerged as an important probe for a wide variety of systems with the development of pulsed THz radiation sources and time-domain detection methods. Four factors mo- tivate the use of phonon-polaritons generated in an ionic crystal (typically LiNb03 or LiTa03) via impulsive stimulated Raman scattering as a THz source for spec- troscopy: (1) the versatility of phonon-polariton waveform shaping and detection, (2) the ability to use the ionic crystal as a compact, integrated spectroscopic platform, (3) the high THz refractive index of the host material facilitates coupling of THz ra- diation into high-dielectric samples, and (4) the potential to generate large amplitude
polariton fields for nonlinear THz spectroscopy. Here we demonstrate both reflection and transmission implementations of THz spectrometers based on grating interfer- ometric measurement of the phase and amplitude of a phonon-polariton waveform before and after interaction with a sample. A simple implementation of free space THz spectroscopy with conventional detection is also performed as a comparison to the polariton spectroscopy measurements. For the investigation of high-dielectric ma- terials, both reflection and transmission polariton spectroscopy offer clear advantages over free space methods.
Polariton spectroscopy is used to measure the refractive index of KTN 1.8 in the ~ 5 0 - 2 5 0 GHz range from 4300 K as the index varies between -10 and 35. At low temperatures, the Nb ions in our sample induce dynamically fluctuating polar nano-regions (PNRs) that dominate the dielectric response at low at low frequencies
(<
Hz). Our results differed from low frequency measurements in two ways: a significantly smaller, but still ionic, dielectric response and Curie-Weiss soft mode behavior. Together with ISRS transient grating measurements of the KTN soft mode in the low temperature disordered state, we attribute this behavior to soft modemediated fast N b intersite hopping separated from slower PNR dynamics.
Thesis Supervisor: Keith
A.
Nelson Title: ProfessorAcknowledgments
MIT has been an extraordinary experience for me, and it has been my pleasure to learn, both scientifically and personally, from some exceptional individuals. First and foremost, I would like to thank my research advisor, Keith Nelson, for his en- thusiasm and encouragement over the course of my thesis work. Several scientists contributed directly to the measurements presented in this thesis. Many of the po- lariton spectroscopy measurements presented in this thesis were performed jointly with Dr. Masashi Yamaguchi, his drive and ideas greatly advanced this project. The free space THz spectroscopy measurements were performed with Dr. Thomas Hor- nung and Ka-Lo Yeh. Finally, I would like to thank Prof. Jean Toulouse for providing the KTN sample and for taking an interest in our results, our discussions contributed greatly to my understanding of KTN.
On a personal level, I was fortunate to work and share a laser with Jaime Choi (nee Beers) and together we survived many a laser mishap, which she usually fixed with a steely optimism. Jaime also always knew exactly what to say to make me feel better when I was feeling down. Thomas Feurer was a friend and an exceptional scientist, it was great to have him guide me though my first few femtosecond laser experiments. I greatly enjoyed our Friday happy hours. Peter Poulin was the sage of the Nelson lab, both a fine experimentalist and softball player. His cleanliness shames us all. Some of my of my favorite memories are defending the chemistry department's honor with him in the annual
NERC
Softball tournament. I always enjoyed a discussion of how the world works with Nikolay Stoyanov, andI
will never forget that "there is a limit". Josh Vaughan was my academic year. His curiosity always kept me on my toes, and I value his perspective on things. Thomas Hornung may seem quiet but he plays a mean game of tennis. Eric Statz was a bulwark of the group, exuding superhuman patience and avoiding email. I will remember Kenji Katayama for his style, and I am grateful for the hospitality he and his wife showed us when we visited Japan for an Ultrafast conference. Darius Torchinsky has the unique ability to combine pessimism with a positive spirit, and always make me smile. Christoph Klieber brought renewedspirit and organizational motivation into the lab, I bequeath to him the RegA laser. May they treat each other well.
I overlapped with many other group members, and I am grateful to all of them for their help and support; Gloria Pless, Rebecca Slayton, Osamu Kamishima, Efren Gutierrez, Cindy Bolme, Kevin Webb, Kathy Stone, Ka-Lo Yeh, Tina Hecksher, Taeho Shin, Gagan Saini, Duffy Turner, Emmanuel Peronne, and Thomas Pezeril.
Boston also afforded many a great experience outside of MIT. Many of these were with my friends and longtime roommates Bryan and Matt. With the always punctual and motivated Verdi (no not the laser), I spent many mornings in the gym and many night on the town. Ashley was another great roommate and friend, her calming presence and thesis advice always proved invaluable. I was also fortunate to know Shelly and Cathy.
I would like also like to thank my undergraduate advisors, Professors Cathy Page and Geri Richmond, at the University of Oregon for the providing me some great educational opportunities in their labs and some general guidance. I felt well prepared coming to MIT.
Finally, I would like to thank my family for their love and support. Some of my earliest memories are my mother giving me vinegar and baking soda to make "volcanos" in my sand box. I also remember the chemistry set that my grandparents gave me as young teenager. I take it as an omen of my future as a physical chemist that I could not figure out how to open the chemicals until I was in college.
Contents
1 Introduction 23
2 Experimental 27
. . .
2.1 RegA Laser System 27
. . .
2.2 Janis STVP-100 Cryostat 28
. . .
2.3 Aerotech Air Bearing Stage 29
. . .
2.4 ISRS Transient Grating Experiment 31
. . .
2.5 Free Space THz Spectroscopy 38
. . .
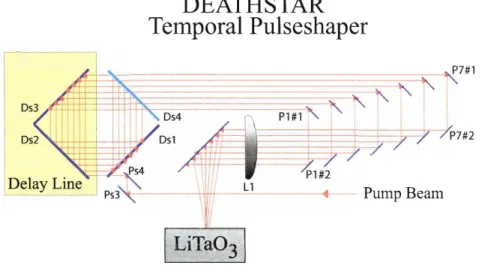
2.6 "Deathstar" Optical Pulse Shaper 40
3 Phonon-polaritons as a THz Source 43
. . .
3.1 Introduction to Phonon-Polaritons 45
. . .
3.2 Impulsive Stimulated Raman Scattering 49
. . . 3.3 Generation and Detection of Phonon-Polaritons 51
. . . 3.3.1 Phonon-Polariton Generation 51 . . . 3.3.2 Phonon-Polariton Waveforms 53
. . .
3.3.3 Phonon-Polariton Detection 554 Development of Phonon-Polariton Based THz Spectroscopy 57 . . . 4.1 Motivation of Phonon-Polaritons as a THz Source 57
. . .
4.2 Phonon-Polariton Based THz Spectroscopy 60
. . .
4.2.1 Principles 60
. . .
. . .
4.2.3 Phonon-Polariton Detection 66
. . .
4.3 Dielectric Function from THz Spectroscopy 70
. . .
4.3.1 Method of Data Extraction 71
. . .
4.3.2 Single Crystal Spectrometer 75
. . .
4.3.3 Reflection Spectrometer 76
. . . 4.3.4 Transmission Spectrometer with Cut Crystals 78
. . . 4.3.5 Spectroscopy with Free Space THz Radiation 80
. . .
4.4 Demonstration on LiTa03 and LiNb03 80
. . .
4.4.1 TemperatureDependence 81
4.4.2 Anisotropy . . . 83 . . . 4.4.3 Horizontal Polarization of the Excitation and Probe 85
. . .
4.4.4 Polariton Coupling to Free Space 86
. . .
4.5 Free Space THz Spectroscopy 87
4.6 Comparison of Polariton based THz Spectroscopy to Free Space THz . . .
Spectroscopy 91
. . . 4.7 Multicycle Phonon-Polariton Waveform Generation 95
. . .
4.7.1 Deathstar Temporal Pulse Shaping 95
. . . 4.7.2 Transient Grating Phonon-Polariton Excitation 96
. . .
4.8 Conclusions and Future Directions 98
5 Introduction to Ferroelectrics 101
. . .
5.1 Ferroelectrics: Background and Terminology 101
. . .
5.2 Applications of Ferroelectrics 106
. . .
5.3 Basic Concepts 108
. . .
5.3.1 Classification of Ferroelectric Crystals 108. . .
5.3.2 Curie-Weiss Law 109
. . .
5.4 Relaxor Ferroelectrics 110
6 Spectroscopic Studies of Nb Dynamics in KTN 115
. . .
6.1 Introduction to
KTN
116. . .
6.3 Discussion of KTN Polariton Spectroscopy
. . .
1256.4 ISRS Measurement of the KTN Soft Mode
. . .
1286.5 Free Space THz Spectroscopy of KTN
. . .
1316.6 Conclusions and Future Directions
. . .
1347
Summary and Future Directions
137A Extraction Programs
141 A.
1 Transmission Single Crystal. . .
141A.2
Reflection Spectroscopy . . . 145List of
Figures
2-1 Dimensions of the STVP-100 cryostat sample chamber.
. . .
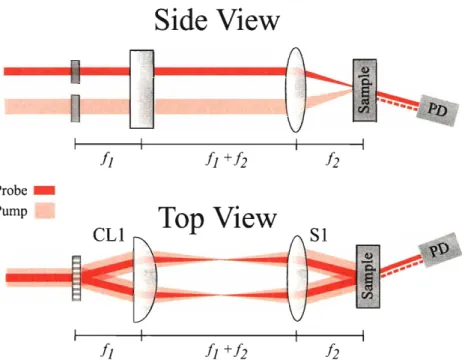
29 2-2 Transient grating experimental apparatus. f l and f2 are typically 15cm. The spatial filtering of the higher diffraction orders and the atten- uation of the reference field is not shown.
. . .
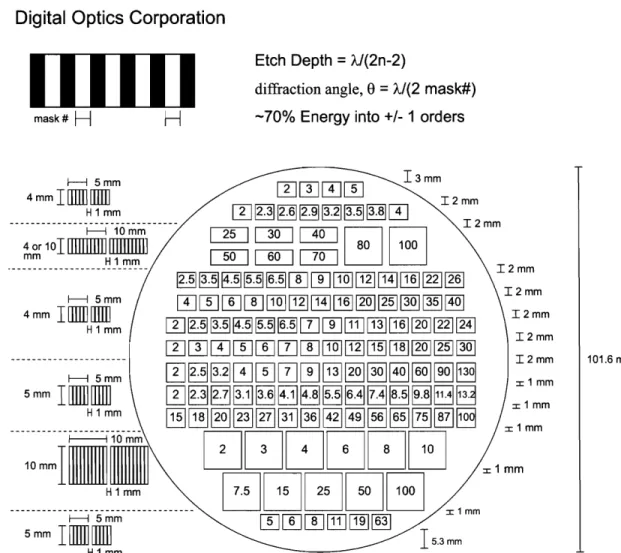
33 2-3 Phase mask patterns used in the transient grating and polariton spec-t roscopy measurement s. Adapted from Crimmins [3].
. . .
36 2-4 Transient grating ISRS experiment in 5%MgO:LiNb03 at 295 K ex-cites a phonon-polariton response with a wavevector magnitude of 1090 cm-I and a frequency of 2.1 1 THz. This is typical data for high temperature (>70K) in 5%MgO:LiNbOs.
. . .
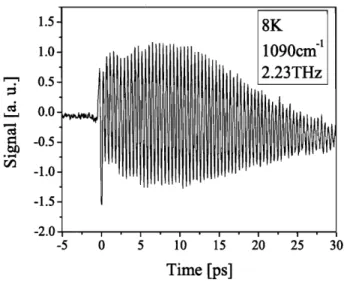
372-5 Transient grating ISRS experiment in 5%Mg0:LiNb03 at 8 K excites a phonon-polarit on response with a wavevector magnitude of 1090 cm-l and a frequency of 2.23 THz. Reversible photorefractive damage de- grades the signal quality relative to figure 2-4 by scattering the optical pump light, but less damping in the LiNb03 at low temperature gen-
. . .
erates a longer polariton pulse train. 38
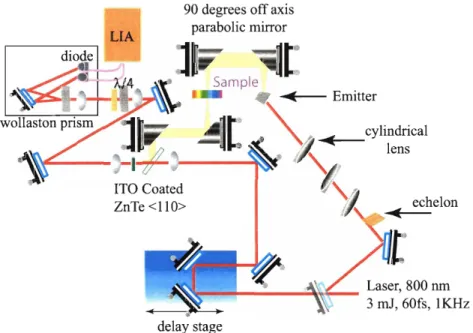
2-6 Free space THz spectrometer experimental apparatus. Phonon-polaritons are generated in LiNb03 and coupled to free space. The THz radiation induces birefringence in an optical probe in the ZnTe crystal. Figure prepared by Ka-Lo Yeh.
. . .
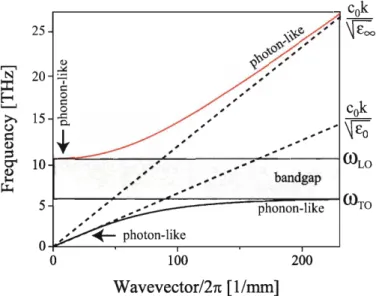
39 2-7 The Deathstar optical pulse shaper. Figure prepared by Jaime Choi. . 403-1 Simulated phonon-polariton dispersion curve for LiTa03. The solid lines indicate the upper and lower polariton branches. The dashed lines describe the dispersion of uncoupled optical radiation. The band gap describes the region where phonon-polariton propagation is forbidden. The lower branch at low wavevector is the region of interest for our experiments.. . . 49
3-2 Phonon-polariton generation and detection with a short femtosecond excitation pulse. . . 53
3-3 Schematic illustration of a propagating polariton waveform generated with a femtosecond excitation pulse. The right propagating polariton waveform is emphasized to show that although the primary direction of propagation is lateral, the polariton waveform undergo total internal . . . . reflection as it propagates between the front and back surfaces. 53
3-4 The excitation pulse is focused to a line. This launches a phonon- polariton plane wave generated throughout the volume of the crystal. The right propagating polariton waveform is not shown. . . 54
4-1 Top view - Schematic illustration of polariton-based transmission THz spectroscopy cell. The pump beam is focused to a line, and the po- laritons are generated throughout the depth of the cell. The LiTa03 crystals are cut to compensate for the forward polariton wavevector component. The pump excitation also generates a right propagating polariton waveform that is not involved in the experiment and is not shown. . . 61
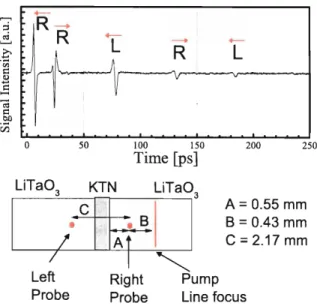
Side view THz transmission cell. The LiTa03 crystals are not cut to compensate for the forward propagation angle of the polariton wave- form, and as such, polariton reflections are observed. The raw data shows the propagation of the left propagating polariton waveform. The labels R and L on the peaks in the raw data refer to interferometric measurements at the right and left probe arms and the arrows show the direct ion of polarit on propagation. In chronological order, the first peak is the polariton waveform arriving at the right probe arm, the second peak is the refection from the pump side of the sample mea- sured at the right probe arm, the third peak is propagation through the sample arriving at the left probe arm, the forth peak is reflection from the far side of the sample at the right probe arm, and the fifth peak is the polariton after two reflections arriving at the probe arm. Peak identification can be aided by translating the cell with respect pump and probe beams to see how the peak positions change. . . . . 62
4-3 In LiTa03, a line excitation is focused along the horizontal dimension with a cylindrical lens with a focal length of 30cm (red) and 20cm (blue). The polariton pulse shape is related to the spatial derivative of excitation profile.
A
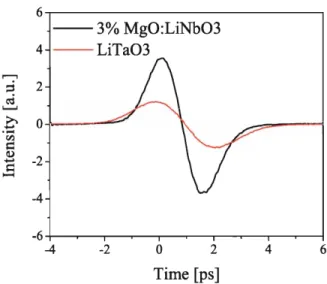
tighter focus results in a shorter pulse in the time domain and a correspondingly larger bandwidth. . . 644-4 Comparison of detected polariton intensity in LiTa03 and 3% MgO:LiNb03. Both the generation and detection efficiencies are stronger in LiNb03. 65
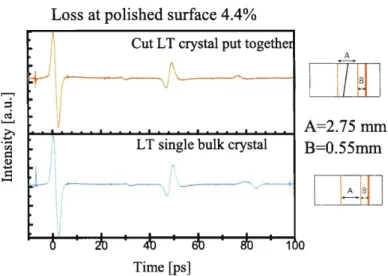
4-5 Comparison of uncut LiTa03 was to a cut LiTa03 crystal that has been physically pressed together.
A
5% transmission loss was calculated from comparing the excitation peak to the transmitted peak. . . 664-6 The dual arm interferometer measures the THz pulse before and after . . .
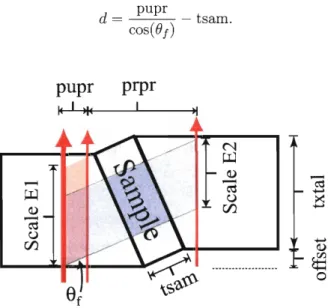
4-7 Top view of single crystal spectroscopy cell illustrating the portions of the generated polariton wavefront that probe 1 and probe 2 coherently integrate. Scale E l and Scale E2 are used to normalize the measured polariton pulses. "pupr" is the distance between the pump and probe beams. "prpr" is the distance between the probe beams. "txtal" is the thickness of the crystal. . . 76 4-8 Top view of reflection spectroscopy cell illustrating the portions of the
right and left generated polariton wavefronts that probe 1 coherently integrates. Scale E l and Scale E2 are used to normalize measured polariton wavepackets. . . . 77 4-9 LiTa03 is cut at and angle of 20" and a clamp is used to hold the
crystals together. Scale E l and Scale E2 are used to normalize the . . .
measured polariton wavepacket signals. 79
4-10 Polariton spectroscopy of LiTa03 as a function of temperature. See figure 4-2 for spectrometer geometry. The transmitted peaks (right) show a strong temperature dependent absorption. And while not as apparent in the raw data, the variation in time delay of the transmitted peak is also significant. . . 82 4- 11 Temperature dependent refractive index for LiTaOs performed in two
separate experimental trials. The value of the refractive index is inde- pendent of frequency in the measured range of 50-250 GHz.
. . .
834-12 THz spectroscopy of different orientations of the optic axis of LiTa03. Plot (a) shows the polariton polarization parallel to the optic axis of the LiTa03 sample. Plot (b) shows the polariton polarization perpen- dicular to the optic axis of the LiTa03 sample.
A
slight increase in the time of flight is observed. . . 84 4-13 Measurement of a polariton pulse in LiTa03 with excitation and probepolarized parallel to the optic axis, (HH) in the lab frame. This gen- eration and detection is much weaker than our normal (VV) excitation. 85
4-14 Demonstration of polariton coupling to free space. The cut crystal couples -53% of its energy to free space THz radiation. The polariton waveform in the uncut cryst a1 undergoes total internal reflection. The reflection is not seen in the cut crystal because the probe does not intersect the polariton waveform at the proper angle to see a constant phase slice. . . . 86
4-15 Top view: A polariton waveform generated in LiTa03 is used as a THz radiation emitter and recoupled into a second LiTa03 crystal where it is measured. The spacing, A, is 1 mm in the lower scan and 2 mm in the upper scan. . . . 87
4-16 The refractive index of 5%MgO:LiNb03 measured with free space THz spectroscopy. . . . 88
4-17 The extinction coefficient, K , of 5%MgO:LiNb03 measured with free space THz spectroscopy. . . . 89
4-18 THz water resonances in measured with free space THz spectroscopy. The reference was taken in the cryostat with atmospheric water vapor present, while the low temperature measurement on 5%MgO:LiNb03 was dry. Assignments from Grischkowsky [83]. . . 90
4-19 Comparison of P P polariton spectroscopy with free space methods in KTN. Polariton transmission spectroscopy is able to transmit more THz radiation through the KTN sample at lower temperatures where the dielectric constant begins to diverge. Free space measurement could not be continued below 150 K while polariton transmission measure- ments were performed at all temperatures down to 80 K. Polariton reflection measurements were performed down to 4 K. The results of
. . . measurements at lower temperatures are reported subsequently. 92
4-20 The reflection amplitude coefficients determined from our experimen- tally measured values of the refractive index for KTN utilizing polari- ton spectroscopy. The values were converted to equivalent values of what a free space reflection THz spectroscopy method would yield for air KTN interface at 45" and normal incidence.
. . .
93 4-21 An optical temporal only pulse shaper was used to generate a 7 cyclepulse train to excite a 400 GHz polariton excitation that was detected with the standard dual arm interferometer. The rapid decay of the waveform from one probe arm to the second is an artifact of the exci- . . .
tation and detection used. 95
4-22 A grating is imaged into a LiNb03 crystal exciting a narrow band po- lariton waveform with a 1 THz frequency. The black plot shows the probe overlapped with the excitation pulse and the polariton propa- gating away from the probing region. The red plot shows polariton propagating into and out of the second probe region. The modula- tion amplitude of the black plot is much larger because it is measuring both the right and left propagating polariton field and measuring the polariton throughout the entire depth of the crystal. . . 97
5-1 Structure of an AB03 perovskite in the cubic paralectric phase. The A cations site is on the corners of the cube, the B cation is situated at the center, and Oxygen on the face centers. . . 103 5-2 Schematic representation of a pair of unit cells undergoing several fun-
damental types of structural phase transitions from a centrosymmetric prototype. Adapted from Lines and Glass [88]. . . 106 5-3 Schematic illustration of B cation occupation sites within the frame-
work of the eight site model for an AB03 perovskite. Adapted from Dougherty [17]. . . 109 5-4 Overview of differences between normal ferroelectrics and relaxers.
Schematic drawing of PNR formation. At high temperature the corre- lation length r, is on the order of one lattice constant. At lower tem- peratures the dipole induces a polarization in several unit cells around it forming a PNR. Adapted from Samara [7]. . .
The temperature dependence of KTN's index of refraction at -50 to 250 GHz measured with free space THz spectroscopy7 two trials of phonon-polarit on reflection spectroscopy, and phonon-polarit on trans- mission spectroscopy with cut crystals. . . .
Unprocessed data from polariton transmission measurements of KTN 1.8. At 150 K the time of flight of the transmitted peak E2 significantly increased due to the refractive index change of KTN. . . .
Power spectra of a polariton waveform generated with cylindrical lens (f = 20 cm) before and after reflection from KTN 1.8 at 300 K. . . .
Unprocessed data from polariton reflection spectroscopy measurements of KTN 1.8. A schematic of the relative positions of the pump and probe beams is shown at the bottom of the figure. The blue region designates the the reflected polariton signal. The pink region desig- nates the left propagating polariton passing through the left probe arm and can be used to determine the temperature dependent dielec- tric properties of the LiTa03 crystal. . . .
Refractive index measured with polariton transmission and reflection spectroscopies (-50-250 GHz) on KTN 1.8, presented alongside dielec- tric spectroscopy at lower frequencies by Samara on KTN 2.0 [110]. .
Curie-Weiss plot of I/&' for all polariton spectroscopy data. A lin- ear regression was fit to the high temperature data (150-300 K) and appears to describe all of the dielectric data above Tf at -30 K. . . .
Wavevector dependence of the KTN 1.8 soft mode at 10 K7 where the magnitude of the wavevector ranged from 840 to 3500 cm-'. . . .
6-9 Transient grating ISRS measurement of the KTN 1.8 soft mode as a function temperature. The magnitude of the excitation wavevector is 3500 cm-l.. . . . 129 6-10 Temperature dependence of soft mode in KTN 1.8 measured interfer-
ometrically. As the temperature goes from 10 to 40
K
the soft mode oscillation (blue arrows) change from underdamped to overdamped, . . .until it disappears completely by 40 K. 131
6-11 Unprocessed times series of THz transmission spectroscopy of KTN 1.8 at 300 K and a reference. The blue boxes represent the windowed portion of the time series used for data extraction. The y-axes are to the same scale. . . . 132 6-12 Bandwidth of the reference THz field and a THz field transmitted
through KTN 1.8 at 300 K.
. . .
132 6-13 THz free space measurement of the index of refraction of KTN 1.8.Below 150 K no transmitted signal could be detected. . . 133 6-14 THz free space measurement of the extinction coefficient L; of KTN 1.8.
List
of
Tables
2.1 Typical Parameters of the Coherent RegA laser system
. . .
27 3.1 Al symmetry transverse optical phonon modes in LiNb03 and LiTa03obtained from ref. [44,45]. S is the coupling strength between the
lattice vibration and the electromagnetic radiation.
.
. . .
48 3.2 Constants for modulation of the index of refraction due to phonon-polaritons from reference [22]. Units for rl3 and r33 are pm/V.
. . . .
555.1 Values of the ferroelectric transition temperature Tc [88] for four chem-
ical analog AB03 ferroelectrics that are of particular interest in this thesis. KTa03 and KNb03 are simple cubic perovskites in the para- electric state while LiTa03 and LiNb03 have a more complicated struc- tures. Note that changes in chemical compositions can cause substan- tial changes in ferroelectric behavior. KTa03 is an incipient ferro- electric which low temperature ferroelectric transition is frustrated by quantum fluctuations.
. . . .
.
.. . .
104Chapter
1
Introduction
The development of pulsed free space THz radiation sources and time-domain detec- tion methods have driven an active and growing interest in THz spectroscopy and imaging [I]. These techniques use THz fields that go through free space before and after interaction with a sample and cover the
-
0.1 - 10 THz frequency range. THz spectroscopy has been applied to a wide array of systems as a probe of intramolecular modes of vibration, torsions and rotations in molecules, and phonons is solids. This thesis demonstrates an alternate approach to that of conventional free space THz methods, enabling compact spectrometer systems and the study of high-dielectric materials. Our approach uses phonon-polaritons waveforms in ionic crystals as a source of THz frequency electric fields.Phonon-polaritons are lattice vibrational waves that couple to electromagnetic radiation. Through this coupling, coherent collections of polaritons form propagating waveforms that travel at light like speeds. In LiTaOs and LiNb03 crystals, these polaritons have THz frequencies and we use them as a source of THz radiation for dielectric spectroscopy. Because the polariton waveforms are coupled to a crystal, we can observe their propagation in ways not possible with free space radiation. Much effort in the Nelson Lab [2-61 has been directed towards generating, manipulating, controlling and detecting these lattice vibrational waves. This thesis extends this work by performing the first quantitative spectroscopic measurements with phonon- polariton waves and developing phonon-polarit on spectroscopy into practical tool
for performing dielectric spectroscopy at THz frequencies. Several implementations of compact polariton spectrometers are presented and spectroscopic measurements are made from both reflected and transmitted polariton waveforms. This thesis also connects to free space THz spectroscopy methods by including some simple free space THz measurements for comparison to the polariton spectroscopy results.
The unique advantages of polarit on spectroscopy are leveraged to investigate the relaxor ferroelectric KT~.ssaNbo.ouOa (KTN 1.8) which, unlike normal ferroelectric crystals does not form a true ferroelectric phase with long-range ordering of dipole moments in each unit cell. At low temperature, it is well known [7] that KTN forms polar nanoregions (PNRs) around the Nb ion impurities. These fluctuating dipoles provide an enormous dipole response to low frequency
(<
lo-' Hz) electric fields, resulting in a huge dielectric constant (E'> 100,000). The experiments presented
here constitute the first "THz" frequency (50-250 GHz) dielectric measurements on a relaxor ferroelectric. The measurements preform a direct test of the suggestion by Toulouse [8] that the complex dynamics of some relaxor ferroelectrics could beseparable into fast, phonon assisted hopping of central ions (Nb in this case) and slower PNR relaxation. Impulsive stimulated Raman scattering measurements of the KTN soft optic phonon mode were also conducted to examine the coupling of this mode to the fast central ion hopping dynamics.
Chapter 2 introduces several topics: the femtosecond laser system used for the
majority of experiments presented in this thesis, the sample-in-vapor cyrostat used for the low temperature spectroscopic studies on the relaxor ferroelectric KTN, a description of the free space THz spectroscopy experiment that is used for comparison to the polariton spectroscopy data, the transient grating measurements that are used to investigate the soft mode of KTN, and the "Deathstar" optical pulse shaper that used to excite multicycle THz waveforms.
Next, chapter 3 provides a brief overview of THz spectroscopy and an introduction
to phonon-polaritons. It discusses the generat ion of phonon-polaritons through impul- sive stimulated Raman scattering and phonon-polariton propagation and detection. This introduction provides the necessary background to understand phonon-polar iton
based THz spectroscopy. Chapter 4 explains the basic principles of polariton spec- troscopy, introduces three configurations of compact THz spectrometers, and explains the methods necessary to extract spectroscopic data from polariton waveform mea- surement s
.
The other main topic of this thesis is the investigation of the model relaxor fer- roelectric, dilute KTal-,Nb,Oa (KTN) . Chapter 5 provides a general introduction to ferroelectrics and highlights the features most relevant to relaxor ferroelectrics. Finally, chapter 6 presents the first quantitative measurements made using the po- lariton spectroscopy developed in this thesis and the first THz measurement of a high-dielectric material, KTN. The KTN refractive index is determined in the -50- 250 GHz range from 4-300 K are made. These results are supplemented with ISRS transient grating measurements of the KTN soft mode to provide new insights into the dynamics of Nb ion impurities and relaxor ferroelectrics generally. Chapter 7 pro- vides a summary of the work presented in this thesis and discusses future directions of research.
Chapter
2
Experimental
2.1
RegA Laser System
The experiments performed in this thesis, with the exception of the free space THz measurements discussed in section 2.5, were performed with a Coherent RegA laser system. The system consists of an 18W Coherent Verdi diode laser that pumps both a Coherent Mira-900 femtosecond oscillator and Coherent RegA-9000 amplifier. Typical parameters for the laser system are given in table 2.1.
Table 2.1: Typical Parameters of the Coherent RegA laser system
The Verdi pump laser replaced an unstable and unreliable Coherent Innova 400 20W Argon ion pump laser that had power and pointing stability problems. Most of the polariton spectroscopy measurements presented in this thesis were made when the system was pumped with the argon ion pump laser, and the total power of the amplified system was typically only 700-800mW and noticeably less stable than with the solid state pump. All of the transient grating measurements were performed with the Verdi pumped system. There has been one other significant alteration to the laser
Verdi Mira RegA Bandwidth - 12 nm 9 nm Duration - 140 fs 250 fs ML Power - 500 mW 1W CW Power 16.5 W 900 mW 1.8W Rep Rate - 76MHz 250KHz
system. The grating in the RegA pulse compressor was damaged and was replaced with a Spectrogon US Inc. blazed diffraction grating, part PC 2200 30 x 30 x 10 mm, optimized for 800 nm with >90% efficiency.
2.2
Janis
STVP-100
Cryostat
The Janis cryostat STVP-100 (Serial No. 8570) was critical to the temperature dependent experiments in this thesis. The cryostat works equally well with either liquid nitrogen or liquid helium cryogens, although most of the experiments presented here used liquid helium. The cryostat is a "sample in vapor" model, which was useful in guaranteeing that all of the crystals in the polariton spectroscopy measurements were at the desired temperature. Because the sample is not in vacuum, as it would be in a cold finger cryostat, there is an additional convenience in that the sample can be easily manipulated at all times, i.e. replaced while the cryostat is chilled, due to the positive pressure in the sample chamber. In this cryostat the sample has a vertical translation range of 2 inches and can be rotated a full 360". This type of cryostat has a vacuum jacket to insulate the cryogenic chamber. Our cryostat was custom- designed to enlarge the cryogenic chamber, depicted in figure 2-1, beyond that of the standard STVP-100 models. This was done to allow a greater angle (23") for crossed laser pulses as well as to accommodate larger samples. The distances between the windows, and the window thicknesses, are shown in figure 2-1. These distances are useful for estimating the time delay between THz echo pulses that sometimes arrive after reflect ion at the cryostat windows.
The inner windows, between the vacuum jacket and the cryogenic material, have special indium seals so that stress induced by the temperature change is minimized. This is important for depolarization experiments where strain in the quartz windows can induce birefringence. Consequently, however, these windows do not seal well and can leak slightly upon going from low to high temperature so that the vacuum jacket must be reevacuated. Although it is not necessary, in practice it is often convenient to evacuate continuously the vacuum jacket with a diffusion pump. Never do this
\----
0.88in - -.-".M
strain relief indium1.63in sealed quartz window quartz window thickeness = 0.125in thickness = 0.17in
Figure 2-1 : Dimensions of the STVP-100 cryostat sample chamber.
perature controller which controls a 50 Ohm vaporizing heater at the bottom of the with mechanical rotatory pump however, cryo-pumping in the sample chamber pull oil of the rotatory pump and into the vacuum system.
!
The temperature of the cryostat is controlled though a Lakeshore model 332cryostat where the cryogen enters the chamber. There are two diodes, one by the
will
I .;em-
heater and one at the end of the rod that mounts the sample. It is important to use the diode by the vaporizer for temperature control and the diode by the sample as the estimation of the sample temperature. The electronic temperature control is only a fine adjustment; the most important control of the temperature occurs on the man- ual flow control valve of the cryogen transfer line. This valve ranges from completely open to completely closed in about 5 full turns. The cryostat operates optimally with this valve less than half a turn away from fully closed.
2.3
Aerotech Air Bearing Stage
As part of my thesis work,
I interfaced the Aerotech air-bearing stage, model ABL
2000, used as delay line in the Deathstar acoustic measurements [9,10] to a computer. The Aerotech stage is controlled by an Aerotech Soloist controller, and power is sup- plied through a Aerotech stepdown transformer module. The stage offers 1.2 m of travel, 1 pm resolution, and velocities of 400 mm/s. The stage is a continuous ve-locity type, which means that it moves from one position to another with continuous velocity motion (or a trapezoidal velocity profile). The acceleration to and from this velocity is quick and can be ignored for data collection purposes. This type of motion is unusual for femtosecond time domain spectroscopy, where the position of the stage must be synchronized with the data collection, and stepper motor translation stages are more often used. However the air-bearing stage is well suited for motion over relatively large distances. The Aerotech stage is used with a Stanford Research Sys- tems lockin amplifier (LIA), model SRS810, for data acquisition. A LIA necessarily averages a signal over a time interval, and as such the signal the LIA measures is an average over the delay position of the continuous velocity Aerotech stage. The labview software that controls the stage allows the user to set the time constant of the LIA and resolution of the stage. Then the velocity of the stage is determined such that the stage moves the distance of one resolution increment in
"i7'
time constants, wherei
= 1 was found to be the best tradeoff between resolution and data collection rate. A minimum velocity of 100 pm/s and minimum travel distance of 100 pm are enforced as the stage does not perform consistently below these values.Our Soloist controller was purchased with the "plus" option package that included the PSO (position synchronized output) feature. This feature is linked to the stage position encoder and sends a programmable TTL signal when the encoder travels a programmable number of 1 pm steps. The TTL signal is sent to a National Instru- ments data acquisition (DAQ) card. This card synchronizes the acquisition of the analogue output signal of the digital LIA and stage position. Although the LIA can be triggered directly and has an internal buffer to store triggered data, it can only store triggered data at an acquisition rate of less than 1024 Hz. This is to slow too store the digital LIA data directly, and for this reason the analog output of the LIA, which provides the LIA signal at rate of 102 KHz, is used.
2.4
ISRS Transient Grating Experiment
Laser induced dynamic grating or four-wave mixing spectroscopy is a powerful time- resolved optical technique that is widely used to study a broad range of phenomena, including molecular and lattice vibration, bulk and surface acoustic waves, and relax- ation and transport processes [ l l , 121. In this technique, two interfering laser beams are crossed in a sample to produce a spatially periodic material excitation that is monitored through the diffraction of a third (probe) beam. All transient grating measurements were conducted using diffractive optics [4,13,14] as described below.
The use of diffractive optics simplifies the use of a fourth beam as a local oscillator (or reference beam) to optical heterodyne the probe beam for improved detection, yielding a signal intensity Is on the diode of:
where
IR
and ID are the reference and diffracted signal intensities, respectively, and 6 is the phase difference between these optical fields. If the excitation field is modulated with a chopping wheel, then the first two terms in equation 2.1 are constant, and their contribution to the signal can be filtered with lockin amplifier detection. By its nature the diffracted signal is weak, so it is easy to experimentally set conditions such thatIR
>>
ID, SO thatIs
oc6.
Crossed femtosecond pulses were used to excite Raman active modes in LiTa03, LiNb03 and the relaxor ferroelectric KTal-,NbXO3 (KTN) via impulsive stimulated Raman scattering (ISRS). The theory of ISRS will be introduced in section 3.2. This section introduces the experimental apparatus for the generation and detection of laser induced transient gratings. The experiments presented here follow a major advance in this technique by Rogers et. al. [13], in which the A1 diffraction orders from transmissive diffraction gratings were used as the two beams for crossed excitation pulses and &1 diffraction orders of second laser beam were used for the probe and local oscillator beams. This approach has three significant advantages. First, the two pairs of crossing beams traverse common path optics, and are interferometrically
stable. Secondly, when a beamsplitter is used to make two fs pulses for crossed excitation the area of overlap is smaller than the spatial size of pulse due to the short pulse duration, in what is known as the "pancake effect". This limits the number of interference fringes, N , to roughly, N N 2rc/X, where r is the pulse duration,
X
is the central wavelength. In contrast, the diffraction gratings tilt the wavefront of the interfering pulses such that they interfere over roughly their entire spatial region [15]. The third benefit, for the case where the pump and probe interact with gratings of the same period, the condition for Bragg reflection is automatically satisfied, and the diffracted beam is automatically collinear with the reference beam.The transient grating experimental methods used in this thesis are outlined be- low. For a more comprehensive discussion of the experimental details and theory of transient grating ISRS measurements consult [4,14,16-181. The basic transient grat- ing experiment apparatus is presented in figure 2-2. The pump and probe beams are diffracted off of separate gratings (of the same grating period) and a cylindrical (typi- cally 15 cm) lens (CL1) collimates the diffracted orders. The distance f i between CL1 and the phase mask is the most critical parameter of the alignment. This distance is optimized by placing a retroreflector at the focal plane of CL1, and the distance between the phase mask and CL1 is adjusted by translating the phase mask until the light reflected from the retroreflector is recombined by the phase mask. In the tran- sient grating experiment all diffraction orders (including the zeroth) except for the
f
1 orders are spatially blocked near the Fourier plane of CLl between fi and f2. Thef
1 diffraction orders (four beams) for both the pump and probe beam are crossed in the sample by a spherical lens of focal length f 2 , typically 15cm. The relative sizes of the excitation and probe (and local oscillator) regions are set by controlling the spatial sizes of the pump and probe beams on the corresponding diffraction gratings. The heterodyne configuration is illustrated, but the homodyne signal can be easily obtained by blocking the local oscillator field, and this is often done during alignment. The relative phase of the laser induced grating signal and the reference field can be set by relative translation of the pump and probe diffraction gratings. The local oscillator can be attenuated by a special ND filter that has some exposed substrateSide
View
Probe
-
PUP
a
Figure 2-2: Transient grating experimental apparatus. fi and fi are typically 15
cm. The spatial filtering of the higher diffraction orders and the attenuation of the
glass. The local oscillator passes through ND filter and the probe beam passes through the glass substrate. This is necessary to keep the probe and local oscillator temporally overlapped. In general, the strongest local oscillator that does not induce a non-linear interaction in the sample or saturation of the detector should be used. The power of the probe beam is set before the phase mask splits it into a probe and local oscillator through diffraction. For probe beam and local oscillator power level of ~ 3 5 mW or less, attenuation of the local oscillator was not needed.
The size of the pump and probe beams before the phase masks are set to ensure that the pump grating is larger in height than the probe. This ensures that the transient grating has a defined wavevector given by:
where q is the wavevector of the material response and kl and k2 are the wavevector of the two excitation pulses. For dispersive vibrational excitations, such as phonon- polariton modes, the vibrational wavevector depends on orientation of the sample [12], and q is only approximately given by
f
(kl - kz). The wavevector q can be calculated from the optical parameters of the experiment. The wavelength of the grating formed by imaging the binary phase mask into the transparent sample is given by,where f l is the focal length of the the collimating CLl lens and f 2 is the focal length of S l which focuses the beams into the sample, X is the center wavelength of the pump light, and
A.
is the phase mask period (twice the phase mask number), and the wavevector q = 2x/A. As will be elaborated further in chapter 3, phonon-polaritons that are excited with a grating patter of wavevector q have a small forward wavevector component, so q defines the lateral component q, of the phonon polariton wavevector, separate from the small forward component. The phonon polariton wavelength is given by,Where Bt is the angle of forward propagation of the polariton.
The binary phase masks used in these experiments are custom made by Digital Optics Corporation, Charlotte NC. The diffraction efficiency is optimized for a par- ticular wavelength by controlling the etch depth of the phase mask pattern. These experiments use gratings optimized for 800 nm light. The masks are also numbered such that the mask number equals half of the grating period. Figure 2-3 shows the available mask patterns.
Digital Optics Corporation
mask #
H
H
Etch Depth
=
hl(2n-2)diffraction angle, 8
=
hl(2 mask#) -70% Energy into +I- 1 ordersFigure 2-3: Phase mask patterns used in the transient grating and polariton spec- troscopy measurements. Adapted from Crimmins [3].
~ ~ ~ ~ p q p g q ~ ~ p l ~ p q p q
~ ~ ~ ~ ~ ~ p ~ p l p q p q p q p q p q p t q
~
p
~
~
p
~
~
p
q
p
-
l
~
~
~
~
~
~
~
p
q
~
I 2 m m . . . H 5mm~
~
~
~
~
~
~
~
~
~
~
~
~
p
~
~
p
~
p-l~plpq~ppqpl~~plpqpqiq
H l m m~ p - p - l p - p - l p - l ~ ~ ~ p l p q p q p l p q
I 2 m mTypical data for the transient grating ISRS experiments are presented in figure 2-4. The experiment shown is for 5%MgO:LiNb03 at room temperature (295 K), but in a cryostat. The grating excites a phonon-polariton response that has a a well defined wavevector magnitude of 1090 em-'. The data were collected using a lockin amplifier with a time constant of 30 ms, and the total data acquisition time was ~3 minutes.
- l O ! . , . , . , . , . , . I
-5 0 5 10 15 20 25
Time
[ps]
Figure 2-4: Transient grating ISRS experiment in 5%MgO:LiNb03 a t 295 K excites a phonon-polariton response with a wavevector magnitude of 1090 cm-' and a frequency of 2.1 1 THz. This is typical data for high temperature (>70K) in 5%MgO:LiNb03.
At low temperatures, optical experiments on LiNb03 and LiTa03 are more difficult because reversible photorefractive damage occurs, which strongly scatters light [19]. This has important implications for our polariton spectroscopy measurements, and is discussed more fully in section 4.2.2. MgO doped LiNb03 is substantially more resis- tant to photorefractive damage than LiNb03 or LiTa03, and a n experiment identical to figure 2-4 is presented in figure 2-5 at a temperature of 8K. As expected, the damp- ing of the polariton mode is significantly reduced, and the frequency of the polariton mode changes slightly. The signal to noise ratio of the data is diminished relative to that of the high temperature measurement; this is due to the photorefractive ef-
Time
[ps]
Figure 2-5: Transient grating ISRS experiment in 5%MgO:LiNb03 at 8 K excites a phonon-polariton response with a wavevector magnitude of 1090 cm-' and a frequency of 2.23 THz. Reversible photorefractive damage degrades the signal quality relative to figure 2-4 by scattering the optical pump light, but less damping in the LiNb03 at low temperature generates a longer polariton pulse train.
fects and becomes progressively worse with exposure to the optical excitation pulses. For example it was only possible to take this scan over several minutes before pump scatter overwhelmed the reference field. Sum frequency chopping of both the pump and probe was also used to minimize the effects of the scattered pump light. This data scan would not have been possible in undoped LiNb03 or LiTa03 due to the photorefractive effects.
2.5
Free Space
THz
Spectroscopy
A
simple implementation of conventional THz spectroscopy was performed to provide a comparison to the phonon-polariton spectroscopy measurements pioneered in chap- ter 4. In this context, we use "conventional" THz spectroscopy to mean the use of any of a variety of THz sources, including photoconductive antennas or electro-optic crystals such as zinc telluride or LiNb03, where THz radiation propagates throughfree space, and gold parabolic mirrors are used to collimate and focus the THz radi- ation into a sample and then into a detector (usually a electrooptic detection crystal or a photoconductive antenna). These techniques are well established [I] and such THz spectroscopy set-ups are published [20].
LIA
90 degrees off axis parabolic mirror lens ZnTe < 1 1 0> 4- Emitter echelon
K
A-7 Laser, 800 nm/
3 mJ, 60fs, lKHz delay stageFigure 2-6: Free space THz spectrometer experimental apparatus. Phonon-polaritons are generated in LiNb03 and coupled to free space. The THz radiation induces birefringence in an optical probe in the ZnTe crystal. Figure prepared by Ka-Lo Yeh.
Our implementation of free space THz spectroscopy is only a small part of the work presented in this thesis, and while it is sensitive (signal-to-noise
-
it is notstate of the art. Our free space THz spectroscopy experimental set-up is presented in figure 2-6. An amplified femtosecond laser system (Odin Quantronix) that produced 3 mJ, 60 fs pulses centered at 800 nm with 1 KHz repetition rate were used to generate phonon-polaritons in a LiNb03 crystal. The crystal was cut to more effectively couple THz radiation to free space. The THz radiation is collimated and focused through the sample by pair of parabolic gold mirrors (f= 19.5 cm). A second set of parabolic
gold mirrors (f= 19.5 cm) is used to focus the THz radiation into a 500 pm ZnTe detection crystal ([I101 cut, INGCRYS Laser Systems Ltd, UK). The ZnTe crystal
was coated with indium-tin oxide (ITO) which serves as an anti-reflection coating. The THz radiation modulates the optical index of refraction of ZnTe via the Pockel's effect [21,22], and this modulation is measured with a circularly polarized probe beam. A Wollaston prism is used to split the probe beam to two photodiodes, and the difference signal is measured with a lockin amplifier.
A mask of ~1 by 2 mm is used at the focus of parabolic gold mirror that focuses the THz into the sample to ensure that the spot size of the THz radiation field is smaller than the sample and that all of the THz radiation goes through the sample. This mask does not significantly reduce the transmitted THz.
2.6
"Deathstar" Optical Pulse Shaper
The "Deathstar" is an ultrafast optical pulse shaper which generates tunable optical pulse trains with frequencies between 1-1000 GHz [9,10]. At 1 GHz, this corresponds
to 1 ns delay between pulses, which is well beyond the temporal window of conven- tional femtosecond pulse shapers. The Deathstar pulse shaper was designed to access these lower frequencies for acoustic measurements, and in this thesis we use it to
generate multicycle polarit on waveforms that are discussed in section 4.7. Figure 2-7 shows the Deat hstar apparatus.
DEATHSTAR
Temporal ~ u l s e s h a ~ e r
r
Dsl
2
Pump
Beam
A
single laser pulse is introduced to the system of retro-reflectors in the pulse shaper, where it completes seven round trips around the Deathstar cavity. Each time the pulse passes the custom-designed variable reflector (part Ds4), part of the pulse is transmitted. The reflection coefficients of the different parts of the variable reflector are designed so that that temporal envelope of energies of the seven pulses leaving the pulse shaper is roughly Gaussian. The details of the variable reflector are discussed in the thesis of Dr. Jaime Choi [9]. The system of mirrors following the pulse shaper cavity compensates for the ~ 2 0 cm round trips that each successive pulse traverses, to temporally re-overlap the pulses when the delay line is at its zero position.By adjusting the position of the delay line in figure 2-7 to enlarge the pulse shaper cavity, the temporal separation between successive pulses is increased evenly. When the delay line is at its maximum extension, the pulses are separated by 500 ps, re- sulting in a 2 GHz pulse train, and this limit could easily be lowered through use of a longer delay line. The upper frequency limit of the pulse shaper is roughly 2 THz, and is constrained here by the laser pulse duration.
The Deathstar pulse shaper was used to generate multicycle polariton radiation, but was not optimized for this purpose. In particular, two features contributed to poor polariton generation and detection. First, the RegA pulses, when cylindrically focused, are below the damage threshold of the LiTaOs crystal; using the Deathstar to divide this pulse into a seven pulse train provided only weak polariton generation for each pulse. To compensate for this, the pump excitation was not focused cylin- drically, but to a spot of comparable size to the probe. This allowed for more intense polariton excitation, but the polaritons radiated conically away from the round ex- citation spot, and could not be effectively detected far from the generation location. Finally, the nonzero angles between the excitation pulses resulted in successive po- lariton wavefronts with small angles between them, further degrading the multicycle polariton wave and creating wavefront matching issues with the polariton probe field.
Chapter 3
Phonon-polaritons as a
THz
Source
Work by Dan Grischkowsky [23], David Auston, and Martin Nuss [24,25] led to the development of broadband pulsed THz radiation sources utilizing femtosecond lasers. These advancements allowed the development of femtosecond-based sources of coherent far-infrared radiation and represented a significant technological advance- ment over competing THz sources. Earlier THz sources consisted of arc lamps with bolometric detection and Fourier Transform IR spectrometers that contained spe- cial far IR optics. Both of these are inherently continuous wave techniques that measure intensity and, subject to noise from thermal background radiation, are sig- nificantly less sensitive then the time gated techniques. Another important class of THz sources are synchrotron radiation and free electron lasers, but availability and expense limit their scope. Moreover, even though they are pulsed time domain sources, their pulse widths are rather long (3-10 ps) compared to the newer femtosec- ond based sources [l]. The THz, or far-infrared spectral region, usually considered to be 0.1-10 THz (A = 3 - 0.03 mm
o
3.3 - 330 cm-I), is intermediate between electronic sources that can operate out into the many gigahertz regime and optical sources that can operate down to approximately the mid-infrared region. To date, THZ sources based on femtosecond-laser excitation have been applied to a wide range of problems of chemical interest in both the gas and condensed phase. A compre- hensive review is given by Schmuttenmaer and coworkers [I]. In comparison to more traditional IR spectroscopy which investigates intermolecular vibration, THz spec-troscopy probes lower frequency motion, such as intramolecular modes of vibration, torsions and rotations in molecules, and phonons is solids.
The ability of THz radiation to penetrate plastics, paper, and textiles has led to a strong interest in THz technologies. THz spectroscopy has been used to nonin- vasively detect the chemical explosive C-4 in postal envelopes [26]. THz spectral identification, much like conventional IR spectroscopy, has gathered much interest from pharmaceutical companies, especially after THz was used to distinguish the pure enantiomers L- D- analine from its racemic mixture [27]. THz spectroscopy has been performed on molecules within flames [28], something that would never be possible with a CW detector because of the intensity of the thermal background. In the condensed phase, both polar and non-polar liquids [29] have been studied as well biological applications like marker-free monitoring of DNA binding [30]. THz imaging has been performed on integrated chips [31], and even three-dimensional topographic imaging [32] has been demonstrated. THz sources have also been pro- posed for applications in coherent control [33], signal processing 1341, nonlinear THz spectroscopy [35-381, and quant um computation [39].
This thesis develops a new approach to THz spectroscopy that utilizes phonon- polaritons as a time domain THz radiation source. Phonon-polaritons are coupled lattice vibrational and electromagnetic modes of an ionic crystal that travel at light like speeds. Phonon-polaritons generated in the ionic crystals LiTa03 and LiNb03 provide an attractive platform for THz spectroscopy, because of flexibility in gener- ation and detection and the ability to integrate a THz source into a unified device.
A
discussion of the advantages of phonon-polaritons will be presented in chapter 4 in the context our implementation of phonon-polariton spectroscopy. This chapter will introduce the basic theory of polaritons. Section 3.1 will introduce the basic principles and properties of polarit ons. Next, Sect ion 3.2 will introduce impulsive stimulated Raman scattering (ISRS) and its application to polariton modes. Finally Section 3.3 will introduce the basic principles of generation and detection.3.1
Introduction to Phonon-Polaritons
Phonon-polaritons are coupled lattice vibrational and electromagnetic modes of an ionic crystal that propagate at light-like speeds with frequencies typically in the 0.1- 5 THz range. A phonon-polariton is a is a fundamental quantized physical excitation consisting of a phonon-photon transverse wave field. Chapter 4 will demonstrate the use of localized macroscopic coherent superpositions of these excitations as a means for performing THz spectroscopy. Following the presentation of Vaughan [6], a brief theoretical description of phonon-polaritons is given below. For a more detailed analysis, the following references are useful [4,16,40-431.
The ionic crystals that we use for phonon-polariton generation are LiTa03 and LiNb03. The essential character of a phonon-polariton mode stems from the coupling between transverse optic phonon modes and a macroscopic polarization.
A
simple mathematical model for this coupling is described by the following set of coupled differential equations.Q(t) is the normal coordinate of the transverse optical phonon mode with fre- quency w ~ o ,
I?
is a phenomenological damping constant, E ( t ) is electric field, P ( t ) is polarization, and ~ ( t ) and ~ ( t ) represent the first and second temporal derivatives of Q(t), respectively. In general, multiple modes may couple to E ( t ) , but here we will use a single oscillator model and will show later on that this is justified for LiTa03 and LiNb03. The constants b12, bzl, and b22 will be discussed below. P ( t ) ,E
(t), Q(t), etc. have been expressed as scalar quantities, which is sufficient for the present anal- ysis. In physical terms, equation 3.1 describes a damped harmonic oscillator with an additional term b12E(t) governing the coupling of the polar vibrational displacements to an electric field. This coupling gives polaritons macroscopic correlation lengths and leads to dispersion in phonon-polarit on propagat ion. Equation 3.2 describes thedielectric response of the coupled system as the sum of two terms, where the first term describes the polarization response due to the phonon mode (essentially dipole times ionic displacement) and where the second term describes the polarization response of the crystal due to all other effects. Using equations 3.1 and 3.2 and the consti- tut ive relation for the electric polarization P ( t ) we will now determine the relative permittivity of the coupled system.
The constitutive relation for electric polarization in SI units is
where €0 is the permittivity of free-space, xe(w) is the dielectric susceptibility, and
E, (w) is the relative permittivity. Inserting trial plane-wave solutions of the form
Q(t) = JQ(t)l exp[i(kx - wt)] and E ( t ) = IE(t)l exp[i(kx - wt)] into equation 3.1 yields an expression for Q in terms of frequency.
Substitution of equation 3.4 into equation 3.2 yields an expression for the polarization in terms of electric field which may then be equated to equation 3.3, giving
Equation 3.5 may now be used to solve for &,(w):
Equation 3.6 contains two terms: the first term is nonresonant, describing the sys- tem at optical frequencies far above w ~ o , and the second describes the system near resonance and leads to phonon-polariton dispersion.
The constants b12, b21, and bz2 will now be connected to physical quantities by considering limiting cases for the relative permittivity. When w + oo, the resonant
term in equation 3.6 vanishes, leaving
Similarly, when w -, 0, we are left with
From the above equations, the constants b12, b 2 ~ , and b22 are determined to be
where EO and E, are defined as asE, G &,(GO) and EO
=
~ ~ ( 0 ) . NOW, we may rewrite equation 3.6 as:Equation 3.10 was derived assuming only one oscillator mode. The crystals we use for polariton generation, LiNb03 and LiTa03, have CsV lattice symmetry with four Al symmetry IR and Raman active modes that could be excited under our experimental conditions. There is an independent equation of the form of equation 3.10 for each of them. Table 3.1 shows the relevant parameters for each of the modes. For both LiNb03 and LiTa03 the lowest order mode has the largest oscillator strength, and this is the dominant mode observed. Additionally, the highest frequency modes have frequencies that are too high to be driven impulsively by our experimental laser pulses (250 fs duration). This justifies the use of only the single phonon mode. Each of the four modes also has its own dispersion curve. Figure 3-1 shows the dispersion curve for the dominant (lowest) A1 mode of LiTa03. Two branches of solutions are obtained from the dispersion relation, a n upper branch and a lower branch. An important and well-known property of LiTa03 and LiNb03 is that phonon-polaritons exhibit a large
Table 3.1: Al symmetry transverse optical phonon modes in LiNb03 and LiTa03 obtained from ref. 144,451. S is the coupling strength between the lattice vibration and the electromagnetic radiation.
dispersion resulting from the coupling between the polar transverse optic phonon mode and transverse electromagnetic radiation. This coupling also creates a splitting in the allowed frequencies of transverse optic phonon mode polariton propagation is forbidden. In the low wavevector limit, the upper branch of TO phonons asymptoti- cally approaches the longitudinal optic phonon frequency WLO. In the optical regime, the dispersive properties of materials are often described in terms of a wavelength (or frequency) dependent index of refraction. Here, instead, the dispersion is customarily presented in terms of the dispersion relation w(k). Using E,(w) = n ( ~ ) ~ = c2k2/w2, where n is refractive index, and assuming no damping, we obtain:
As section 3.2 will show, only frequencies well below the w ~ o of LiTa03 and LiNb03 can be accessed within the bandwidth our femtosecond excitation pulses. This limits us to the the lower branch of the dispersion curve, and then only in the range of approximately 0.2-1 THz. In this region, the dispersion is approximately linear and the phonon-polaritons are considered to be primarily light-like. This is the useful regime for polariton spectroscopy.
Figure 3-1: Simulated phonon-polariton dispersion curve for LiTa03. The solid lines indicate the upper and lower polariton branches. The dashed lines describe the dis- persion of uncoupled optical radiation. The band gap describes the region where phonon-polariton propagation is forbidden. The lower branch at low wavevector is the region of interest for our experiments.
3.2
Impulsive Stimulated Raman Scattering
The phonon-polaritons that we utilize for polarit on spectroscopy are generated via im- pulsive stimulated Raman scattering (ISRS) by irradiating either LiTa03 or LiNb03 with a short (<250 fs) laser pulse. Here we present ISRS in the general case of a single vibrational mode and then we extend it to the phonon-polariton modes, which because of their coupled nature behave differently than ordinary vibrational modes.
A
basic physical picture of ISRS is that a femtosecond optical excitation pulse, with frequencies too high to drive a lattice vibration resonantly, instead drives the lattice vibrational modes indirectly though nonlinear coupling to the electrons. The electrons drive the lattice at much lower resonance frequencies (THz in our case) via difference frequency mixing among frequency components within the bandwidth of the pulse.A
convenient mathematical description of ISRS in the time domain is given in terms of a damped and driven harmonic oscillator, described by the differential equation below.Q is the normal mode coordinate of a generic vibrational mode with resonant fre- quency wo, a damping term governed by
I?,
and a driving term F ( t ) . Here, the driving term is due to an optical laser excitation pulse. In the "impulsive" limit, where an excitation pulse is much shorter than the period of the mode being excited, the force exerted by the laser excitation pulse is proportional to the product of the differential polarizability ( a ~ . / a Q ) ~ and the intensity of the excitation pulse Iexc(t) [46,47],If we consider the solution of equation 3.12 when the input laser pulse is taken to be a delta-like pulse that arrives at time t = 0, the impulse response function of the oscillator, G(t), may be determined to be
~ ( t ) rn @(t) exp
(- :)
sin(J-t) where 8 ( t ) is the Heaviside step-function given by:The Heaviside step-function is necessary such that G(t) obeys causality and is zero for negative times. When an input pulse I ( t ) of short but finite duration is used, Q(t) may be determined by convolving the input pulse with G(t), such that
From equations 3.16 and 3.14, the expected response for a single underdamped vi- brational mode is therefore a exponentially damped sinusoid. For multiple oscillators the total signal is given by the sum of the individual oscillators.