HAL Id: hal-00577326
https://hal.archives-ouvertes.fr/hal-00577326
Submitted on 17 Mar 2011
HAL is a multi-disciplinary open access archive for the deposit and dissemination of sci-entific research documents, whether they are pub-lished or not. The documents may come from teaching and research institutions in France or abroad, or from public or private research centers.
L’archive ouverte pluridisciplinaire HAL, est destinée au dépôt et à la diffusion de documents scientifiques de niveau recherche, publiés ou non, émanant des établissements d’enseignement et de recherche français ou étrangers, des laboratoires publics ou privés.
distribution in the outcoming fractions
Gisella Rios, Nadine Zakhia-Rozis, Marc Chaurand, Florence Richard-Forget,
Marie-Françoise Samson, Joel Abecassis, Valérie Lullien-Pellerin
To cite this version:
Gisella Rios, Nadine Zakhia-Rozis, Marc Chaurand, Florence Richard-Forget, Marie-Françoise Sam-son, et al.. Impact of durum wheat milling on the deoxynivalenol distribution in the outcoming fractions. Food additives & contaminants. Part A. Chemistry, analysis, control, exposure & risk as-sessment, Taylor & Francis, 2009, 26 (04), pp.487-495. �10.1080/02652030802382717�. �hal-00577326�
For Peer Review Only
Impact of durum wheat milling on the deoxynivalenol distribution in the outcoming fractions
Journal: Food Additives and Contaminants Manuscript ID: TFAC-2008-095.R1
Manuscript Type: Original Research Paper Date Submitted by the
Author: 25-Jul-2008
Complete List of Authors: RIOS, Gisella; INRA, UMR 1208 IATE
ZAKHIA-ROZIS, Nadine; CIRAD, UMR 1208 IATE CHAURAND, MARC; INRA, UMR 1208 IATE RICHARD-FORGET, Florence; INRA, UR 1264 SAMSON, Marie-Françoise; INRA, UMR 1208 IATE ABECASSIS, JOEL; INRA, UMR 1208 IATE
LULLIEN-PELLERIN, Valérie; INRA, UMR 1208 IATE Methods/Techniques: Chromatography - HPLC, Traceability
Additives/Contaminants: Mycotoxins Food Types: Cereals and grain
For Peer Review Only
Impact of durum wheat milling on the deoxynivalenol distribution in the
out-1
coming fractions
2 3
G. RÍOSa, N. ZAKHIA-ROZISb, M. CHAURANDa, F. RICHARD-FORGETc, M.F. SAMSONa, J. 4
ABECASSISa & V. LULLIEN-PELLERINa*. 5
6
aINRA, UMR 1208, Ingénierie des Agropolymères et Technologies Emergentes, 2 Place Pierre
7
Viala, F-34060 Montpellier cedex1, France ; bCIRAD, UMR 1208, Ingénierie des Agropolymères et
8
Technologies Emergentes, TA 40/16 73 Rue JF Breton 34398 Montpellier cedex 5, France ; cINRA, 9
U.R. 1264, Mycologie et Sécurité des Aliments, Domaine de la Grande Ferrade, 71 Av. Edouard 10
Bourleaux, BP 81, 33883 Villenave-d’Ornon cedex, France. 11 12 13 14 15 16 17 18 19 20 21 22 23 24 25
* Corresponding author. E-mail : lullien@supagro.inra.fr
1 2 3 4 5 6 7 8 9 10 11 12 13 14 15 16 17 18 19 20 21 22 23 24 25 26 27 28 29 30 31 32 33 34 35 36 37 38 39 40 41 42 43 44 45 46 47 48 49 50 51 52 53 54 55 56 57 58 59 60
For Peer Review Only
1Abstract
2
The milling behavior of two naturally infected samples of durum wheat grain with contrasting levels of
3
mycotoxins was studied. Although the two samples showed a similar milling behavior, an increase of about
4
twenty percent in deoxynivalenol (DON) levels was found in semolina from the sample containing the higher
5
level of mycotoxin. However, even if the highest concentration of DON was found in fractions originating
6
from the grain outer layers, the mycotoxin contamination in semolina and flours were not related to the
7
amount of two compounds (ash or phytic acid) that could be used as markers to monitor these external
8
tissues. The presence of the trichothecene-producing fungi in the most internal semolina fraction was also
9
shown using specific DNA primers and PCR amplification. Comparison of DON concentrations in the feed
10
stock and corresponding output at each milling step or grinding of semolina fractions followed by sizing
11
showed that concentration of the mycotoxin occurs in the finest particles at the first processing steps.
12
Therefore, DON contamination of the milling fractions is not simply due to the presence of peripheral grain
13
tissues.
14 15
Key words: deoxynivalenol (DON), durum wheat, Fusarium spp., milling, mycotoxin, Triticum.
16 1 2 3 4 5 6 7 8 9 10 11 12 13 14 15 16 17 18 19 20 21 22 23 24 25 26 27 28 29 30 31 32 33 34 35 36 37 38 39 40 41 42 43 44 45 46 47 48 49 50 51 52 53 54 55 56 57 58 59 60
For Peer Review Only
Introduction1
Fusarium head blight (FHB) or scab is a worldwide disease of wheat (Triticum aestivum and
2
durum) and other small grain cereals which is caused by several Fusarium species (Parry et al.
3
1995; Bai et al. 2001). In Europe, Fusarium graminearum is one of the most frequently encountered 4
species on wheat (Goswami and Kistler 2004) mainly when wet and warm weather coincided with 5
the wheat anthesis and the beginning of grain filling (Bottalico and Perrone 2002; Champeil et al. 6
2004). This fungal disease leads to the formation of shrivelled, light test-weight kernels that reduce 7
grain yield and quality and affect milling yield (Edwards 2004). 8
In addition to grain yield loss due to FHB, production by Fusarium of toxic secondary metabolites 9
known as mycotoxins (Bennett and Klich 2003) may also impair the end-use of the harvested 10
cereals. One of these mycotoxins, deoxynivalenol (DON), which belongs to the trichothecene 11
(TCT) family could be considered as the most important wheat contaminant, as demonstrated by 12
surveys on its occurrence in grain (Bottalico and Perrone 2002). Its ingestion by animals was found 13
to lead to different symptoms depending on the sensitivity of species such as a decrease in weight 14
gain and nutritional efficiency, anorexic syndromes and altered immune function (Pestka 2007). 15
Due to its proved toxicity and its potential effect on the immune system, the European Community 16
have strictly fixed (EC regulation number 1881, 2006) the maximum DON authorized level in 17
unprocessed durum or common wheat grains at 1750 and 1250 µg.kg-1 respectively and in resulting 18
flours or semolina at 750 µg.kg-1. 19
Some control of DON contamination in the field could probably be obtained by the selection of 20
resistant cultivars (Gervais et al. 2003; Jiang et al. 2007) and a better knowledge of the 21
environmental factors which are involved (Edwards 2004; Koch et al. 2006). However, the 22
fractionation process, as one of the final steps leading to the cereal end-products, remains critical to 23
control the mycotoxin content in consumed fractions. If the first stages of Fusarium contamination 24
appear to be limited to the grain outer layers (McKeehen et al. 1999), contamination may be 25 1 2 3 4 5 6 7 8 9 10 11 12 13 14 15 16 17 18 19 20 21 22 23 24 25 26 27 28 29 30 31 32 33 34 35 36 37 38 39 40 41 42 43 44 45 46 47 48 49 50 51 52 53 54 55 56 57 58 59 60
For Peer Review Only
reduced by the milling process that separates the endosperm from the bran containing these outer 1
layers, the fungi and the toxins could also be found in the endosperm (Kang and Buchenauer 1999; 2
Jackowiak et al. 2005) that leads to flours or semolina. Previous studies on durum wheat showed 3
that a significant reduction of the average DON level could be achieved at each step of the grain 4
processing (Nowicki et al. 1988; Dexter et al. 1997; Visconti et al. 2004; Manthey et al. 2004). 5
However, the relationship between these steps and the tissue origin of the different fractions have 6
not been investigated neither the effect of the level of contamination on the DON distribution. 7
In this paper, the grain characteristics and milling behavior at a semi-industrial scale of two 8
naturally infected samples of the same durum wheat cultivar but displaying distinctly different 9
levels of DON were analyzed. Furthermore, the impact of the milling process on the DON 10
distribution in the outcoming fractions was compared and discussed. 11
12
Material and methods
13
Wheat samples and grain characterization
14
Two samples of Triticum durum (Acalou cultivar) cultivated in France in 2003 were stored at 4°C 15
before milling. 16
Test weight and determination of Thousand Kernel Weight (TKW) determination were performed 17
respectively with standard AACC method 55-10 (AACC 2000) and ISO method (N°520, 1977). 18
Grain vitreousness was assessed by analysis of kernel cross-sections (obtained with a Pohl kernel 19
cutter, Versuchs und Lehranstalt für Brauerei, Berlin, Germany) and expressed by the percentage of 20
vitreous versus mealy grains. 21
Particle Size Index (PSI) was determined according to the adapted AACC method 55-30 (AACC 22
2000). Twenty grams of each wheat sample were ground with a laboratory mill 3303 (Perten 23
Instruments AB, Huddinge, Sweden) and the product obtained was sieved for 10 min using 75µm 24
sieve (LS-PRO, Hosokawa Alpine AG, Germany). The PSI corresponds to the percentage weight of 25
particles able to pass through the sieve. 26 1 2 3 4 5 6 7 8 9 10 11 12 13 14 15 16 17 18 19 20 21 22 23 24 25 26 27 28 29 30 31 32 33 34 35 36 37 38 39 40 41 42 43 44 45 46 47 48 49 50 51 52 53 54 55 56 57 58 59 60
For Peer Review Only
1Milling conditions
2
Cleaned grain was tempered to 17% water content before milling. Durum wheat milling was 3
performed using a semi-industrial semolina mill (150 kg.h-1) as described before (Chaurand et al. 4
1999). It was equipped with four break rolls or four reduction rolls followed by sifters for sizing and 5
six sizing purifiers (Figure 1). This led to the production of four break flours (BF2 to BF5) and four 6
reduction flours (RF1 to RF4); six purified semolina (SE1 and SE3 which corresponds to the inner 7
endosperm, SE2 and SE4 originating from more external part of the endosperm compared with SE1 8
and SE3, SE5 and SE6 coming from the most peripheral part of the endosperm) and four bran or 9
middlings: coarse bran (CB), purified fine bran (PFB), sized fine bran (SFB), and shorts (SH). Each 10
fraction was collected and its yield expressed as weight percentage of the total milled grain amount. 11
Furthermore, an aliquot sample of the 14 feeding fractions from each roll or purifier were also 12
recovered. The collected fractions were stored at 4°C. 13 14 Figure 1 15 16 Biochemical analyses 17
Water and ash content of the grain were determined in triplicate according to standard AACC 18
methods 44-19 and 08-12 respectively (AACC 2000). The phytic acid content was measured at 500 19
nm from acidic extract of ground grains or milling fractions using a colorimetric method described 20
by Latta and Eskin (1980) and modified by Vaintraub and Lapteva (1988). A standard curve was 21
obtained with corn phytate (P-8810, Sigma-Aldrich, St Quentin Fallavier, Fr.) solutions of known 22 concentrations. 23 24 1 2 3 4 5 6 7 8 9 10 11 12 13 14 15 16 17 18 19 20 21 22 23 24 25 26 27 28 29 30 31 32 33 34 35 36 37 38 39 40 41 42 43 44 45 46 47 48 49 50 51 52 53 54 55 56 57 58 59 60
For Peer Review Only
DON measurement
1
All the fractions were homogenized before their division to obtain a representative sample and 2
eventually ground in order to reduce the particle size below 500 µm. DON was then extracted at 3
room temperature with 100 mL of 84 % (v/v) acetonitrile in water using 25 g of each fractions 4
except for bran and middling fractions which allowed the amount to be reduced to 15 g. The 5
mixture was shaken 30 min and homogenized with an Ultra Turrax for 3 min. After filtering 6
through Whatman No. 1 filter paper, 8 mL of the filtrate were passed through a Mycosep 225 7
column (Romer Labs., Union, MO, USA). The recovered purified solution (4 mL) was transferred 8
to a new vial and the solvent evaporated to dryness under a stream of nitrogen at 50°C. The dry 9
residue was then stored in a tightly closed glass bottle at −20°C until use or suspended in 500 µL of 10
methanol 20 % (v/v) and centrifuged (20000g, 6 min) before RP-HPLC analysis. 11
The DON extract (50 µL) was injected on a NovaPak C18 column (60Å, 4 µm, 150 × 3.6 mm,
12
Waters SAS, Guyancourt, Fr.) and equilibrated with 7% (v/v) acetonitrile at a flow rate of 0.7 13
mL.min-1. Elution was obtained by increasing the acetonitrile concentration in water to 80 % after 14
15 min. DON was detected at 218 nm with a 2487 dual λ UV detector (Waters SAS, Guyancourt, 15
Fr.). Commercial DON (Sigma-Aldrich, St Quentin Fallavier, Fr) was used to prepare calibration 16
standards ranging from 0.1 to 1 µg.mL-1. To assess a calibration curve with the standards, a linear 17
regression was fitted on the data. DON concentration in the extracts were computed from the 18
regression curve. Mean DON recovery was estimated at 98.5 % with a 5.9 % coefficient of 19
variation from a wheat standard flour sample (FAPAS, T2210, with an average concentration of 463 20
µg.kg-1) and based on triplicate measurement on four distinct extractions. 21
22
Detection of TCT-producing Fusarium spp.
23
DNA was extracted from ground grains (200 mg) or milling fractions with the DNeasy Plant 24
Mini Kit from Qiagen (Qiagen S.A., Les Ulis, Fr.) according to the manufacturer instructions. All 25
PCR amplifications were carried out in 50 µl with 1ng of DNA template. Reactions mixtures 26 1 2 3 4 5 6 7 8 9 10 11 12 13 14 15 16 17 18 19 20 21 22 23 24 25 26 27 28 29 30 31 32 33 34 35 36 37 38 39 40 41 42 43 44 45 46 47 48 49 50 51 52 53 54 55 56 57 58 59 60
For Peer Review Only
contained 25 pmoles of each primers (Tox5-1: GCTGCTCATCACTTTGCTCAG; Tox5-2: 5’-1
CTGATCTGGTCACGCTCCATC) defined according to previous studies (Niessen and Vogel 2
1998), 2.5 U of DNA polymerase (Invitrogen Co., Cergy-Pontoise, Fr.), 400 µM of each 3
deoxynucleotide triphosphate (Promega, Charbonnières, Fr.). Reactions were performed using the 4
following PCR conditions: denaturation at 95°C for 1min 30, 40 cycles of denaturation at 95°C for 5
30 s, annealing at 55°C for 40 s and extension at 72°C for 30s, final extension at 72°C for 5 min, 6
followed by cooling at 4°C. Amplification products were analysed on a 1% agarose gel stained with 7
ethidium bromide. Genomic DNA extracted from the fungi F. graminearum was kindly given by L. 8
Pinson-Gadais (INRA, Bordeaux). 9
10
Results and discussion
11 12
Wheat characterization and milling behavior
13
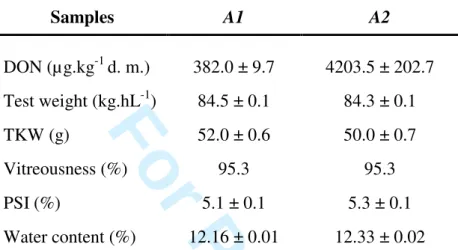
Two durum wheat samples from the cultivar Acalou were selected as their levels of natural 14
contamination with DON were found to be different. The first sample (A1) was found to contain 15
382 µg.kg-1 (d. m.) of DON and thus could be considered acceptable in accordance to the European
16
Community legislation whereas the other (A2) displayed a DON level around 4203 µg.kg-1 (d. m.). 17
As Fusarium infection could lead to important grain damage that might severely affect the milling 18
behavior, the physical characteristics (test weight, TKW, vitreousness, PSI, water content) of wheat 19
grains from both samples were measured and compared. 20
21
Table 1
22 23
Table 1 clearly illustrates that even if the DON level in A2 is more than ten fold higher than that in 24
A1, no apparent differences between grain characteristics of the two wheat grain samples were
25
observed. As these samples shared common grain characteristics, it was interesting to compare their 26
milling behavior, deoxynivalenol concentration and distribution in the generated fractions. The 27 1 2 3 4 5 6 7 8 9 10 11 12 13 14 15 16 17 18 19 20 21 22 23 24 25 26 27 28 29 30 31 32 33 34 35 36 37 38 39 40 41 42 43 44 45 46 47 48 49 50 51 52 53 54 55 56 57 58 59 60
For Peer Review Only
yield of each fraction obtained after grain milling at a semi-industrial scale (150 kg.h-1, milling 1
scheme in Figure 1) are summarized in Table 2. Even if the samples displayed a different level of 2
toxin, which could either be due to a different growth of the fungi or a distinct toxin production 3
level, no drastic changes were observed between the milling yields of the different fractions from 4
both of the samples, taking into account the coefficient of variation. 5
6
Table 2
7 8
DON concentration and distribution in the milling fractions
9
The DON concentration in all of the milling fractions were then determined and compared (Table 10
2). According to previous studies (Nowicki et al. 1988; Visconti et al. 2004), the most contaminated 11
fractions were the coarse bran (CB) and the purified fine bran (PFB). Indeed, these fractions contain 12
the major part of the grain outer layers that are the first to be infected by Fusarium (Jackowiak et al. 13
2005). These fractions showed a two to four fold concentration of DON compared to the grains as 14
demonstrated by the concentration ratio reported in Table 2. 15
Whatever the wheat sample, the other most contaminated fractions were the first two break flours 16
with DON concentration close to twice the toxin concentration in the grain. High amounts of DON 17
in these flours could be due to contamination with the outer layers at the grain breaking step or to 18
higher amounts of DON in the tissues from which these flours are originated. In contrast, the DON 19
concentration in the reduction flours however were found similar to those in the raw material. As 20
expected, the lowest concentration of DON was found in total semolina. However, the 21
concentration ratio between the toxin concentration in semolina and grains pointed out that 22
reduction of the DON concentration was more efficient for the less contaminated wheat sample (40 23
% in A1 compared to 30 % in A2). 24
Comparison between distribution of the dry mass and DON amount in each type of the milling 25
fractions were calculated and summarized in Table 3. 26 1 2 3 4 5 6 7 8 9 10 11 12 13 14 15 16 17 18 19 20 21 22 23 24 25 26 27 28 29 30 31 32 33 34 35 36 37 38 39 40 41 42 43 44 45 46 47 48 49 50 51 52 53 54 55 56 57 58 59 60
For Peer Review Only
1Table 3
2
A distinct distribution of the total amount of DON in the milling fractions was obtained depending 3
on the wheat sample. Indeed, in the most contaminated grain sample, the highest toxin proportion 4
was found in semolina whereas, in the less contaminated sample, this highest toxin proportion was 5
found in bran and shorts. Two hypotheses could explain this difference in DON distribution: a 6
higher friability of the outer layers in the most contaminated grain sample or a higher amount of 7
toxin in the endosperm of these grains. In order to test a potential link between the increase of DON 8
proportion in semolina and contamination of this milling fraction with the outer layers, ash and 9
DON concentrations in semolina and flours were analyzed and compared (Figure 2). 10
11
Figure 2
12 13
Results clearly demonstrated that fractions displaying the highest DON concentration were not the 14
same as those showing the highest ash level. This lack of correlation between ash and DON 15
concentration was observed in both of the durum wheat samples. Therefore, it suggests that the 16
highest amount of DON in semolina from the A2 sample could not be simply due to the presence of 17
grain outer layers in these fractions. These results are in accordance with a previously published 18
study dealing with common wheat milling fractions (Seitz et al. 1985). Furthermore, the phytic acid 19
concentration, that could be used to track the aleurone cell content (Greffeuille et al. 2005), was 20
also determined in semolina and flours from the most infected grains. Results confirmed the 21
absence of relationships between DON concentration in these milling fractions and presence of the 22
grain peripheral tissues. Indeed, the phytic acid concentration was found to increase from the inner 23
to the outer endosperm semolina (5.0 mg.g-1 d.m. in SE1 to 15.5 mg.g-1 d.m. in SE6) as well as 24
from the first break and reduction flours compared to the last one (respectively between 12.6 and 25
27.0 mg.g-1 d.m. from BF2 to BF5 and between 15.2 to 34.6 mg.g-1 d.m. from RF1 to RF4). 26 1 2 3 4 5 6 7 8 9 10 11 12 13 14 15 16 17 18 19 20 21 22 23 24 25 26 27 28 29 30 31 32 33 34 35 36 37 38 39 40 41 42 43 44 45 46 47 48 49 50 51 52 53 54 55 56 57 58 59 60
For Peer Review Only
Therefore, the observed higher DON concentration in flours from the first break and reduction rolls 1
compared to the last ones was not only due to a contamination with the grain outer layers but rather 2
resulted from highly infected particles obtained at the first steps of grain breaking. Production of 3
these fine particles from infected parts of the endosperm could be generated by the fungus 4
penetration and by degradation of this tissue as already suggested for common wheat (Seitz et al. 5
1985). 6
7
Fusarium detection in the milling fractions
8
In order to monitor the TCT-producing Fusarium species, DNA extraction was performed from 9
each type of milling fractions and amplified by PCR. The primers used for amplification were 10
derived from the gene Tri5 encoding the first enzyme (trichodiene synthase) involved in the TCT 11
biosynthetic pathway, that was already been demonstrated to be a pertinent probe to track TCT-12
producing fungi (Niessen and Vogel 1998). Results of the PCR amplification, reported in Figure 3, 13
revealed the expected specific fragment (658 bp). 14
15
Figure 3
16 17
All of the analyzed fractions were found to contain TCT-producing fungi. A higher amount of 18
fungi appeared in the fractions enriched in the grain peripheral tissues, such as coarse bran (CB) and 19
other bran and short fractions. But semolina coming out from the inner endosperm (SE1 and SE3) 20
was also found to contain TCT-producing fungi. These data are in accordance with previous results 21
obtained by Pinson-Gadais et al. (2007) however in a distinct durum wheat cultivar. Furthermore, 22
the fractions from the most contaminated grains also appeared to contain a higher amount of fungi. 23
Therefore, DON contamination in semolina could be due to the toxin production by fungi inside the 24 endosperm tissue. 25 26 1 2 3 4 5 6 7 8 9 10 11 12 13 14 15 16 17 18 19 20 21 22 23 24 25 26 27 28 29 30 31 32 33 34 35 36 37 38 39 40 41 42 43 44 45 46 47 48 49 50 51 52 53 54 55 56 57 58 59 60
For Peer Review Only
Relationship between roll and purifier feedings and corresponding outputs
1
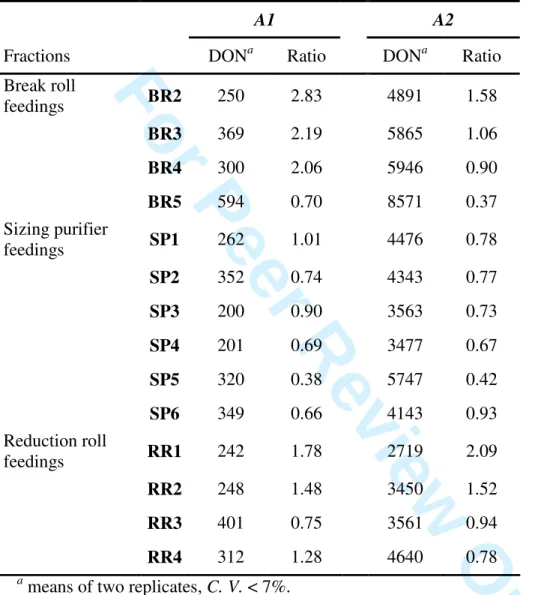
In order to clarify the DON distribution along milling, DON concentration in the feedings from all 2
rolls and purifiers were determined and summarized in Table 4. BR2 corresponds to meal fraction 3
obtained after the two first break rolls, BR3 to BR5 are the feedings corresponding to the following 4
break rolls, SP1 to SP6 are the feedings from the first to the sixth purifiers and RR1 to RR4 are the 5
feedings from the first to the fourth reduction rolls (Figure 1). 6
7
Table 4
8 9
The DON concentration in the feedings from each roll and purifier and the corresponding 10
obtained fraction (semolina or flours) could thus be compared: SP1 to SP6, BR2 to BR5 and RR1 to 11
RR4 with respectively SE1 to SE6, BF2 to BF5 and RF1 to RF4 as reported in Table 2. If DON 12
concentration in semolina was always found lower than those of the corresponding feedings 13
(ranging from identical to two or three-fold less concentrated), the ratio between break and 14
reduction flours and the corresponding feedings decreased from the first to the last step of the 15
milling process. Indeed, the DON concentrations were found to be 1.5 to 3-fold higher in the first 16
break and reduction flours compared to the corresponding feedings. Thus, at the first breaking and 17
reduction steps of the milling process, DON appeared to be concentrated in the flours, i.e. particles 18
with the smallest size. 19
20
Table 5
21 22
In order to test the hypothesis that grain breaking or endosperm reduction at the first milling steps 23
could lead to a preferential DON concentration in the finest fractions, the semolina SE3 and SE1 24
(originating from the most internal part of the grain) from sample A2 were sifted. Comparison 25 1 2 3 4 5 6 7 8 9 10 11 12 13 14 15 16 17 18 19 20 21 22 23 24 25 26 27 28 29 30 31 32 33 34 35 36 37 38 39 40 41 42 43 44 45 46 47 48 49 50 51 52 53 54 55 56 57 58 59 60
For Peer Review Only
between dry mass of the sifted semolina and their respective DON concentration showed that the 1
highest DON concentration occurred in the finest fractions (Table 5, a1, b1). 2
Each semolina was then ground, after removal of the finest particles (i.e. particles under 315 µm 3
for SE3 which accounted for 4 % of the semolina dry mass and displayed a DON concentration of 4
3358 µg.kg-1; particles under 450 µm for SE1 which accounted for 26 % of the semolina dry mass
5
and displayed a DON concentration of 4151 µg.kg-1). The resulting grinded material was classified 6
by size in order to analyze the DON concentration and distribution in each of the obtained fractions. 7
Table 5 (a2, b2) clearly shows that DON concentration was again higher (3 to 5 fold) in the fraction 8
characterized by the finest particle size. 9
Moreover, analysis of the DON amount distribution after semolina grinding and sizing compared 10
to those of the dry mass showed that DON amount in the largest size fractions was less than a half 11
the amount expected if DON was equally distributed in the material. In contrast, fractions 12
corresponding to the smallest particles concentrated the toxin with an about two fold factor 13
compared to the expected level. 14
Therefore, absence of relationships between DON contamination of flours and semolina and the 15
ash and phytic acid contents, as well as evidence of DON concentration in the finest particles from 16
the endosperm (Table 5) could explain the unexpected distribution of DON in the milling fractions. 17
It thus revealed that contamination of semolina or flours could not only be originated from the grain 18
outer layers but also from other contaminated parts of the grain that were shown to be friable. It 19
appeared particularly significant for grains containing a high level of mycotoxin and for fractions 20
coming out from the first steps of the process. Thus, higher DON level in the finest particles from 21
the semolina fraction of the most infected wheat sample could result from a deeper fungi 22
penetration in grains or a higher damage of the grain internal structure due to an increased synthesis 23
of hydrolytic enzymes, that are known to be produced by Fusarium (Jackowiak et al 2005). 24
However, further works are needed to test this hypothesis and examine if it is also observed for 25
other durum wheat cultivars. Nevertheless, these studies point out the interest to control the 26 1 2 3 4 5 6 7 8 9 10 11 12 13 14 15 16 17 18 19 20 21 22 23 24 25 26 27 28 29 30 31 32 33 34 35 36 37 38 39 40 41 42 43 44 45 46 47 48 49 50 51 52 53 54 55 56 57 58 59 60
For Peer Review Only
generation and distribution of the finest particles during milling, in order to lower the DON amount 1
in semolina. This could be potentially achieved by improving the sizing efficiency of the sifters 2
after the two first break rolls or by increasing the efficiency of the first two sizing purifiers in order 3
to better eliminate the finest particles at the first milling steps even if this will results in a decrease 4
of the semolina yield. Indeed as semolina are the fractions used for pasta making, this control could 5
constitute a key factor in order to reduce the DON level in corresponding consumed wheat products. 6
7
Acknowledgments
8
Authors would like to thank G. Maraval (INRA, Montpellier), C. Ducos and L. Pinson-Gadais 9
(INRA, Bordeaux) for their technical assistance and advices. This work was financially supported 10
by the European Commission through MYCOTOX project (ICA4-CT-2002-10043), the French 11
Ministry for Research through RARE project and the Chilean MECESUP 0202 and University of 12
Concepción (G. Rios grant). 13 14 15 1 2 3 4 5 6 7 8 9 10 11 12 13 14 15 16 17 18 19 20 21 22 23 24 25 26 27 28 29 30 31 32 33 34 35 36 37 38 39 40 41 42 43 44 45 46 47 48 49 50 51 52 53 54 55 56 57 58 59 60
For Peer Review Only
References1
AACC. 2000. Approved Methods. 10th ed. Minnesota (US): American Association of Cereal 2
Chemists. 3
Bai GH, Plattner R, Desjardins A, Kolb F. 2001. Resistance to Fusarium head blight and 4
deoxynivalenol accumulation in wheat. Plant Breeding. 120: 1-6. 5
Bennett JW, Klich M. T. 2003. Mycotoxins. Clin. Microbiol. Rev. 16: 497-516. 6
Bottalico A, Perrone G. 2002. Toxigenic Fusarium species and mycotoxins associated with head 7
blight in small-grain cereals in Europe. Eur. J. Plant Pathol. 108: 611-624. 8
Champeil A, Doré T, Fourbet JF. 2004. Fusarium head blight: epidemiological origin of the effects 9
of cultural practices on head blight attacks and the production of mycotoxins by Fusarium in 10
wheat grains. Plant Sci. 166: 1389-1415. 11
Chaurand M, Lempereur I, Roulland TM, Autran JC, Abecassis J. 1999. Genetic and agronomic 12
effects on semolina milling value of durum wheat. Crop Sci. 39: 790-795. 13
Dexter JE, Marchylo BA, Clear RM, Clarke JM. 1997. Effect of Fusarium head blight on semolina 14
milling and pasta-making quality of durum wheat. Cereal Chem. 74: 519-525. 15
Edwards SG. 2004. Influence of agricultural practices on Fusarium infection of cereals and 16
subsequent contamination of grain by trichothecene mycotoxins. Toxicol. Lett. 153: 29-35. 17
Gervais L, Dedryver F, Morlais JY, Bodusseau V, Negre S, Bilous M, Groos C, Trottet M. 2003. 18
Mapping of quantitative trait loci for field resistance to Fusarium head blight in an European 19
winter wheat. Theor. Appl. Genet. 106: 961-970. 20
Goswami RS, Kistler HC. 2004. Heading for disaster: Fusarium graminearum on cereal crops. Mol. 21
Plant Pathol. 5: 515-525. 22
Greffeuille V, Abecassis J, Bar Lhelgouach C, Lullien-Pellerin V. 2005. Differences in the aleurone 23
layer fate between hard and soft common wheats at grain miling. Cereal Chem. 82: 138-143. 24
Jackowiak H, Packa D, Wiwart M, Perkowski J. 2005. Scanning electron microscopy of Fusarium 25
damaged kernels of spring wheat. Int. J. of Food Microbiol. 98: 113-123. 26 1 2 3 4 5 6 7 8 9 10 11 12 13 14 15 16 17 18 19 20 21 22 23 24 25 26 27 28 29 30 31 32 33 34 35 36 37 38 39 40 41 42 43 44 45 46 47 48 49 50 51 52 53 54 55 56 57 58 59 60
For Peer Review Only
Jiang G-L, Dong Y, Shi J, Ward RW. 2007. QTL analysis of resistance to Fusarium head blight in 1
the novel wheat germplasm CJ 9306. II. Resistance to deoxynivalenol accumulation and grain 2
yield loss. Theor. Appl Genet. 115: 1043-1052. 3
Kang Z, Buchenauer H. 1999. Immunocytochemical localization of fusarium toxins in infected 4
wheat spikes by Fusarium culmorum. Physiol. and Mol. Plant Pathol. 55: 275-288. 5
Koch HJ, Pringas C, Maerlaender B. 2006. Evaluation of environmental and management effects on 6
Fusarium head blight infection and deoxynivalenol concentration in the grain of winter wheat.
7
Europ. J. of Agron. 24: 357-366. 8
Latta M, Eskin M. 1980. A simple and rapid colorimetric method for phytate determination. J. 9
Agric. Food Chem. 28: 1313-1315. 10
Manthey FA, Wolf-Hall CE, Yalla S, Vijayakumar C, Carlson D. 2004. Microbial loads, 11
mycotoxins, and quality of durum wheat from the 2001 harvest of the Northern Plains region of 12
the United States. J. Food Prot. 67: 772-780. 13
McKeehen JD, Busch RB, Fulcher RG. 1999. Evaluation of wheat (Triticum aestivum L.) phenolic 14
acids during grain development and their contribution to Fusarium resistance. J. Agric. Food 15
Chem. 47: 1476-1482. 16
Niessen ML, Vogel RF. 1998. Group specific PCR-detection of potential trichothecene producing 17
Fusarium species in pure cultures and cereal samples. Syst. Appl. Microbiol. 21: 618 - 31. 18
Nowicki TW, Gaba DG, Dexter JE, Matsuo RR, Clear RM. 1988. Retention of the Fusarium 19
mycotoxin deoxynivalenol in wheat during processing and cooking of spaghetti and noodles. J. 20
Cereal Sci. 8: 189–202. 21
Parry DW, Jenkinson P, McLeod L. 1995. Fusarium ear blight (scab) in small grain cereals, a 22
review. Plant Pathol. 44: 207-238. 23
Pestka JJ. 2007. Deoxynivalenol: Toxicity, mechanisms and animal health risks. Anim. Feed Sci. 24
and Technol. 137: 283-298. 25
Pinson-Gadais L, Barreau C, Chaurand M, Gregoire S, Monmarson M, Richard-Forget F. 2007. 26 1 2 3 4 5 6 7 8 9 10 11 12 13 14 15 16 17 18 19 20 21 22 23 24 25 26 27 28 29 30 31 32 33 34 35 36 37 38 39 40 41 42 43 44 45 46 47 48 49 50 51 52 53 54 55 56 57 58 59 60
For Peer Review Only
Distribution of toxinogenic Fusarium spp. and mycotoxin production in milling fractions of 1
durum wheat. Food Additiv. and Contam. 24: 53-62. 2
Seitz LM, Yamazaki WT, Clements RL, Mohr HE, Andrews L. 1985. Distribution of 3
deoxynivalenol in soft wheat mill streams. Cereal Chem. 62: 467-469. 4
Vaintraub IA, Lapteva NA. 1988. Colorimetric determination of phytate in unpurified extracts of 5
seeds and the products of their processing. Anal. Biochem. 175: 227-230. 6
Visconti A, Haidukowski EM, Pascale M, Silvestris M. 2004. Reduction of deoxynivalenol during 7
durum wheat processing and spaghetti cooking. Toxicol. Lett. 153: 181-189. 8 9 10 11 12 13 14 15 16 17 18 19 20 21 22 1 2 3 4 5 6 7 8 9 10 11 12 13 14 15 16 17 18 19 20 21 22 23 24 25 26 27 28 29 30 31 32 33 34 35 36 37 38 39 40 41 42 43 44 45 46 47 48 49 50 51 52 53 54 55 56 57 58 59 60
For Peer Review Only
Figure captions1 2
Figure 1: Milling diagram of the semi industrial pilot mill (INRA, Montpellier). BR1 to BR5 are
3
feedings of break rolls, BF2 to BF5 are corresponding break flours, SP1 to SP6 are feedings of 4
purifiers, SE1 to SE6 are semolina; RR1 to RR4 are feedings of reduction rolls, RF1 to RF4 are 5
reduction flours, CB, PFB and SFB are respectively coarse bran, purified fine bran and sized fine 6
bran, SH are shorts. 7
8
Figure 2: Comparison of DON (mg.kg-1 d. m.) and ash (% d. m.) concentration in the milling
9
fractions (except brans and shorts) from the two durum wheat samples (means of two replicates). 10
11
Figure 3 : Detection of TCT-producing fungi in grains and milling fractions from durum wheat
12
Acalou samples A1 and A2 after PCR with primers derived from the gene encoding trichodiene
13
synthase. F. graminearum corresponds to DNA extracted from the fungus. ST are total semolina, 14
SE1 and SE3 are semolina from the most inner part of the endosperm, BF2 are the first break flours, 15
RF1 are the first reduction flours, CB, SH, SFB and PFB are respectively coarse bran, shorts, sized 16
fine bran and purified fine bran. 17 18 19 20 21 22 23 24 25 26 27 28 29 30 1 2 3 4 5 6 7 8 9 10 11 12 13 14 15 16 17 18 19 20 21 22 23 24 25 26 27 28 29 30 31 32 33 34 35 36 37 38 39 40 41 42 43 44 45 46 47 48 49 50 51 52 53 54 55 56 57 58 59 60
For Peer Review Only
1 2 3 4 5 6 7 8 9 10 11 12 13 14 15 16 17 18 19 20 21 22 23 24 25 26 27 28 29 30 31 32 33 34 35 36 37 38 39 40 41 42 43 44 45 46 47 48 49 50 51 52 53 54 55 56 57 58 59 60For Peer Review Only
0 1 2 3 4 5 6 7 8 S E 1 S E 2 S E 3 S E 4 S E 5 S E 6 B F 2 B F 3 B F 4 B F 5 R F 1 R F 2 R F 3 R F 4Milling fractions (Semolina and Flours)
a m o u n t/ d ry m a tt e r DON (mg kg ) Ash% A2 -1 0.0 0.5 1.0 1.5 2.0 2.5 3.0 3.5 4.0 S E 1 S E 2 S E 3 S E 4 S E 5 S E 6 B F 2 B F 3 B F 4 B F 5 R F 1 R F 2 R F 3 R F 4
Milling fractions (Semolina and Flours)
a m o u n t/ d ry m a tt e r DON (mg kg ) Ash% A1 -1 1 2 3 4 5 6 7 8 9 10 11 12 13 14 15 16 17 18 19 20 21 22 23 24 25 26 27 28 29 30 31 32 33 34 35 36 37 38 39 40 41 42 43 44 45 46 47 48 49 50 51 52 53 54 55 56 57 58 59 60
For Peer Review Only
700 bp 600 bp 500 bp D N A la d d er G ra in s A 4 0 0 w it h o u t D N A F . g ra m in e ar u m G ra in s A 4 0 0 0 S T -A 4 0 0 S T -A 4 0 0 0 S E 3 – A 4 0 0 S E 3 – A 4 0 0 0 S E 1 -A 4 0 0 S E 1 – A 4 0 0 0 B F 2 – A 4 0 0 B F 2 – A 4 0 0 0 R F 1 – A 4 0 0 R F 1 – A 4 0 0 0 C B – A 4 0 0 C B – A 4 0 0 0 S H –A 4 0 0 S H – A 4 0 0 0 S F B – A 4 0 0 S F B – A 4 0 0 0 P F B – A 4 0 0 P F B – A 4 0 0 0 700 bp 600 bp 500 bp D N A la d d er G ra in s A 1 w it h o u t D N A F . g ra m in e ar u m G ra in s A 2 S T -A 1 S T -A 2 S E 3 – A 1 S E 3 – A 2 S E 1 -A 1 S E 1 – A 2 B F 2 – A 1 B F 2 – A 2 R F 1 – A 1 R F 1 – A 2 C B – A 1 C B – A 2 S H – A 1 S H – A 2 S F B – A 1 S F B – A 2 P F B – A 1 P F B – A 2 700 bp 600 bp 500 bp D N A la d d er G ra in s A 4 0 0 w it h o u t D N A F . g ra m in e ar u m G ra in s A 4 0 0 0 S T -A 4 0 0 S T -A 4 0 0 0 S E 3 – A 4 0 0 S E 3 – A 4 0 0 0 S E 1 -A 4 0 0 S E 1 – A 4 0 0 0 B F 2 – A 4 0 0 B F 2 – A 4 0 0 0 R F 1 – A 4 0 0 R F 1 – A 4 0 0 0 C B – A 4 0 0 C B – A 4 0 0 0 S H –A 4 0 0 S H – A 4 0 0 0 S F B – A 4 0 0 S F B – A 4 0 0 0 P F B – A 4 0 0 P F B – A 4 0 0 0 700 bp 600 bp 500 bp D N A la d d er G ra in s A 1 w it h o u t D N A F . g ra m in e ar u m G ra in s A 2 S T -A 1 S T -A 2 S E 3 – A 1 S E 3 – A 2 S E 1 -A 1 S E 1 – A 2 B F 2 – A 1 B F 2 – A 2 R F 1 – A 1 R F 1 – A 2 C B – A 1 C B – A 2 S H – A 1 S H – A 2 S F B – A 1 S F B – A 2 P F B – A 1 P F B – A 2 1 2 3 4 5 6 7 8 9 10 11 12 13 14 15 16 17 18 19 20 21 22 23 24 25 26 27 28 29 30 31 32 33 34 35 36 37 38 39 40 41 42 43 44 45 46 47 48 49 50 51 52 53 54 55 56 57 58 59 60For Peer Review Only
Table 1: Main physical characteristics and total DON concentration of the analyzed Acalou wheat samples naturally infected with Fusarium a.
Samples A1 A2 DON (µg.kg-1 d. m.) 382.0 ± 9.7 4203.5 ± 202.7 Test weight (kg.hL-1) 84.5 ± 0.1 84.3 ± 0.1 TKW (g) 52.0 ± 0.6 50.0 ± 0.7 Vitreousness (%) 95.3 95.3 PSI (%) 5.1 ± 0.1 5.3 ± 0.1 Water content (%) 12.16 ± 0.01 12.33 ± 0.02 a
Values are means and standard deviation of three replicates. 1 2 3 4 5 6 7 8 9 10 11 12 13 14 15 16 17 18 19 20 21 22 23 24 25 26 27 28 29 30 31 32 33 34 35 36 37 38 39 40 41 42 43 44 45 46 47 48 49 50 51 52 53 54 55 56 57 58 59 60
For Peer Review Only
Table 2: Yield and DON concentration in the different milling fractions from the two durum wheat samples.
A1 A2
Concentrations Concentrations
Milling Fractions Yield
a (% d. m.) DON b (µg.kg-1 d.m.) Ratio c Yielda (% d. m.) DON b (µg.kg-1 d.m.) Ratio c Semolina SE1 6.2 266 0.70 6.0 3497 0.83 SE2 26.0 260 0.68 25.3 3359 0.80 SE3 26.8 180 0.47 25.9 2600 0.62 SE4 10.5 139 0.36 10.5 2324 0.55 SE5 0.1 121 0.32 0.7 2440 0.58 SE6 6.8 230 0.60 7.5 3850 0.92 Total semolina 76.4 220 0.58 75.9 2940 0.70 Break flours BF2 0.7 707 1.85 0.4 7737 1.84 BF3 0.5 808 2.12 0.8 6206 1.48 BF4 1.0 618 1.62 1.0 5341 1.27 BF5 1.0 416 1.09 1.0 3208 0.76 Reduction flours RF1 1.1 431 1.13 1.1 5679 1.35 RF2 1.1 368 0.96 1.1 5239 1.25 RF3 0.5 300 0.79 0.6 3349 0.80 RF4 1.0 400 1.05 1.4 3601 0.86 Bran and Shorts SFB 0.7 575 1.51 0.7 5196 1.24 PFB 6.9 1146 3.00 7.2 10645 2.53 CB 7.7 1463 3.83 7.6 14416 3.43 SH 1.6 450 1.18 1.2 6091 1.45 a C. V. < 5 %. b
means of two replicates, C. V. < 5% for semolina and flours and < 10% for brans and shorts.
c
Ratio between DON concentrations in the analyzed fraction versus those in cleaned grains. 1 2 3 4 5 6 7 8 9 10 11 12 13 14 15 16 17 18 19 20 21 22 23 24 25 26 27 28 29 30 31 32 33 34 35 36 37 38 39 40 41 42 43 44 45 46 47 48 49 50 51 52 53 54 55 56 57 58 59 60
For Peer Review Only
Table 3: Comparison of yield and DON distribution in percent of the total grain mass or DON total content.
A1 A2
Milling Fractions Yield
a (% d.m.) DONb (% d.m.) Yielda (% d.m.) DONb (% d.m.) Total Semolina 76.4 40.8 75.9 49.6
Total Break Flours 3.2 4.8 3.3 3.7
Total Reduction Flours 3.7 3.5 4.2 4.1
Total Brans and Shorts 16.8 50.8 16.6 42.6
a
Total yield was obtained from Table 2.
b
calculated taking into account the fraction yield and DON concentration and expressed as a percentage of the total amount of DON in the sample.
1 2 3 4 5 6 7 8 9 10 11 12 13 14 15 16 17 18 19 20 21 22 23 24 25 26 27 28 29 30 31 32 33 34 35 36 37 38 39 40 41 42 43 44 45 46 47 48 49 50 51 52 53 54 55 56 57 58 59 60
For Peer Review Only
Table 4: DON concentration (µg.kg-1 d.m.) in the feedings of rolls and purifiers and ratio between DON concentrations in flours or semolina (reported in Table 2) versus those in the feedings.
a
means of two replicates, C. V. < 7%.
A1 A2
Fractions DONa Ratio DONa Ratio
Break roll feedings BR2 250 2.83 4891 1.58 BR3 369 2.19 5865 1.06 BR4 300 2.06 5946 0.90 BR5 594 0.70 8571 0.37 Sizing purifier feedings SP1 262 1.01 4476 0.78 SP2 352 0.74 4343 0.77 SP3 200 0.90 3563 0.73 SP4 201 0.69 3477 0.67 SP5 320 0.38 5747 0.42 SP6 349 0.66 4143 0.93 Reduction roll feedings RR1 242 1.78 2719 2.09 RR2 248 1.48 3450 1.52 RR3 401 0.75 3561 0.94 RR4 312 1.28 4640 0.78 1 2 3 4 5 6 7 8 9 10 11 12 13 14 15 16 17 18 19 20 21 22 23 24 25 26 27 28 29 30 31 32 33 34 35 36 37 38 39 40 41 42 43 44 45 46 47 48 49 50 51 52 53 54 55 56 57 58 59 60
For Peer Review Only
Table 5: Distribution in dry mass (% d.m.), DON concentration (µg.kg-1 d.m.)and DON distribution (%) in sieved fractions from semolina SE3 or SE1 of the wheat sample A2 before (a1, b1) and after (a2, b2) grinding. DON concentration of each analyzed fraction was
specified in brackets at the top of each table.
a1 a2 SE3 A2 (2600 µg.kg-1 d.m.) SE3 A2 (2300 µg.kg-1 d.m.) Sieve mesh size (mm) Dry mass (% d.m.) DON (µg.kg-1 d.m.) DON (%) Sieve mesh size (mm) Dry mass (% d.m.) DON (µg.kg-1 d.m.) DON (%) > 0.560 8 2089 7 > 0.200 26 967 11 0.560- 0.450 31 2285 28 0.100 - 0.200 28 1555 19 < 0.450 61 2716 66 < 0.100 43 3682 69 b1 b2 SE1 A2 (3496 µg.kg-1 d.m.) SE1 A2 (3189 µg.kg-1 d.m.) Sieve mesh size (mm) Dry mass (% d.m.) DON (µg.kg-1 d.m.) DON (%) Sieve mesh size (mm) Dry mass (% d.m.) DON (µg.kg-1 d.m.) DON (%) > 0.630 24 2418 18 > 0.315 31 1087 11 0.630 – 0.560 32 2956 29 0.160 - 0.315 30 1863 18 < 0.560 44 3912 53 < 0.160 39 5736 71 1 2 3 4 5 6 7 8 9 10 11 12 13 14 15 16 17 18 19 20 21 22 23 24 25 26 27 28 29 30 31 32 33 34 35 36 37 38 39 40 41 42 43 44 45 46 47 48 49 50 51 52 53 54 55 56 57 58 59 60