HAL Id: hal-02498101
https://hal.archives-ouvertes.fr/hal-02498101
Submitted on 6 Nov 2020
HAL is a multi-disciplinary open access
archive for the deposit and dissemination of
sci-entific research documents, whether they are
pub-lished or not. The documents may come from
teaching and research institutions in France or
abroad, or from public or private research centers.
L’archive ouverte pluridisciplinaire HAL, est
destinée au dépôt et à la diffusion de documents
scientifiques de niveau recherche, publiés ou non,
émanant des établissements d’enseignement et de
recherche français ou étrangers, des laboratoires
publics ou privés.
Jean-Pierre Bedimo Bedimo, François Colin, Armand Crabit, Alain Fezeu,
Cécile Llovel, Jules Remy Ndam Ngoupayou, et al.
To cite this version:
Camille Jourdan, Valérie Borrell-Estupina, David Sebag, Jean-Jacques Braun, Jean-Pierre Bedimo
Bedimo, et al.. A non-stationary model for reconstruction of historical annual runoff on tropical
catch-ments under increasing urbanization (Yaoundé, Cameroon). Hydrology and Earth System Sciences
Discussions, European Geosciences Union, 2019, pp.1-50. �10.5194/hess-2019-116�. �hal-02498101�
A non-stationary model for reconstruction of historical annual
1
runoff on tropical catchments under increasing urbanization
2
(Yaoundé, Cameroon)
3 4
Camille Jourdan1,2, Valérie Borrell-Estupina3, David Sebag4, Jean-Jacques Braun5,6, Jean-Pierre Bedimo
5
Bedimo6,†, François Colin2, Armand Crabit2, Alain Fezeu7, Cécile Llovel8, Jules Rémy Ndam Ngoupayou9,
6
Benjamin Ngounou Ngatcha10, Sandra Van-Exter11, Eric Servat1, Roger Moussa2
7
8
1 OSU OREME, Univ Montpellier, Montpellier, France
9
2 LISAH, Univ Montpellier, INRA, IRD, SupAgro, Montpellier, France
10
3 HSM, Univ Montpellier, CNRS, IRD, Montpellier, France
11
4 Normandie Univ, UNIROUEN, UNICAEN, CNRS, M2C, Rouen, France
12
5 GET, CNRS, IRD, University of Toulouse, Toulouse, France
13
6 Institut de Recherches Géologiques et Minières, Centre de Recherches Hydrologiques, Yaoundé, Cameroon
14
7 French National Research Institute for Development (IRD), Yaoundé, Cameroon
15
8 WSP France, Toulouse, France
16
9 Laboratoire de Géologie de l’ingénieur et d’Altérologie, Département des Sciences de la Terre et de l’Univers,
17
Faculté des Sciences, Université de Yaoundé I, BP 812, Yaoundé, Cameroun 18
10 Department of Earth Sciences, Faculty of Sciences, University of Ngaoundéré, Ngaoundere, Cameroon
19
11 GM, Univ Montpellier, CNRS, Université des Antilles, Montpellier, France
20
† deacesed
21
22
Correspondence: Camille Jourdan (camille.jourdan@umontpellier.fr)
23 24
Abstract. Inter-tropical regions are nowadays faced to major land-use changes in data-sparse context leading to
25
difficulties to assess hydrological signatures and their evolution. This work is part of the theme Panta Rhei of the 26
IAHS, and aims to develop a combined approach of data acquisition and a new semi-distributed model taking into 27
account land-use changes to reconstruct and predict annual runoff on an urban catchment. Applications were 28
conducted on the Mefou catchment at Nsimalen (421 km²; Yaoundé, Cameroon) under rapid increase in 29
urbanization since 1960. The data acquisition step combines an historical data processing and a short-term 30
spatially-dense dedicated instrumentation (2017-2018), leading to 12 donor catchments, 6 from historical studies 31
and 6 from the instrumentation presenting various topographic, soil and land-use characteristics. We developed an 32
annual rainfall-runoff model based on mathematical relationships similar to the SCS model. The model needs the 33
definition of a hydrological index I which is time variable and enables to take into account land-use changes and 34
non-stationary relationships between rainfall and runoff. The index I is an empirical indicator defined as a 35
combination of several components such as topography, soil, and land-use. The rules for the construction of I are 36
obtained from data analysis on donor catchments. Then, the model was calibrated on donor catchments. Finally, 37
two applications were conducted on eight target catchments composing the Mefou in order: i) to study the spatial 38
hydrological functioning and calculate the water balance during the short instrumentation period; ii) to reconstruct 39
the hydrograph at the Mefou and to simulate the impact of future scenarios of land-use and urbanization. Results 40
show that that the Mfoundi catchment, integrating the three more urbanized sub-catchments, contributes near to 41
40 % of the Mefou despite covering only 23 % of the basin. The most urbanized sub-catchments present annual 42
runoff coefficient about 0.86 against 0.24 for the most natural sub-catchments. The second result is the 43
reconstruction of historical annual runoff from 1930-2017 with r² = 0.68, RMSE = 99 mm and a mean absolute 44
normalized error 𝐸̅ = 14.5 % over the 29 observed years. The reconstruction of the annual runoff at Nsimalen 45
confirms the moderate impact of urbanization on annual runoff before 1980. However, a decrease of about 50 % 46
of the forest cover and an increase from 10 % to 35 % of the urban area between 1980 and 2017 are associated 47
with an increase of 53 % of annual runoff coefficient for the Mefou at Nsimalen (0.44 against 0.29). Application 48
for a fictive plausible scenario of urbanization in 2030 leads to an increase of more than 85 % of the annual runoff 49
in comparison of the values observed in 1980. The coupled experimental-modelling approach proposed herein 50
opens promising perspectives regarding the evaluation of the annual runoff in catchments under changes. 51
52 53
1 Introduction
54
The link between the hydrological cycle and human societies has been strong with changes and 55
intensification of these interactions over time (Koutsoyiannis, 2013; McMillan et al., 2016). In response to the 56
imperative to include human increasing impacts as integral to hydrological research, the International Association 57
of Hydrological Sciences (IAHS) launched the hydrological decade (2013-2022) with theme “Panta Rhei: Change 58
in Hydrology and Society”. Due to rapid and complex anthropic changes, the IAHS emphasize the necessity to
59
improve the capability of decision maker and water resources stakeholders to make predictions of hydrological 60
dynamics and support sustainable societal development in a changing environment (Montanari et al., 2013). 61
Quantifying and understanding past changes in hydrological processes are necessary to suggest reliable future 62
predictions of hydrological signatures. Reconstructing past data and predicting annual, monthly and daily 63
hydrographs in a changing environment, and especially on poorly gauged catchments with sparse data, remains a 64
challenge for hydrological science. 65
Long-term hydrological modelling requires integrating the impact of global changes in terms of climate, 66
land-use and infrastructures. Nowadays, urban areas represent only 2 % of the total surface of the Earth but 67
concentrate more than 50 % of world population, cities count close to four billions people, this figure was 68
multiplied by five since 1950 (Janicot et al., 2015). This huge urbanization rate combined with a demographic 69
explosion is especially significant in the inter-tropical regions where most of developing countries and numerous 70
in development megalopolis are located (UNDESA, 2017). For example, population in Africa is projected to reach 71
2.5 billion people by 2050 with about 55 % living in urban areas (Güneralp et al., 2017). Hence in this context, 72
the impact of land-use changes on runoff, especially in urban and peri-urban zones, seems to override rainfall 73
changes impacts. 74
Empirical, conceptual, probabilistic and physically-based models can be used to simulate the impact on 75
runoff of global changes. Conceptual models such as HBV (Bergström and Singh, 1995), GR1A, GR2M or GR5J 76
(Mouelhi, 2003; Mouelhi et al., 2006; Le Moine, 2008) or physically-based models as MIKE-SHE 77
(Abbott et al., 1986) were applied to assess global changes impacts on hydrology. On tropical climate, such models 78
were applied at the local scale (Giertz et al., 2006), the mesoscale (Beck et al., 2013; Wagner et al., 2013; 79
Yira et al., 2016) or large scale catchments (Genwei, 1999; Zhou et al., 2010) at daily, monthly or annual time 80
steps. All these models require accurate information about the basin physiographic characteristics, long series of 81
rainfall-runoff data, climate and land-use changes data; moreover an adequate calibration/validation strategy must 82
be undertaken in order to take into account the spatio-temporal evolution of some parameters. However, on basins 83
with sparse data at various time steps (e.g. only monthly rainfall available on a given period), and in the absence 84
of continuous long series rainfall-runoff data, simple modelling approaches must be adapted for reconstructing 85
annual runoff taking into account available sparse historical data and information on climate and land-use changes. 86
For that, empirical approaches in non-dimensional spaces were largely used since Turc (1954) and Budyko (1974) 87
which were largely applied, analysed and extended the last decade (Zhou et al., 2015; see a synthesis 88
in Moussa and Lhomme, 2016). Ponce and Shetty (1995) developed an original annual rainfall-runoff model based 89
on a formulation similar to the one developed in the Soil Conservation Service method (SCS, 1956; 90
Mishra and Singh, 2013), and Sivapalan et al. (2011) extended this approach to model different components of the 91
water cycle at the annual scale. However, all these models generally don’t take into account changes in climate 92
and land-use. Hence, there is a need to develop simple parsimonious approaches modelling for annual runoff taking 93
into account non-stationarity due to land-use long term evolution, and adapted to basins with sparse data. 94
In most of developing countries, environmental monitoring as precipitation and streamflow are often limited. 95
This data-sparse condition results of a poor knowledge of basin climatology and hydrological signatures, such as 96
annual runoff. Even for areas faced with recurring high water management issues, most of national organizations 97
do not have resources to purchase and maintain the necessary instrumentation for field monitoring 98
(Hughes et al., 2015). The availability of continuous and long term data sets of runoff varies dramatically 99
throughout the world (Kundzewicz et al., 2007). Prediction in ungauged basins (PUB) approaches are tools to cope 100
with this data-sparse context (Blöschl, 2013) and are based on regionalization of hydrological characteristics by 101
spatial proximity or geomorphological similarities from donor to target catchments (Parajka et al., 2013; Salinas 102
et al., 2013). However, recently development of soft monitoring (Crabit et al., 2011) and crowdsourced hydrology 103
(Lowry and Fienen, 2013; Le Coz et al., 2016; Mazzoleni et al., 2017) gave encouraging results. To cope with the 104
lack of long-term observation (rainfall-runoff) on catchment faced to land-use changes a solution is to set up a 105
dedicated short-term instrumentation on catchment faced to various land-use states associated with a best 106
valorisation of historical database. This methodology lets to observe hydrological processes of catchments 107
characterized by various states of land-use and under various climatic contexts. 108
The scope of this paper is to develop a combined approach of data acquisition and the development of a new 109
semi-distributed model taking into account land-use changes to reconstruct and predict annual runoff on a 110
catchment exposed to high urban increase. The data acquisition step implies (1) to deploy a complementary and 111
dedicated short-term and multi-scale space hydro-meteorological network, (2) to analyse the most recent global 112
land-use products with adapted time and space resolution and (3) to maximize the valorisation of historical studies 113
for the evaluation of catchment characteristics (land-use, topography, soils map) and some environment variables 114
(evaporation, precipitation, runoff). The model developed from the data acquisition is mainly based on land-use 115
changes impacts on annual runoff. 116
The Mefou catchment (421 km²) including the city of Yaoundé capital of Cameroon was used for applications 117
to reconstruct the annual runoff at the outlet for the period 1930-2017. A dedicated hydrological instrumentation 118
during the hydrological year 2017-2018 was conducted, and completes the review of historical studies over the 119
period 1960-2016. 120
First, we introduce the annual non-stationary rainfall-runoff model structure, hypotheses and general 121
calibration-validation procedure. The inputs of the model are the annual precipitation and an hydrologic index 122
taking into account topography, soil and land-use temporal evolution. Second, we describe the study area including 123
the review of historical hydro-meteorological data and a description of the dedicated short-terms instrumentation. 124
Third, we present a spatio-temporal analysis of precipitation. Fourth, we present the methodology to construct the 125
hydrological index from the analysis of hydrologic and physiographic data. Then, we present the model 126
parametrization, calibration and validation, and finally we show and discuss the application results of 127
reconstruction and prediction of historical annual runoff. The Appendix A gives the list of notations and 128
abbreviations. The Supplementary Material gives additional information on data sets. 129
2 The annual rainfall-runoff model
131
2.1 Model structure
132
The model is based on mathematical relationship between precipitation P and runoff R similar that proposed 133
by Ponce and Shetty (1995) and Sivapalan et al. (2011) for applications at the annual scale on the basis of the SCS 134
equations (Mishra and Singh, 2003). P ranges between Pn and Px which respectively correspond to the minimal
135
and the maximal precipitation values over a large historical period of the main study catchment. Applications were 136
conducted in tropical basins where R is not nil. Therefore, in order to simplify, we use a simple second order 137
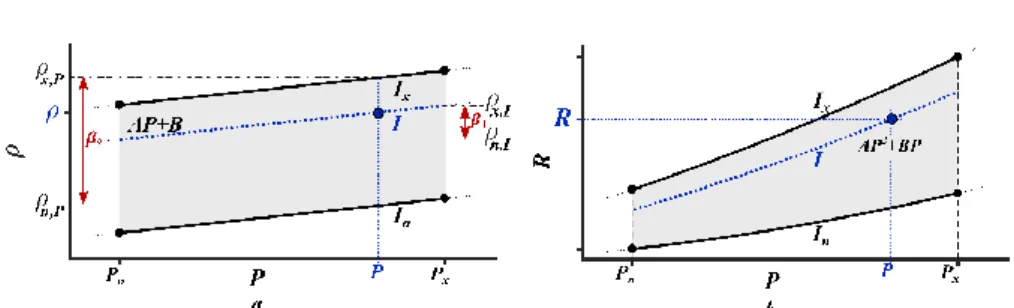
polynomial relationship between R and P such as (Fig.1): 138
R = P² + P, (1)
139
and the annual runoff coefficient: 140
R/P = P + , (2)
141
where and are empirical parameters which can be linked to catchment properties (e.g. topography, soil, land-142
use). 143
The first hypothesis is that the annual volume VO at the outlet of the main catchment is the sum of the annual
144
volumes Vi on each sub-catchment Ti (Fig. 2b):
145
𝑉𝑂= ∑𝑛𝑖=1𝑉𝑖 , (3)
146
where n is the number of sub-catchments and i is the index representing a sub-catchment noted Ti. We define the
147
annual runoff Ri on each sub-catchment Ti as:
148
Ri =𝑉𝑖 𝐴
𝑖
⁄ , (4)
149
where Ai is the area of Ti and AO is the area of the whole catchment with:
150
𝐴𝑂= ∑𝑛𝑖=1𝐴𝑖 , (5)
151
Consequently the annual runoff RO of the whole catchment is defined as:
152
𝑅𝑂= 𝑉𝑜 𝐴 0
⁄ . (6)
153
The second hypothesis presumes that the runoff coefficient R / P and the annual runoff R are only 154
functions of P and an “hydrological index” noted I with fP, I) and R = g(P, I) similar to the SCS approach 155
used in Ponce and Shetty (1995) and Sivapalan et al. (2011). As for the curve numbers CN in the Soil Conservation 156
Service method (Mishra and Singh, 2003), the index I characterizes topography, soil and land-use of the basin, 157
and enables to take into account land-use evolution through time: I is considered low for permeable soils and/or 158
low urbanization areas producing low runoff, and I is considered high for impermeable soils and/or high 159
urbanization areas producing high runoff. The index I is an empirical indicator and can be defined as a linear 160
combination of several components Ci. As for the CN method, in this study we choose the following three
161
components: topographic component (CT) such as slope classes impacting runoff, and soil component (CS) such
162
as permeability classes and land-use component (CLC) such as urbanization classes.
𝐼 = ∑𝑚𝑖=1𝜔𝑖𝐶𝑖
,
(7)164
where i is the weight attributed to component i and m the number of components including in the hydrological
165
index. If m is equal to 1, the hydrological index I is based on only one component, for example the land-use 166
characteristics (CLC) if this descriptor is considered as the main factor changing in time.
167
We note In and Ix respectively the lowest and the highest values of I over the catchment dataset used to
168
construct the model. Therefore, for a given rainfall P, R increases when I increases; for a given index I, R increases 169
when P increases. 170
For a given value of I the runoff coefficient increases when the rainfall increases from Pn to Px. Let n,I and
171
x,I be the corresponding values of for Pn and Px respectively. Let 1 = x,I - n,I as shown in Fig. 1a. For a given
172
value of P, the runoff coefficient increases when I increases from In to Ix. Let n,P and x,P be the corresponding
173
values of for In and Ix respectively. Let 2 = x,P - n,P as shown in Fig. 1a. As we have a linear relationship
174
between P and Fig. 1a, the value of 2 is constant and similar for all values of P. In order to calculate 2, we
175
need data on different catchments and periods with the same value of P but with different values of I ranging 176
between In and Ix.
177
The annual runoff model proposed herein uses a simple relationship R = f(P, I) as shown in Fig. 1b. The 178
domain of application of the model is for the precipitation P ∈ [Pn, Px] and the hydrological index I ∈ [In, Ix]. The
179
model needs as input the precipitation P which has to be calculated on each sub-catchment Ti (see an application
180
in Sect. 4). The model needs also the definition of the hydrological index I which is time variable and enables to 181
take into account land-use changes and non-stationary relationships between R and P. The definition of the rules 182
to construct the components Ci and the weights i of I (Eq. 7) are obtained from data analysis on the study site as
183
shown later in Sect. 5. 184
185
2.2 Calibration, validation, reconstruction procedure
186
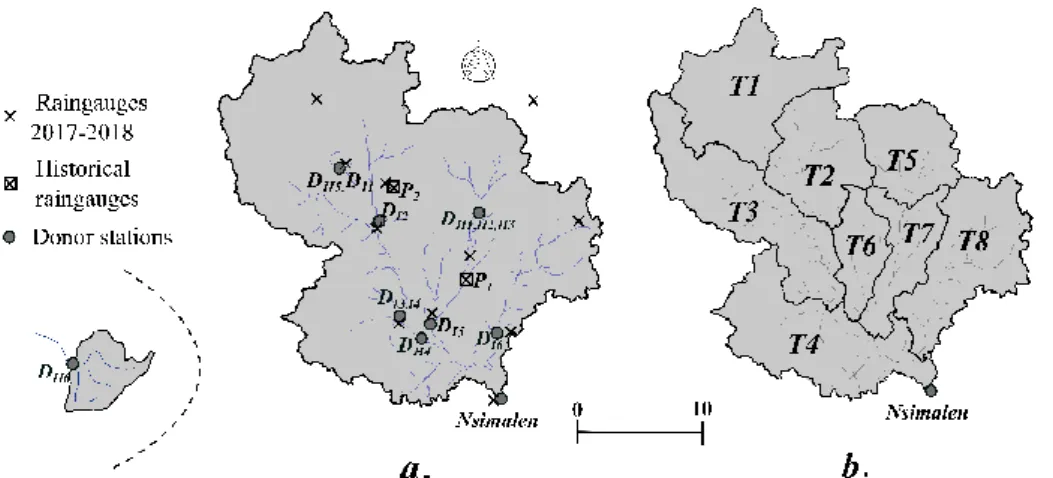
The annual rainfall-runoff model developed herein is calibrated using data from donor catchments (noted D) 187
historical information, and from the dedicated short-term instrumentation. Donors could be catchments or sub-188
catchments inside or near to the main study catchment (Fig. 2a). Sets of annual precipitation P and annual runoff 189
R data are available for donors characterized by different geomorphologic and land-use states (e.g. topography,
190
soil, urbanization). Selecting distant past, recent past and present in P and R values from donors enable to cover a 191
large range of climate, land-use and geomorphological conditions in order to elaborate a reliable and robust model. 192
Donors are used to calibrate the model parameters then the calibrated model is applied on target catchments (noted 193
T, Fig. 2b) and let to evaluate runoff for the main catchment (Eq. 3 to 6). The model can be applied for several
194
periods (past, present and future) for different climate and land-use scenarios. 195
We consider the set of sparse annual rainfall-runoff data. The set is split into two datasets, the first one is 196
used for the calibration of the model parameters and the second one for the validation. The dataset used for the 197
calibration must include data from different ranges of precipitation Pn < P < Px and land-use characterized by the
hydrological index In < I < Ix. The RMSE, the r², the normalised error (E) and the mean normalised absolute error
199
(𝐸̅) criteria functions are used to assess and compare simulation performance: 200 𝑅𝑀𝑆𝐸 = √1 𝑛∑ (𝑅̂𝑂𝑗− 𝑅𝑂𝑗) 2
,
(8) 201 𝑟2=[∑(𝑅̂𝑂𝑗−𝑅̂ )(𝑅𝑂 𝑂𝑗−𝑅̅̅̅̅)]𝑂 2 ∑(𝑅𝑂𝑗−𝑅𝑂) 2,
(9) 202 𝐸𝑗= 𝑅̂𝑂𝑗−𝑅𝑂𝑗 𝑅𝑂𝑗 , and 𝐸𝑖,𝑗= 𝑅̂𝑖,𝑗−𝑅𝑖,𝑗 𝑅𝑖,𝑗,
(10) 203 𝐸̅ =1 𝑛∑(|𝐸𝑗|),
(11) 204where 𝑅̂𝑂𝑗 is the simulated annual runoff and 𝑅𝑂 j the observed annual runoff for the main study catchment; n the
205
number of the evaluated year and j the index corresponding to a given year. 𝑅̂𝑖,𝑗 is the simulated annual runoff for
206
target i for the evaluated year j and Ri,j the observed annual for target i for the evaluated year j. In order to evaluate 207
the robustness of the model, a sensitivity analysis is conducted on the impact of the number of donor catchments 208
used establishing the rules of the hydrologic index I. Finally, the performance of the developed model is compared 209
to a classical annual runoff model generally applied under stationary conditions (i.e. the GR1A model based on the 210
Turc (1954) equation; Mouelhi, 2003). 211
212 213
3 Study site
214
3.1 Oro-hydrography and climate
215
The Mefou River is a tributary of the Nyong. The Mefou catchment at Nsimalen (421 km²) includes the 216
capital city of Cameroon, Yaoundé (Fig. 3a).The upstream part of the basin (70 km²) is controlled by the Mopfou 217
dam built in 1969 planned to provide about one third of the drinking water to the Yaoundé urban area 218
(100,000 m3.day-1).
219
The catchment is hilly (peaks at 1000 m a.s.l) with important wetland areas (around 700 m a.s.l) at the 220
downstream parts (Fig. 3a). The Mefou River is 35 km length from the Mopfou dam to Nsimalen. The main 221
tributaries of the Mefou is the Mfoundi which drains the most urbanized parts of the whole catchment (Fig. 3a). 222
The river channel slope ranges between 1 ‰ and 5 ‰ causing frequent floods in the lowlands. Canalization of the 223
upstream Mfoundi and its tributaries were undertaken since 2002 in order to reduce floods in the urbanized zone. 224
The landform of the South Cameroon Plateau corresponds to the dismantling of an old iron crust undergoing more 225
humid climatic conditions (Bilong et al., 1992; Beauvais, 1999; Bitom et al., 2004). This multi-convex landform 226
is composed of rather closely spaced hilly compartments, typically of few hundred metres in diameter, separated 227
by flat swampy valleys of variable stretch from 50 to 500 m width (Bitom et al., 2004). We used the slope index 228
SI of Roche (Roche, 1963) to characterize the topography component of the hydrological index I for donor and
229
target catchments. 230
The climate is humid tropical with two dry and wet seasons (wet-and-dry equatorial savannah with dry winter 231
according to the Köppen-Geiger classification, Kottek et al., 2006). The mean annual precipitation Pm from Mvan
station (P1) in Yaoundé on the period 1930-2015 is 1580 mm. We distinguish four seasons: long rainy season from
233
March to June, short dry season from July to August, short rainy season from September to November, and long 234
dry season from December to February. The hydrological year is defined from March to February. Ikounga (1978) 235
has estimated the potential evapotranspiration PET between 900 mm (Sunken Colorado pan) to 1200 mm 236
(Thornthwaite method). Supplementary Material (Sect. 2, Fig. S1) shows the mean monthly precipitation, 237
temperature and PET. 238
239
3.2 Soil and land-use
240
The regolith is developed on a granito-gneissic basement. Ferralsol (laterite) regolith is developed on the 241
hillslopes while in the swampy valleys, it is topped with bleached hydromorphic soils developed on colluvium and 242
river alluvium (Bachelier, 1959; Braun et al., 2005; Braun et al., 2012). In the region of Yaoundé, 243
Humbel and Pellier (1969) calculated a soil surface permeability between 20 and 70 cm.h-1 up the hill, and 200
244
cm.h-1 near the swampy valleys. These values of permeability are very high and limit the surface runoff, especially
245
in swampy valleys. The clay amount is generally higher at the top of the hills than at the bottom. In the field 246
experiment we conducted in 2017, we measured in the region of Yaoundé the soil surface permeability by a 247
simplified Beerkan method (Bagarello et al., 2014) and obtained values ranging between 2 and 125 cm.h-1 which
248
are comparable to the values given by Humbel and Pellier (1969). Humbel and Pellier (1969) also showed that for 249
both types of soil, the surface permeability decreases quickly with the depth until an impermeable layer facilitating 250
lateral flow. In this study we use the proportion of hydromorphic soil (HS) to characterize the soil component of 251
the hydrological index I for donor and target catchments (see Sect. 5.1). 252
The administrative urban area of Urban Community of Yaoundé (CUY) covers nowadays about 297 km². As 253
most part of the Nyong basin (Olivry, 1979), the Mefou catchment was originally mainly covered by humid tropical 254
forest. The study area is faced to major land-use changes due to human activities mainly urbanization and 255
agriculture (see more details in Supplementary Material, Sect. 3). Population in Yaoundé has increased from 256
90,000 in 1960 (Franqueville, 1968) to 3.65 million in 2017 (UNDESA, 2017) with an annual growth rate of 5.7 % 257
per year between 1987 and 2005 according to the Central Office of Cameroonian Population Study and Census. 258
This huge demographic change is characterized by an important expansion of the urban area Fig. 3b and the 259
increase of population density (Bopda, 2003). In the opposite, forest and wetlands areas decreased, and were 260
generally replaced by agricultural and urban areas as shown in Fig. 3c with the land-use classification over the 261
Mefou catchment from the land cover product of the European Space Agency available for Africa (ESA-CCI LC) 262
for the year 2016. Moffo (2017) analysed a set of aerial photography in 1956 and estimated that the impervious 263
areas covered 3.5 km², less than 1 % of the Mefou catchment area. We used ESA-CCI LC and OpenStreetMap® 264
2015 layers to calculate impervious areas of around 64 km² (15 %) in 2016. Ebodé (2017) used Landsat images to 265
study the evolution of land-use from 1978 to 2015. He noticed at the Mefou catchment until the Nyong confluence 266
(basin area of 802 km², approximately two times the Mefou basin area at Nsimalen) a decrease of 160 km² of the 267
total forest cover, with specifically a decrease of 60 % of the primary forest area from 235 km² in 1978 to 94 km² 268
in 2015, a decrease of 73 % for swampy forest from 206 km² to 57 km², and an increase of 60 % in degraded and 269
secondary forest from 223 km² to 353 km². For the Mefou at Nsimalen, Ebodé (2017) estimated that the agricultural 270
area increased from 10 km² (3.5 % of the catchment area) in 1978 to 28 km² (10 %) in 2015, and that the urban 271
area (integrating impervious surfaces) increased from 45 km² (11 %) in 1978 to 151 km² (36 %) in 2015. We used 272
the proportion of urban area U over donor and target catchments to characterize the land-use component of the 273
hydrological index. 274
The impact of these land-use changes on hydrological processes is not yet quantified on the Mefou 275
catchment. The urbanization of the Mefou catchment also impacts both groundwater and river water quality due 276
to domestic and industrial untreated wastewater from urban areas but also contamination by peri-urban agriculture. 277
For example, Branchet et al. (2018) recently shows high Diuron® concentration on surface water that frequently 278
exceeded the European water quality guideline. These growing issues of water management drive the removal of 279
wetlands in lowlands impacting their ecosystem services as the natural purification of water (Daily, 1997; Russo, 280
2013). 281
282
3.3 Historical sparse data
283
Precipitation measurements are available at a monthly time step at two historical raingauges (Fig. 3a): P1
284
from 1930 to 2017, and P2 from 1955 to 1978. The correlation coefficient for the common period between both
285
stations at the annual time step is 0.74. A long-term reference precipitation dataset was calculated using the mean 286
of P1 and P2 when data from both stations are available, and from P1 for the remaining periods.
287
Daily runoff measurements at the Mefou catchment outlet at Nsimalen started in 1963 but with long periods 288
of gaps. Annual runoff is available for only 29 years (1964-1977, 1979, 1982-1986, 2005-2011 and 2017), and 289
ranges between 250 mm and 850 mm. Annual runoff coefficient ranges between 0.21 and 0.48. 290
Few studies are available on the hydrology of Yaoundé, and most of them date before the 80th. They
291
particularly focused on water balance at monthly and annual scales: on the Mefou river (Lefèvre, 1966; SNEC, 292
1969; Olivry, 1979), on the Mfoundi (Srang, 1972; Nguemou, 2008), and on sites downstream Nsimalen 293
(Ikounga, 1978). From these studies, we retain six historical donors (noted DH; Fig. 4a), and Table 1 presents their
294
characteristics: area between 24 and 235 km², period of observation, annual precipitation P between 1640 and 295
1930 mm, annual runoff R between 392 and 1340 mm, and annual runoff coefficient between 0.22 and 0.77. 296
Under the hypothesis that the storage annual variation is nil, we estimate an annual evapotranspiration AET = P – R 297
which ranges between 400 and 1400 mm. Information relative to precipitation measurements are well documented 298
in the historical studies previously cited. Note that the donor DH6 is located out of the Mefou catchment but quite
299
close from Yaoundé area (40 km) and presents a similar topography, soil and land-use conditions of the Mefou 300
catchment (Ikounga, 1978). These donors cover different land-use states: e.g. forestry natural cover for DH4 and
301
DH6 (U < 1%) and highly urbanized cover for DH3 (U > 75%).
302
Other historical studies of smaller (< 10km²) and larger (> 5000 km²) catchments in Nyong basins in natural 303
land-use context give P between 1420 and 1730 mm, R between 392 and 530 mm, between 0.18 and 0.30 and 304
AET between 1070 and 1470 mm. The urbanized catchment Odza (6 km²), located in Yaoundé (Mfoundi
catchment), was monitored in 2011-2012 by Ngoumdoun (2013) who calculated P = 1840 mm, R = 1640 mm, 306
= 0.88 and AET = 220 mm (see Supplementary Material, Sect. 4). 307
308
3.4 Dedicated short-term multi-scale instrumentation (03/2017-02/2018)
309
In order to complete historical data, we undertook dense spatial rainfall-runoff instrumentation during one 310
hydrological year (03/2017-02/2018). Eleven daily time step raingauges were installed in order to study the spatial 311
variability of precipitation (Fig. 4a). The choice of limnimetric stations location was determined by the position of 312
the main confluences, by the position of historical limnimetric stations, and the need to measure runoff from basins 313
with different degrees of urbanization (Fig. 4a). This instrumentation provides six additional experimental donors 314
(noted DI) with different ranges of heterogeneities in terms of area, land-use, topography and soil (Table 1). The
315
limnimetric station DI1 is located downstream the dam and enables to measure the outflow from the reservoir at
316
100 ± 25 mm.yr-1. The lack of measurements of the outflow value until 2017-2018 makes this results the first
317
assessment of the dam impact on Mefou water budget. The donor DI4 corresponds to the intermediate basin between
318
DI3 and DI2. Table 1 presents their characteristics: area between 21 and 120 km², P between 1620 and 1715 mm, R
319
between 712 and 1250 mm, between 0.40 and 0.76 and AET between 405 and 908 mm. Annual precipitation on 320
these donors DI are of the same order as for historical donors DH while runoff and runoff coefficients are generally
321
higher for catchments with higher urbanization rate. 322
323
3.5 Main characteristics of the donor catchments
324
The Mefou catchment originally covers by dense tropical forest includes the most part of the city of Yaoundé. 325
The urban area started growing since 1960 (1 % of the total basin area) to currently reach about 30-35 % of the 326
basin area with an impervious area estimated to 15 %. The forest cover has vanished of more than 50 % since 1980 327
with a huge conversion of the primary forest into secondary and degraded forests. Nowadays, the forests cover 328
about 40 % of the Mefou at Nsimalen. The various sources cited in Sect. 3.2 showed a growth of agricultural areas 329
around the urban area of Yaoundé, with cropland and grassland covers around 30 % of the catchment area in 2015. 330
The catchment can be considered as peri-urban due to the noticeable urbanization and the development of 331
agricultural activities observed in lowlands and outskirts. However, the south-west part and the area drained by 332
the Mopfou dam in upstream remain slightly affected by urbanization. 333
Combining historical studies and dedicated short-term instrumentation 2017-2018, we have 12 donor 334
catchments, 6 from historical studies (DH) and 6 from the instrumentation (DI) presenting various topographic, soil
335
and land-use characteristics; the area ranges between 21 and 235 km², P ranges between 1620 to 1930 mm, R 336
between 390 and 1340 mm, between 0.22 and 0.77 and AET between 400 mm to 1400 mm. SI varies from 6.7 %
337
to 13.5 %, HS varies from 0 to 44 % and U varies from 0 to 83 % over donor catchments of the study area. We 338
observe that can vary widely for the same catchment function of the land-use: e.g. from 0.33-0.4 for DH1 (U =
339
5 %) and DH2 to 0.77 for DH3 (U > 75 %). All the observed data on the study site are analysed to understand
hydrological processes of the catchments faced to land-use changes in order to identify rules defining the 341
hydrological index I on donors and apply it on targets for the period 1930-2017. 342
343
344
4 Precipitation
345
The model needs as input the precipitation P which has to be calculated on both donor and target catchments 346
(Fig. 4). For donors, precipitation information are well documented in corresponding studies or issue of dedicated 347
short-term instrumentation (Table 1). For targets, we used the long-term historical raingauges and the spatially 348
short-term information (1968-1969 from SNEC (1969), and 2017-2018 from the short-term instrumentation) to 349
construct historical precipitation database for each target. 350
351
4.1 Temporal variability of precipitation
352
First, we study long-term precipitation trends (1930-2015) over the Mefou catchment from historical 353
raingauges P1 and P2. The average precipitation is 1580 mm (Pm) and the minimal and maximal annual
354
precipitation are respectively Pn = 1050 mm and Px = 2200 mm. Values of Pn and Px set the limit of availability of
355
the developed model for the study catchment. Fig. 5a shows no significant trends of annual precipitation over the 356
period, but we observe a succession of humid (1960-1970, 1980-1990, and 2006-2013) and dry (1935-1950, 1970-357
1980, and 1990-2000) periods. At the seasonal scale we observe some changes in amount of precipitation: i) no 358
change during the first wet season (March to June) (Fig. 5b); ii) during the first dry season (July and August), 359
increase of the mean precipitation from 100 to 220 mm (+120 %) on the period 1930 to 2015 (Fig. 5c); iii) during 360
the second wet season (September to November) slight increase from 700 to 760 mm (+9 % ; Fig. 5d); iv) during 361
the second dry season (December to February) decrease from 110 to 80 mm (-28 %; Fig. 5e). This historical 362
precipitation database is used to construct the database precipitation for target catchments. Results shows also that 363
there is no a clear changes on annual precipitation between 1930 and 2015, and consequently the trend of annual 364
runoff coefficient increase can be related mainly to catchment change and particularly to the increase of urbanized 365
areas. 366
367
4.2 Spatial variability of precipitation
368
Second, we study the spatial distribution of annual precipitation over the Mefou catchment. 369
Figures 6a and 6b show the mean annual precipitation for respectively the hydrologic years 1968-1969 370
(SNEC, 1969) and 2017-2018 (dedicated short-term instrumentation), the only historical years with available 371
dense spatially measured precipitation. 372
For 1968-1969, P varies over the Mefou catchment between 1400 mm to 2000 mm with an average of 1780 373
mm. For 2017-2018, P varies between 1400 and 2100 mm with an average of 1640 mm. The hydrological year 374
2017-2018 seems quite representative of an average year in terms of annual precipitation (Pm = 1580 mm). The
375
annual precipitation observed at P1 is about 1730 mm for the same period with a difference of +6 % with average
376
precipitation P. The rain-gauge P1 seems quite representative of the average value for the Mefou catchment.
377
On both Figs. 6a and 6b, we observe that the highest annual precipitation values are located in the north-west 378
part of the basin, corresponding to the zone with highest elevations. The east and south parts, corresponding to the 379
flattest and lowest elevation parts of the basin are characterized by lower P. 380
Due to the lack of spatial information for the historical period, a precipitation weight wTi is assigned to a
381
target catchment Ti such as:
382
PTi = wTi .P , (12)
383
where P is the mean annual precipitation on the Mefou catchment from the historical database and PTi the mean
384
annual precipitation on Ti. The term wTi = PTi/P can be both calculated using historical data (Figs. 6a and 6c) and
385
the instrumentation 2017-2018 (Figs. 6b and 6d). For both cases, we obtain comparable and retain wT1 = wT3 = wT5
386
= wT6 = wT7 = 1 for respectively T1, T3, T4, T5, T6 and T7; wT2 = 1.05 for T2 is slightly high due to the high values
387
of P; wT4 = wT8 = 0.95 for T4 and T8.
388
389
4.3 Relationship between annual runoff coefficient and precipitation
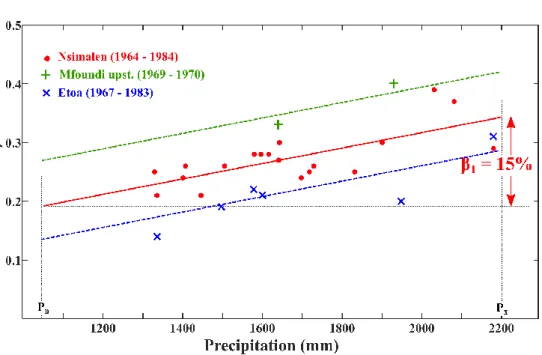
390
Third we study the relationship between the annual runoff coefficient and P for three stations in nearly-391
steady land-use states (Fig. 7): the Mefou at Nsimalen on the period 1964-1984 with a low impact of land-use 392
evolution in comparison to the period 1984-2015, the Mefou at Etoa natural forested basin on the period 1967-393
1983, and the semi-urbanized Mfoundi on the period 1969-1971. Both the Mefou at Etoa and Mfoundi are sub-394
catchments of the Mefou at Nsimalen. For the Mefou at Nsimalen, we adjusted a linear relationship between 395
and P; increases from n,P = 0.2 corresponding to Pn = 1050 mm to x,P = 0.35 corresponding to Px = 200 mm;
396
this gives 1 = x,P - n,P = 0.15. For the Mefou at Etoa, = 0.15 for P = 1330 mm and = 0.30 for P = 2200 mm;
397
both values of for the Mefou at Etoa are inferior than those observed on the Mefou at Nsimalen for similar values 398
of precipitation, showing the impact of land-use with low annual runoff coefficient on natural basins. For the 399
Mfoundi, = 0.33 for P = 1640 mm and = 0.40 for P = 1930 mm; both values of for the Mfoundi are superior 400
than those observed on the Mefou at Nsimalen for similar values of precipitation, showing the impact of land-use 401
with high annual runoff coefficient on semi-urbanized basins. In summary, we obtain approximately similar values 402
of 1 = 0.15 on the Mefou at Nsimalen (1964-1984), but also on the natural Etoa catchment (1967-1983) and on
403
the in-urbanization Mfoundi upstream catchment (1969-1970). These three catchments have three different values 404
of the hydrological index I, but with I considered constant on the presented periods. 405
406
5 The hydrological index I
408
This section analyses the hydrological and physiographic data in order to define the rules for constructing 409
the hydrological index I calculated as a linear combination of three components: 410
𝐼 = 𝜔𝑇𝐶𝑇+ 𝜔𝑆𝐶𝑆+ 𝜔𝐿𝐶𝐶𝐿𝐶 , (13)
411
where CT is the topography component, CS the soil component, CLC the land-use component, T the weight of CT,
412
S the weight of CS, and LC the weight of CLC.
413
414
5.1 The components CT, CS and CLC
415
Heterogeneities of topography, soil condition and land-use variability in space and time observed on the study 416
area (Sect. 3) lead us to propose classification rules to highlight the main features of catchments and to define the 417
three components CT, CS, and CLC of the hydrological index I using cartographical data. All three components
418
range between 0 and 1; when any of the terms (CT, CS and CLC) increase, increases. The topography (CT) and soil
419
condition (CS) are considered stable over the time contrary to land-use (CLC) faced to major changes.
420
For topography CT, the slope index SI of Roche (Roche, 1963) is calculated for donors (Table 1) and targets
421
from SRTM (2014). We define: CT = 0 for SI < 7 %; CT = 0.5 for 7 % ≤ SI ≤ 12 %; CT = 1 for SI > 12 %.
422
For soil condition CS, the lack of accurate soil maps over the catchment constrains us to define indirectly soil
423
condition heterogeneities over the catchment. Historical studies of soil characteristics (Bachelier, 1959; 424
Pellier, 1969; Humbel and Pellier, 1969) are used to define soil classes depending on the altitude and the slope 425
derived from the SRTM 2014. For that, we calculate the area of lowlands (altitude < 730 m) with low slopes 426
(< 7 %) corresponding to hydromorphic yellow soil characterized by lower rate in clay and higher surface 427
permeability. The proportion of hydromorphic soil (HS) on each catchment is used to estimate the classes of CS
428
(see for donors Table 1, and for targets: CS = 0 for HS > 15 %; CS = 0.5 for 2 % ≤ HS ≤ 15 %; CS = 1 for HS < 2 %.
429
For land-use component CLC, historical references and global products (summarized in Table 2) are used to
430
characterize land-use of donors and the evolution of target land-use over past-period with available data (1930, 431
1950, 1980, 2000, and 2017) and future scenario (2030). In order to integrate the main land-use signature, we 432
define six classes for CLC according to urban area proportion of (U; see for donors Table 1, and for targets the
433
Supplementary Material, Table S3): CLC = 0 for U < 1 %; CLC = 0.2 for 1 < U < 5 %; CLC = 0.4 for 5 < U < 20 %;
434
CLC = 0.6 for 20 < U < 50 %; CLC = 0.8 for 50 < U < 70 %; CLC = 1 for U > 70 %. Different trends of land-use
435
changes are observed for the 8 target sub-catchments (Fig. 8). From 1930 to 1950, the whole main catchment is 436
considered to be mostly cover by originally forest (CLC = 0 for all the targets). Development of urbanization
437
impacted first the Mfoundi sub-catchments from 1960 to 1980 (T5, T6 and T7) especially T5. Nowadays, these
sub-438
catchments reach a maximum of urbanization for T5 and T6 (CLC = 1). T2 and T8 faced to major changes since 1980
439
with intensification since 2000. Nowadays, the urbanization process do not get the entire area of these catchments. 440
The urbanization continue and will be amplified in these surrounding areas due to the lack of space in the most 441
urbanized part of Yaoundé (T5, T6 and T7). T1, T3 and T4 are the last sub-catchments impacted by urbanization; a
442
high proportion of these catchments have forest or wetland covers. We propose a fictive but plausible scenario of 443
land-use for 2030, regarding to the current expansion of the urban area and the perspective of future population 444
estimation for Yaoundé (from 3.6 million in 2017 to 6.7 million in 2035; UNDESA, 2017). We suppose a high 445
development of urbanization for T2 and T8 (CLC from 0.6 in 2017 to 0.8 in 2030) and in a lesser extent a development
446
of urbanization over the south part of the basin (T4 with CLC from 0 in 2017 to 0.4 in 2030). Values of CT, CS and
447
CLC are presented for donors in Table 3 and for targets in Table 4.
448
449
5.2 Relationship between annual runoff and CT, CS and CLC for donors
450
DH4, DH5 and DH6 correspond to forested areas (CLC = 0) whereas DI5 and DH3 have high rates of urbanization
451
(CLC = 1, Table 3). For these basins, precipitation presents a low range of variation between 1645 and 1810 mm.
452
DH4, DH5 and DH6 present low values of annual runoff coefficient with varying from 0.22 to 0.25. DI5 and DH3
453
present very highvalues of runoff with = 0.76 and 0.77. For catchments with intermediate levels of urbanization 454
(DI2, DI3, DI4, DI6, DH1, DH2), runoff ranges between those observed in the two previous cases with ranging
455
between 0.33 and 0.54. 456
Analysis of for donors DI2 and DI6 presenting the same value of CLC (0.6) but extreme values of CT and CS
457
(DI2 is located in the hilly part of the Mefou catchment whereas DI6 present high portion of lowlands) enables to
458
quantify the impact of CS and CT on . For the period September-December, DI6 presents runoff coefficient of 0.40
459
which is significantly lower than the value of 0.53 observed for DI2 on the same period. Differences observed are
460
quite clear in term of runoff with for DI4 runoff value up to 160 mm in October against 95 mm for DI6 (see
461
Supplementary Material, Sect. 5). 462
These results show the significant impact of land-use conditions on runoff, but topography and soil condition 463
could explain complex hydrological responses. Consequently when calculating the index I, we will give a higher 464
weight to the component CLC in comparison to CT and CS.
465
466
5.3 The weights T, S and LC
467
From data analysis (Sect. 5.2), we showed that the impact of land-use change on runoff is higher than the 468
impact of soil and topography. Consequently, we affect higher weight for LC, with LC > T and LC > S.
469
Figure 9 shows an example of the relationship between annual runoff of donors and hydrological index for 470
donors I forLC = 7/9, T = 1/9 and S = 1/9. We observe a simple linear empirical relationship to estimate 𝜌𝐷 :
471
𝜌𝐷= aI+ b (14)
472
with r² = 0.96. We conduct a sensitivity analysis of the regression on the adjusted parameters a and b for four sets 473
of parameters LC, T and S : i) T = 1/5, S = 1/5 and LC,= 3/5; ii) T = 1/7 S = 1/7 and LC,= 5/7; iii), T =
474
1/9, S = 1/9 and LC= 7/9; iv) T = 1/12, S = 1/12 LC = 10/12. We obtain very good correlation coefficient of
475
the four linear regressions ranging between 0.83 (case i) and 0.98 (case iv). The parameter a ranges between 0.66 476
and 0.83, and the parameter b between 0.10 and 0.19 (note that for I = 0 we have b). For I = 1, we have a 477
+ b whichvaries between 0.80 and 0.84. Around a mean value of I = 0.5, all four configurations give = 0.51 (See 478
Supplementary Material, Sect.6). 479
For the configurations ii, iii and iv, we have r² = 0.96 +/- 0.02. In the following, we retain the intermediate 480
set T = 1/9, S = 1/9 and LC= 7/9 (corresponding regression presented in Fig.9). Table 3 presents the values of
481
I for donors and Fig. 10 gives the temporal evolution of I from 1930 until now for targets. Note that in 2017, the
482
values of I are particularly high for the target catchments T5, T6 and T7 on the Mfoundi basin due to high
483
urbanization. In contrast, some target catchments such as T1 and T4 are or not impacted nowadays by urbanization
484
and presents very low values of I. Finally, the target catchments T2, T3, and T8 are currently faced to the most
485
important land-use change and have intermediate values of I. 486
487
5.4 Introducing I in the model structure
488
In the following, we choose a simple linear relationship between I and Eq. 14; Fig. 9) which leads that the 489
value of 1 is constant and similar for all values of I.
490
We observe that the impact of land-use change (represented by I) on annual runoff (2) is higher than the
491
impact of precipitation change (1), with 1 = 0.15 (Fig. 7), 2 = 0.60 (Fig. 9) and 1 << 2. We consider a
492
reference precipitation 𝑃𝑅= 𝑃𝑥+𝑃𝑛
2 , and let𝜌𝐷 be the runoff coefficient calculated by the linear regression adjusted
493
from donors under precipitation near of PR (1625 mm). Then is calculated as the sum of 𝜌𝐷 and a factor G taking
494
into account the impact of precipitation: 495
𝜌 =
𝜌𝐷+ 𝐺 ,
(15) 496 with 497𝐺 =
𝛽1 (𝑃𝑥−𝑃𝑛)[𝑃 −
𝑃𝑥+𝑃𝑛 2] .
(16) 498For a given value of I (Fig. 9): for P = Pn, we have G = -1/2 and consequently = 𝜌𝐷− 𝛽1
2 = ρn,P ; for
499
P = Px, we have G = 1/2 and consequently ρ = 𝜌𝐷+ 𝛽1
2 = 𝜌𝑥,𝑃.
500
Introducing Eq. (14) and (16) into Eq. (15), we obtain very simple second order polynomial relationship 501
between R and P (Eq. 17 similar to Eq. 1) and a linear relationship between and P (Eq. 18 similar to Eq. 2), and 502 R = AP² + BP
,
(17) 503 = AP + B,
(18) 504 with 𝐴 = 𝛽1 𝑃𝑥−𝑃𝑛 and 𝐵 = 𝑎𝐼 + 𝑏 − 𝛽1(𝑃𝑥+𝑃𝑛) 2(𝑃𝑥−𝑃𝑛).
(19) 505In summary, the model needs the precipitation P as input and the three parameters a, b and 1 characterizing
506
the relationship between and I. These three parameters can be calibrated using data from donor catchments. 507
6 Applications
508
The model presented in Sect. 2 is function of precipitation P and the hydrological index I. Precipitation was 509
calculated on the target sub-catchments using historical precipitation dataset and the relationships established in 510
Sect. 4. The hydrological index I is defined in Sect. 5 and presented in Fig. 10 for target catchments for the period 511
1930 - 2030. 512
First a sensitivity analysis was conducted and the calibrated parameters a, b of the model are discussed (Sect. 513
6.1). Then two applications were conducted on the Mefou at Nsimalen subdivided into eight target sub-catchments 514
(Fig. 4.b) in order: 515
- to study the spatial hydrological functioning of the basin on eight target sub-catchments and calculate the 516
water balance during the short instrumentation period 2017-2018 (Sect. 6.2). 517
- to reconstruct the hydrograph at the Mefou at Nsimalen and on the eight sub-catchments for the historical 518
period 1930-2017 and to simulate the impact of future scenarios of land use and urbanization (Sect. 6.3). 519
520
6.1 Sensitivity analysis, calibration, validation and model comparison
521
Applications were conducted on the period 1930-2017, using precipitation data on P1 and P2, to reconstruct
522
annual runoff for all eight target sub-catchments and the whole Mefou catchment at Nsimalen. Predictions for the 523
impact assessment of future land-use scenario on annual runoff were then also made. In the application, we 524
distinguish two cases, before and after the dam construction (1970). Before 1970, the catchment T1 (controlled
525
area of the dam location) is considered as other catchments (R depends of I and P). After 1970, the simulated R of 526
T1 corresponds to the proportion of precipitation discharged measured during the short-term instrumented period
527
(= 0.05 to 0.15; see Table 1 for DI1 and Sect. 3.4).
528
From data analysis in Sect. 4.3 (Fig. 7), we retain 1 = 0.15. We run a sensitivity analysis on the remaining
529
two parameters a and b (adjusted from the regression DaIb with I calculated using Eq.13 with T = 1/9 and
530
S = 1/9, LC = 7/9) for different sets of donor catchments. We run the model for n = 6, 8, 9 and 10 donors (see
531
Table 1 and Sect. 3.3 and 3.4). In each run, we select randomly 30 sets of n donors, and in order to have a wide 532
range of variation of I, we add a constrain that for at least one point we have I < 0.3 and for at least one point we 533
have I > 0.7. The model output is given by Eq. 1 to 6 at the Mefou at Nsimalen, and the model is evaluated using 534
the three criteria RMSE (Eq. 8) and r² (Eq. 9) and 𝐸̅ (Eq. 11) for the 29 observed years (see Sect. 3.3). For n = 6, 535
8, 9 or the 10 donors, we observe a low impact of the number of donors on the calibrated parameters (a and b) and 536
the three performance criteria with a = 0.68 +/- 0.02, b = 0.12+/- 0.01, RMSE = 101+/-1 mm, r² = 0.66, and 537
𝐸̅ = 15 % (see Supplementary Material, Sect. 6). The low variability of the average of parameters a and b from 538
n = 8 lead us to select 8 donors by keeping the last two donors for validation.
539
In order to get a model adapted to various states of urbanization, the calibration and validation dataset at the 540
Mefou catchment scale should include periods of low and high urbanization rate. Observed annual runoff at the 541
Mefou at Nsimalen are used in alternate years for calibration (15 years) and validation (14 years). From the 542
sensitivity analysis, we calibrate a and b, choosing the set of 8 from 10 donors giving the lowest values of RMSE 543
on the 15 years calibrated period. We use the 9 donors DH2, DH3, DH4, DH6, DI2, DI3, DI4, DI5 and DI6. We obtain
544
a = 0.74; b = 0.12 with performance criteria RMSE = 70 mm, r² = 0.79 and 𝐸̅ = 11 %. Figure 9 presents the linear 545
regression for the calibrated parameters and Fig. 11 shows the abacus = g(P,I) for these parameters. In the 546
abacus, we plotted the donor catchments by specifying the corresponding estimation of I in parenthesis to compare 547
with the model. We also plotted the points of Etoa for the period 1967-1983 characterized by a stationarity value 548
of I (0.11) but with a wide range of P (1320 to 2150 mm). 549
The validation is made at two levels. First, the two remaining donor catchments DH3 and DI2 are used to
550
validate; we obtain 𝐸𝐷𝐻3= +8 % (+105 mm) and 𝐸𝐷𝐼3= +12 % (+110 mm). Second, at the Mefou at Nsimalen for
551
the remaining 14 years; we obtain RMSE = 123 mm, r² = 0.60, and 𝐸̅ = 18 %. 552
The semi-distributed model results were also compared to the stationary lumped annual runoff model GR1A 553
(Mouelhi, 2003) using the same calibration and validation procedure. GR1A is used to compare with a stationary 554
approach of the catchment characteristics. Results are shown on Fig. 12 with performance for GR1A significantly 555
lower with RMSE = 126 mm, r² = 0.43 and 𝐸̅ =19 % for calibration and RMSE = 128 mm, r² = 0.42 and 𝐸̅ = 22 % 556
for validation over the both same periods at Mefou catchment scale. As the GR1A was calibrated using alternate 557
years on the whole period, we observe that GR1A slightly overestimate the runoff for the period 1963-1980 (with 558
low impact of urbanization), and underestimates runoff for the period 2011-2017 (with high impacts of 559
urbanization) 560
561
6.2 Annual water balance on the instrumented period 2017-2018
562
The rainfall-runoff data from the short-term instrumentation 2017-2018 enables to measure the contribution 563
of the catchments T1, T2, T3 and T6 of the Mefou catchment at Nsimalen. However, the target sub-catchments T4,
564
T5, T7 and T8 were not gauged. Table 5 gives the values of P, R, AET, and the contribution of each sub-catchment
565
Ki, corresponding to runoff volume of sub-catchment Vi divided by the volume at Nsimalen VO (with Ki = Vi / VO).
566
P ranges between 1580 and 1715 mm, R between 100 and 1325 mm, AET between 320 and 1260 mm, between
567
0.21 and 0.76 and K between 2.5 to 18.5 %. We can classify the eight target catchments into four categories 568
according to land-use: i) controlled by the dam, T1; ii) urbanized T5, T6 and T7; iii) peri-urban T2, T3 and T8; iv)
569
natural basins T4.
570
The first category concerns the sub-catchment T1 controlled by the dam. The annual discharge R1 measured
571
at the outlet of the dam is 100 mm +/-25 mm, corresponding to a contribution K1 = 2.5 % on the total volume at
572
Nsimalen. 573
The second category corresponds to sub-catchments firstly faced to urbanization during the study period. We 574
have respectively R5 = 1230 +/- 125 mm, R6 = 1130 +/-125 mm and R7 = 1030 +/- 200 mm. The contribution of
575
T5, T6 and T7 on the total volume at Nsimalen are respectively K5 = 18.0 %, K6 = 10.0 % and K7 = 11.0 %. These
576
three catchments are characterized of by very low AET between 390 and 620 mm and very high between 0.62 577
and 0.76. 578
The third category corresponds to peri-urban catchments. Runoff on T2 (corresponding to DI2) is
579
characterized by R2 = 915 +/- 90 mm (compared to 1030 mm simulated), = 0.53, AET2 = 800 mm, and
580
corresponds to 15 % of VO. T8, presenting an intermediate land-use characteristics with low slope in the
581
downstream part, has R8 = 730 +/- 150 mm, = 0.46, AET8 = 850 mm, and K8 = 16 %. The main differences
582
between T2 and T8 are the topography and the soil characteristics: T2 is located in the upstream part of the Mefou
583
catchment and presents hilly landscape with steep slopes; T8 is located in the east side presenting lowland with
584
important wetland area and overflow during wet seasons. These differences explain the lower values of R for T8
585
in comparison with T2. These results are comforted by observed runoff coefficient for the second wet season in
586
2017: T2 have an observed runoff coefficient of 0.53 compared to 0.40 for T8 despite a similar urbanization rate
587
(40 % for T8 and 46 % for T2). In the same category, T3 (DI4) presenting a most natural land-use (10 % of urbanized
588
area) than T2 and T8, is characterized by R3 = 715 +/-75 mm (compared to 700 mm simulated), = 0.43,
589
AET3 = 905 mm, and K3 = 18.5 %.
590
For the fourth category, T4 is not impacted by urbanization (U < 1%). T4 is located downstream with low
591
slope, with soil condition and topography favouring overflow, infiltration and evaporation. T4 presents the lowest
592
R4 = 370 +/- 50 mm, = 0.24, AET4 = 1290 mm, and K4 = 9 %.
593
For the Mefou at Nsimalen, we obtain by aggregation of the eight sub-catchments: RO = 660 +/- 65 mm
594
(compared to 645 mm measured at the outlet), O= 0.41 and AETO = 990 mm. These values are very near from
595
observed data with annual runoff measured of 645 mm. 596
These results on the eight target sub-catchments are compared to other studies in the Nyong basin (see 597
Supplementary Material, Sect. 4) on natural basins (Maréchal et al., 2011; Olivry, 1979; Lefèvre, 1966) and on 598
one urbanized basin of the Nyong basin. These studies led to comparable results of with = 0.24 +/- 0.06 on 599
natural basins, and = 0.88 on the urbanized of Odza (Ngoumdoum, 2013) on Nyong basin. 600
601
6.3 Reconstruction of historical runoff and prediction for scenarios of land-use
602
The past-period 1930-2017 simulated for targets and at Nsimalen are presented in Fig. 12. The grey envelope 603
curve represents the estimation of runoff uncertainties due to annual precipitation (+/- 10 %) and hydrological 604
index (+/- 15 %). Except for T4 (downstream part of Mefou catchment) and T1 (area controlled by the dam), all the
605
target sub-catchments present an increasing trend of runoff in earlier or later date. In a context of no annual 606
precipitation trends over the period 1930-2017, the urbanization development and forestry retreat for six of the 607
eight targets result in clear increasing of R. We notice that the impact on runoff is until now lesser for T3 and T8.
608
In order to quantify impacts of land-use changes, we calculated mean values 𝑃̅, 𝑅̅ and𝜌̅, 5th percentile Q
5 and
609
95th percentile Q
95 for one past period (1950-1980) and one recent period (1987-2017) (see Table 6). The mean
610
precipitation over the first period is about 75 mm higher (+ 5%) than for the second period with a similar standard 611
deviation (200 mm). Excluding T1, controlled by the dam, we obtained on the period 1950-1980 𝑅̅ between 315
612
and 764 mm, 𝜌̅ between and 0.47, Q5 between 200 and 503 mm and Q95 between 502 and 1108 mm. On the