Title
: cells using a dynamic metabolic model: the cell passage effect Auteurs:
Authors
: Benoît Laflaquiere, Gabrielle Leclercq, Chandarong Choey, Jingkui Chen, Sabine Peres, Caryn Ito et Mario Jolicoeur
Date: 2018
Type:
Article de revue / Journal articleRéférence:
Citation
:
Laflaquiere, B., Leclercq, G., Choey, C., Chen, J., Peres, S., Ito, C. & Jolicoeur, M.
(2018). Identifying biomarkers of Wharton's Jelly mesenchymal stromal cells using a dynamic metabolic model: the cell passage effect. Metabolites, 8(1), p. 1-28. doi:10.3390/metabo8010018
Document en libre accès dans PolyPublie
Open Access document in PolyPublie
URL de PolyPublie:
PolyPublie URL: https://publications.polymtl.ca/3564/
Version: Version officielle de l'éditeur / Published version Révisé par les pairs / Refereed
Conditions d’utilisation:
Terms of Use: CC BY
Document publié chez l’éditeur officiel Document issued by the official publisher
Titre de la revue:
Journal Title: Metabolites Maison d’édition:
Publisher: MDPI URL officiel:
Official URL: https://doi.org/10.3390/metabo8010018 Mention légale:
Legal notice:
Ce fichier a été téléchargé à partir de PolyPublie, le dépôt institutionnel de Polytechnique Montréal
This file has been downloaded from PolyPublie, the institutional repository of Polytechnique Montréal
http://publications.polymtl.ca
metabolites
Article
Identifying Biomarkers of Wharton’s Jelly Mesenchymal Stromal Cells Using a Dynamic Metabolic Model: The Cell Passage Effect
Benoît Laflaquière1, Gabrielle Leclercq1, Chandarong Choey2, Jingkui Chen1, Sabine Peres1,3,4, Caryn Ito2and Mario Jolicoeur1,*ID
1 Department of Chemical Engineering, Research Laboratory in Applied Metabolic Engineering, École Polytechnique de Montréal, C.P.6079, Centre-ville Station, Montréal, QC H3C 3A7, Canada;
benoit.lafl[email protected] (B.L.); [email protected] (G.L.); [email protected] (J.C.);
[email protected] (S.P.)
2 Sprott Centre for Stem Cell Research, Ottawa Hospital Research Institute, 501 Smyth Rd. CCW 5105a, Ottawa, ON K1H 8L6, Canada; [email protected] (C.C.); [email protected] (C.I.)
3 LRI, UniversitéParis-Sud, CNRS, UniversitéParis-Saclay, 91405 Orsay, France
4 MaIAGE, INRA, UniversitéParis-Saclay, 78350 Jouy-en-Josas, France
* Correspondence: [email protected]; Tel.: +1-514-340-4711 (ext. 4525) Received: 22 December 2017; Accepted: 22 February 2018; Published: 24 February 2018
Abstract: Because of their unique ability to modulate the immune system, mesenchymal stromal cells (MSCs) are widely studied to develop cell therapies for detrimental immune and inflammatory disorders. However, controlling the final cell phenotype and determining immunosuppressive function following cell amplification in vitro often requires prolonged cell culture assays, all of which contribute to major bottlenecks, limiting the clinical emergence of cell therapies. For instance, the multipotent Wharton’s Jelly mesenchymal stem/stromal cells (WJMSC), extracted from human umbilical cord, exhibit immunosuppressive traits under pro-inflammatory conditions, in the presence of interferon-γ(IFNγ), and tumor necrosis factor-α(TNFα). However, WJMSCs require co-culture bioassays with immune cells, which can take days, to confirm their immunomodulatory function. Therefore, the establishment of robust cell therapies would benefit from fast and reliable characterization assays. To this end, we have explored the metabolic behaviour of WJMSCs in in vitro culture, to identify biomarkers that are specific to the cell passage effect and the loss of their immunosuppressive phenotype. We clearly show distinct metabolic behaviours comparing WJMSCs at the fourth (P4) and the late ninth (P9) passages, although both P4 and P9 cells do not exhibit significant differences in their low immunosuppressive capacity. Metabolomics data were analysed using an in silico modelling platform specifically adapted to WJMSCs. Of interest, P4 cells exhibit a glycolytic metabolism compared to late passage (P9) cells, which show a phosphorylation oxidative metabolism, while P4 cells show a doubling time of 29 h representing almost half of that for P9 cells (46 h). We also clearly show that fourth passage WJMSCs still express known immunosuppressive biomarkers, although, this behaviour shows overlapping with a senescence phenotype.
Keywords: metabolomics; Wharton’s Jelly mesenchymal stem/stromal cells (WJMSC);
immunosuppression; biomarkers
1. Introduction
Immunosuppressive cells play crucial roles in regulating the human immune system, by secreting pro- and anti-inflammatory cytokines at ratio enabling desired specific immune response.
A dysfunction of this equilibrium can lead to serious pathological disorders. For instance, the overexpression of pro-inflammatory cytokines has been identified as a main cause leading to Multiple
Metabolites2018,8, 18; doi:10.3390/metabo8010018 www.mdpi.com/journal/metabolites
Sclerosis [1] and graft-versus-host diseases [2]. Conversely, the overexpression of anti-inflammatory cytokines results in a deficient immune system unable to eliminate a pathogen or tumour cells [3].
Indeed, several cell types revealed a functional capacity to impact on this cytokine equilibrium, either by directly increasing or reducing their respective concentrations or by modulating the production or consumption rates of specific metabolites within the cell microenvironment, that indirectly affects cytokines secretion. For instance, macrophages exhibit specific behaviour depending on whether they are polarized towards the M1 or M2 phase [4]. In the M2 phase, an increased consumption rate of tryptophan is observed, which leads to the starvation of the surrounding T-cells [5,6]. Also, recruited by tumor cells, myeloid derived suppressor cells (MDSC) are known to protect the tumor against the immune system [7]. Once recruited, MDSCs increase their consumption in
L-arginine (L-ARG) and their production of nitric-oxide (NO), both phenomenon resulting in reduced T-cell proliferation and viability [8,9]. Interestingly, mesenchymal stem/stromal cells (MSC) placed within a pro-inflammatory environment appear to reduce the immune response [10]. For instance, bone marrow mesenchymal stem/stromal cells (BMMSCs), as induced by the pro-inflammatory cytokine interferon-γ (IFNγ), increase their uptake of tryptophan resulting in reduced T-cells responses [11]. More recently, Wharton’s Jelly mesenchymal stem cells (WJMSC) when compared to bone marrow derived MSCs [12], have revealed strong immunosuppressive properties under pro-inflammatory conditions with INFγand tumor necrosis factor-α(TNFα) [13,14]. Moreover, MSCs do not express Human Leukocyte Antigen—antigen D Related (HLA-DR) or co-stimulatory clusters of differentiation 40 (CD40), CD40L, CD80, and CD86 cell surface antigens necessary to trigger an immune response [15–17]. Therefore, their low immunogenicity evades immune recognition upon xeno or allogeneic transplantation. Thus, the unique MSCs immunomodulatory properties have attracted the interest of the community resulting in nearly 200 clinical trials so far to test their efficacy at modulating severe immune and inflammatory responses associated to various medical pathologies [18]. However, data emerging from these trials and preclinical studies are often inconsistent and contradictory [18,19].
Besides pointing out the inherent disparities between MSC donors and tissue sources [20,21], most of the compelling cause of these varying results may be attributed to the in vitro processes to isolate and amplify MSCs. Indeed, MSCs immunomodulatory function has been shown to decrease in prolonged in vitro culture, reaching undetecTable levels at late passages [22,23].
MSCs are a heterogeneous population and the International Society for Cell Therapy recognizes the need for standardized metrics to assess MSC immunoregulatory function to enable clinical development [24,25]. The problem with the current metrics is that they are too broad and impractical to rapidly determine cell phenotype in time for a clinician to decide whether or not to proceed with the injection of MSCs. Currently, cell culture assays require days to confirm MSC effects on T-cell or macrophage growth and function. However, “omics” approaches clearly open opportunities for the identification of efficient biomarkers correlating with cell function to provide fast and reliable assays. Indeed, metabolomics is gaining in interest since it allows an integrated and functional view on a cell population behaviour, with the genomic and the transcriptomics in action [26]. For instance, only few metabolites are known to be involved in cell immunosuppressive capacity [6,8,27], and the link between their concentration and cells phenotype is still not clear. Therefore, the identification of biomarkers of MSCs immunosuppressive phenotype may provide insight into their metabolic network.
Here, we present a study on the metabolic behaviour of Wharton’s Jelly mesenchymal stem cells (WJMSC), when comparing fourth (P4) to late ninth passage (P9) cells, wherein both cells presented slightly different immunosuppressive function under pro-inflammatory conditions. A dynamic metabolic flux analysis (dMFA) was performed to further characterize differences in the behaviour of both WJMSC cultures, using an in silico platform describing central carbon metabolism as well as pathways related to cell immunomodulatory mechanisms [28]. A dynamic metabolic model was developed based on the experimental data of intracellular and extracellular metabolite concentrations. This approach is complementary to steady-state approaches [29] with the prediction of extracellular and intracellular metabolite concentrations, as well as metabolic flux distribution.
2. Results and Discussion
2.1. Fourth (P4) and Ninth (P9) Passage WJMSC Cells Exhibit Non-Significantly Different Low Immunosuppressive Phenotypes
A mixed lymphocyte reaction analysis (MLR) was performed, as proposed by Weiss et al. [23], who revealed that the immunosuppressive phenotype of human umbilical cord mesenchymal stem cells (hUCMSC) strongly decreases between the 5th and the 9th passages. In the present case, MLR analysis of WJMSCs at the 4th and 9th passages show no significant difference in their immunomodulatory function, based on a Student’st-test of 0.295 as compared to the reference value of 2.132 for the 95%
confidence interval. However, although not statistically significant, one can observe a decreasing tendency of the cells immunomodulatory function between the 4th and the 9th passages (Figure1).
This observation suggests that similar to the work of Weiss et al. [19], WJMSCs may preserve strong immunomodulatory function among early passages, such as up to the 2nd or the 3rd. Of interest, similar conclusions can be drawn in the presence or absence of INFγand TNFα. In addition, it should be noted that the large SEM error bars can be attributed to the fact that WJMSCs are a subset of hUCMSCs, which are composed of various types of MSCs that are found in the umbilical cord.
Figure 1. Mixed lymphocyte reaction (MLR) data of Wharton’s Jelly mesenchymal stem cells (WJMSC) cells.
Therefore, since both P4 and P9 cells do not significantly differ in their low immunosuppressive function under pro-inflammatory conditions (i.e., +IFN & +TNF), a dynamic metabolomic study was performed to specifically characterize and document biomarkers that are specific to the cumulative effect of successive passages.
2.2. WJMSC P4 and P9 Cells Show Distinct Metabolic Behaviour
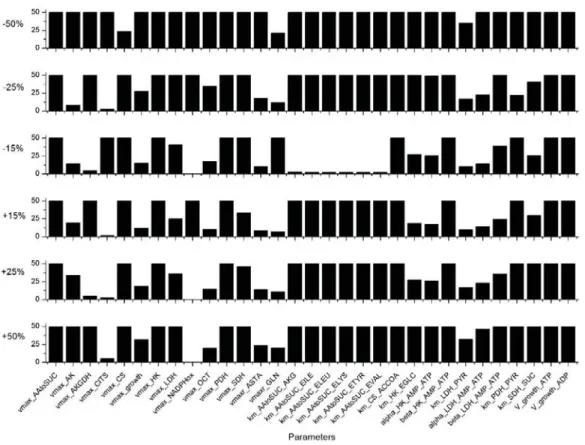
The metabolic model was first calibrated combining experimental data for P4 and P9 cells, as described in AppendixB. The value of the 234 parameters (Table S3, Supplementary Materials) that are minimizing model simulation error were then determined. Then, a sensitivity analysis was performed, assessing each parameter and the most sensitive parameters were identified as described in the AppendixC. Indeed, of the 234 parameters, 31 are considered as highly sensitive, as they induce a variation of more than 10% of the global simulation error from a change of only 15% of their value
(Figure2). Most of these parameters are involved in the TCA cycle: such as the theoretical asymptotic maximal activitiesvmaxAAtoSUC,vmaxAKGDH,vmaxCITS,vmaxCS,vmaxPDH,vmaxSDH,vmaxrASTA, and the half-saturation constants KmAAtoSUCAKG, KmAAtoSUCILE, KmAAtoSUCELEU, KmAAtoSUCELYS, KmAAtoSUCETYR,KmAAtoSUCEVAL,KmCSACCOA,KmPDHPYR, andKmSDHSUC. Another group of sensitive model parameters is within the glycolysis pathway with especially reactions catalysed by HK and LDH withvmaxHK,vmaxLDH,KmHKEGLC,al phaHK
AMPATP,KmLDHPYR,betaHK
AMPATP,al phaLDH
AMPATP, andbetaLDH
AMPATP. One parameter affects the glutaminolysis (vmaxrGLN), one is involved in the urea cycle (vmaxOCT), and the others are related to cell energetics state and the cell specific growth rate with vmaxAK,vmaxN ADPHox,vgrowthATP,vgrowthADP, andvmaxgrowth, respectively. Our results clearly show that model sensitive parameters are widely distributed throughout the metabolic network, and this is not surprising as it highlights that the central carbon metabolic pathways are vital when describing cell behaviour. Indeed, we have identified a similar subset of sensitive parameters in previous studies with CHO cells [28,30,31]. The sensitive role of the LDH enzyme has also been identified by Nolan et al. for another CHO cell line [32]. Interestingly, the parameters of the intermediate reactions of glycolysis, such as PGI, phosphoglycerate kinase (PGK), or PK were not sensitive in the WJMSC model, contrarily to CHO cells [28,30,31].
Figure 2.Sensitivity analysis results for the 31 most sensitive parameters. This selection is based on a simulation error criterion higher than 10% for a parameter value variation of±15%. Simulation error higher than 50% are truncated.
A first set of parameters were thus determined from minimizing simulation error, anchoring model structure and parameters on averaged WJMSCs behaviour combining P4 and P9 cell culture data sets. Then, a parameter sensitivity analysis to allow the specific identification of 31 highly sensitive parameters; a parameters subset enabling us to distinctively describe P4 and P9 cell behaviours in a second step, as shown in a previous work [28], keeping constant the less sensitive parameters in exception ofvmaxresp(Table1), which was also modified for its direct high impact on cell energetics
(e.g., ATP-to-ADP ratio). Of interest, it can be noticed that for eight parameters (of 32), i.e.,vmaxAK, vmaxrASTA,vmaxCITS,vmaxCS,vmaxLDH,KmLDHPYR,kmAAtoSUCEILE, and al phaLDH
AMPATP, optimal values only differed by less than 15% when distinctively adapting the model to P4 and P9 cells.
However, the other 24 sensitive parameters (includingvmaxresp) needed to be significantly adjusted in the process of model adaptation. Therefore, only 24 parameter values needed to be modified to allow adapting of a 234 parameter model to either P4 and P9 cells. Differences in model parameter values between P4 and P9 cells, presented as supplementary data, were useful to further characterize the changes in behaviour comparing P4 and P9 cells, as discussed in the following sections. Model parameters were thus determined to minimize the global error between model simulations and experimental data. Therefore, the model simulations represent the optimal estimates of cells and metabolites concentration with time, considering the simplified reaction network under study. Also, it is important to note that all the model simulation curves shown in all figures were extracted from a unique time-solution of the model, and thus can be seen as occurring concurrently.
Table 1.Values of sensitive parameters according to cell passage.
Parameters Units P4 Cells P4 and P9 Combined P9 Cells P9 vs. P4
vmaxAAtoSUC mmol·10−6cells·h−1 6.20×10⁻⁴ 6.20×10⁻⁴ 1.34×10⁻² 22x vmaxAK mmol·10−6cells·h−1 1.87×10⁻⁴ 1.92×10⁻⁴ 1.94×10⁻⁴ idem vmaxAKGDH mmol·10−6cells·h−1 1.53×10⁻³ 1.53×10⁻³ 1.53×10⁻³ idem vmaxCITS mmol·10−6cells·h−1 9.42×10⁻⁴ 1.08×10⁻³ 1.11×10⁻³ 1.2x
vmaxCS mmol·10−6cells·h−1 9.45×10⁻⁴ 1.08×10⁻³ 1.10×10⁻³ 1.2x
vmaxgrowth h−1 8.57×10⁻² 6.97×10⁻² 4.26×10⁻² 0.5x
vmaxHK mmol·10−6cells·h−1 1.58×10⁻³ 1.00×10⁻³ 7.67×10⁻⁴ 0.5x vmaxLDH mmol·10−6cells·h−1 7.91×10⁻⁵ 8.80×10⁻⁵ 8.88×10⁻⁵ idem vmaxN ADPHox mmol·10−6cells·h−1 4.19×10⁻⁵ 5.33×10⁻⁵ 7.81×10⁻⁵ 1.9x
vmaxOCT mmol·10−6cells·h−1 1.35×10⁻⁴ 1.42×10⁻⁴ 9.89×10⁻⁵ 0.7x vmaxPDH mmol·10−6cells·h−1 1.63×10-03 1.17×10⁻³ 1.08×10⁻³ 0.7x vmaxresp mmol·10−6cells·h−1 7.09×10⁻⁴ 7.20×10⁻⁴ 1.20×10⁻³ 1.7x vmaxSDH mmol·10−6cells·h−1 1.39×10⁻³ 1.39×10⁻³ 1.39×10⁻³ idem vmaxASTA mmol·10−6cells·h−1 3.16×10⁻⁴ 3.16×10⁻⁴ 3.16×10⁻⁴ idem vmaxGLN mmol·10−6cells·h−1 1.79×10⁻¹ 1.79×10⁻¹ 1.79×10⁻¹ idem
KmAAtoSUCAKG mM 1.83×10⁻⁷ 1.00×10⁻⁷ 5.21×10⁻⁷ 2.8x
KmAAtoSUCEILE mM 3.00×10⁻¹ 3.00×10⁻¹ 3.35×10⁻¹ idem
KmAAtoSUCELEU mM 3.00×10⁻¹ 3.00×10⁻¹ 9.70×10⁻¹ 3.2x
KmAAtoSUCELYS mM 3.00×10⁻¹ 3.00×10⁻¹ 8.47×10⁻¹ 2.8x
KmAAtoSUCETYR mM 1.50×10⁻¹ 1.50×10⁻¹ 2.31×10⁻¹ 1.5x
KmAAtoSUCEVAL mM 5.00×10⁻¹ 5.00×10⁻¹ 2.49×10⁻¹ 0.5x
KmCSACCOA mmol·10−6cells 1.00×10⁻⁸ 1.00×10⁻⁸ 1.00×10⁻⁸ idem
KmHKEGLC mM 4.95 5.00 6.06 1.2x
al phaHKAMPATP / 1.05 1.10 1.28 1.2x
betaHKAMPATP / 6.27×10⁻¹ 1.05 1.69 2.7x
KmLDHPYR mmol·10−6cells 1.12×10⁻⁷ 1.08×10⁻⁷ 1.04×10⁻⁷ idem
al phaLDHAMPATP / 4.57×10⁻¹ 4.65×10⁻¹ 4.68×10⁻¹ idem
betaLDHAMPATP / 1.38×101 1.20×101 1.19×101 idem
KmPDHPYR mmol·10−6cells 4.06×10⁻⁷ 2.00×10⁻⁷ 2.00×10⁻⁷ 0.5x KmSDHSUC mmol·10−6cells 3.00×10⁻⁷ 3.00×10⁻⁷ 3.00×10⁻⁷ idem vgrowthATP mmol·10−6cells 1.19×10⁻² 1.19×10⁻² 1.19×10⁻² idem vgrowthADP mmol·10−6cells 1.19×10⁻² 1.19×10⁻² 1.19×10⁻² idem
2.3. P4 Cells Present a Faster Doubling Time than Late P9 Passage Cells
Cultivated under inflammatory conditions from 0 to 72 h, P4 WJMSC cells show a higher specific average growth rate of 2.36×10⁻²h−1(i.e., doubling time of 29.4 h) as compared to 1.36×10⁻²h−1 (i.e., doubling time of 51.0 h) for the late P9 passage cells (Figure3). Indeed, this difference in their growth rate is also captured in the model, with a maximum specific growth rate (vmaxgrowth) for P4 cells of two times that of P9 cells (Table1). From a similar inoculation of 0.0375×10⁶cells mL−1, P4 cells reached 0.205±0.029×10⁶cells mL−1at 72 h as compared to 0.1±0.026×10⁶cells mL−1for P9 cells. This result is in agreement with Kang et al. who observed a decreasing growth rate with an
increase of the passage number in human bone marrow mesenchymal stem cells and umbilical cord blood cells [33]. Both of the cell cultures were stopped at 72 h here, when P4 cells reached confluency.
Behavioral artifacts are generated when the cells reach confluency with dense cell-cell contacts.
Figure 3.Effect of cell passage on cell growth. (A) WJMSC cell population with time. (B) Insert graph presents model simulations of WJMSCs specific growth rates.•P4 WJMSC experimental data,•P9 WJMSC experimental data. Blue lines are for P4 cell simulations and red lines are for P9 cell simulation, with dashed lines indicating model extrapolations over the time of harvest of the cultures. Average data with Standard Error of the Mean (SEM) are shown forn= 3.
Interestingly, model simulations, which cope with both P4 and P9 cell growth trends, allow for further analysing the effect of the cell passage number on WJMSC cells. Indeed, it was first intriguing to question the model for potential limiting nutrients that could have limited the culture post-confluency since cell cultures were both simultaneously stopped when P4 reached confluency at 72 h. Model simulations were thus prolonged from 72 h until simulating growth cessations in both cultures, under speculative prolonged cultures with no cell confluency phenomena (model extrapolations are indicated as dashed lines in all figures). It was also possible to plot the cell specific growth rate with time (Figure3B). Values available from the same model simulations are shown in Figure3. The model thus estimates an initial specific growth rate of 2.5×10⁻²h−1after inoculation for P4 cells; a rate that continuously decreases until 60 h (μof 2.1×10⁻²h−1), then rapidly reaches growth cessation at 85 h. However, the specific growth rate for P9 cells starts at 1.24×10⁻²h−1, and then continuously decreases until 90 h (μof 2.1×10⁻³h−1), rapidly reaching growth cessation at 120 h. As indicated in Table2, the specific growth rates estimated by the model were similar to the values calculated from experimental data between 0 and 72 h for P4 and P9 cells. The nutritional limitation phenomenon, which is normally expected to cause growth arrest, has thus been addressed, and the amino acid tryptophan has been identified as the most probable limiting nutrient from model simulation and experimental results presented in Section2.8below.
Table 2.Experimental and model simulated specific growth rates.
Cells Experimental Data (h−1) Model Estimations (h−1)
P4 [2.4±0.3]×10−2 [2.1–2.5]×10−2
P9 [1.5±0.3]×10−2 [1.15–1.24]×10−2
2.4. P4 Cells Present a More Active Metabolism Than P9 Passage Cells 2.4.1. Glycolysis Pathway
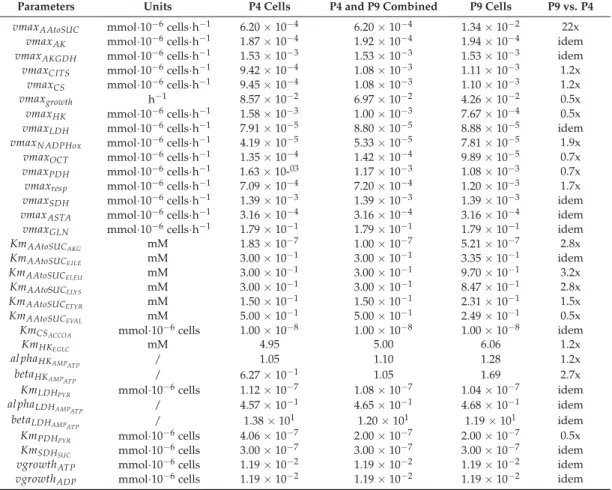
Extracellular glucose (EGLC) uptake, extracellular lactate (ELAC) production, and intracellular pyruvate (PYR), and phosphoenolpyruvate (PEP) concentrations were measured with time whereas glucose-6-phosphate (G6P), fructose-6-phosphate (F6P) and glyceraldehyde-3-phosphate (GAP) concentrations were estimated from model simulations (Figure4). Before 54 h, glucose consumption and lactate secretion behaviour followed similar trends for both P4 and P9 cells, calculated from experimental data and model simulation. However, according to model simulation of species concentration, the cell passage effect starts being observed from 54 h with EGLC and ELAC concentrations showing diverging trends comparing P4 to P9 cells. Indeed, from 54 to 72 h, an average specific glucose uptake rate of 3.4×10⁻⁴mmol·10−6cells·h−1was estimated for P4 cells as compared to 2.4×10⁻⁴mmol·10−6cells·h−1for P9 cells, whereas the average lactate specific production rates were of 5.8×10⁻⁴mmol·10−6cells·h−1for P4 cells and 5.6×10⁻⁴mmol·10−6cells·h−1, according to experimental data. Looking at intracellular metabolic intermediates of glycolysis, PYR concentration remained constant and at similar levels of 2×10⁻⁷mmol·10−6cells in P4 and P9 cells (Figure4H), while PEP cell concentration also remained constant but at distinct levels with 1×10⁻⁷mmol·10−6cells in P4 cells and 4×10⁻⁷mmol·10−6cells in P9 cells (Figure4G).
As mentioned above, a total of eight sensitive model parameters are part of glycolysis (Table1) and a subset of these required modification while adapting the model to P4 and P9:vmaxHK(×0.5), kmHKEGLC (×1.22), al phaHK
AMPATP (×1×1.22), betaHK
AMPATP (×1×1.22), vmaxLDH (idem),kmLDHPYR (idem),al phaLDH
AMPAT (idem) andbetaLDH
AMPAT (×0.86). Of interest, all of these parameters are exclusively related to the entry (HK) and the major output (LDH) of glycolysis. Despite P9 cells having avmaxHKreduced by 50% (Table1), all of the simulated glycolytic fluxes are similar to those for P9 cells the first 54 h (Figure5), from which a shift is observed in culture behaviour; a result which is clearly suggesting the primary role of cell energetics on flux regulation (Table S5, Supplementary Materials). Globally, glycolysis shows similar concentration behaviour from EGLC to PYR in P4 and P9 cells before 54 h, while the model simulates constantly decreasing fluxes, except for LDH, which stayed sTable at high levels in P4 cells, concurrent with cell growth. Thus, except for LDH, all other glycolysis fluxes show diverging trends with a more pronounced decrease in P4 as compared to P9 cells. P4 cells show a lower specific (i.e., normalized per 106cells) glucose uptake rate than P9 cells after 54 h, but a higher specific lactate production rate during the whole culture. However, due to their higher specific cell growth rate, P4 cells culture lead to a higher final decrease of glucose concentration in the culture medium. Thus, P4 cells show a more active glycolytic metabolism during the fast growth period (0–54 h) with a similar specific glucose uptake rate, while a higher lactate specific production rate. P4 and P9 WJMSC cells present a glucose uptake and a lactate production rates before 54 h that are twice those reported for CHO cells. Indeed, our results agree with those of Moya et al. [34] who observed a glycolytic metabolism in human MSCs (hMSC). Higher glycolysis was also observed when hMSC were plated at low densities versus higher densities, with lactate production to glucose consumption rates ratios of ~3 and ~1.8, respectively [35]. Higher ratios than 2 are attributed to the contribution of some amino acid metabolism, such as of glutamine in lactate production [36]. Furthermore, CHO cells show a glucose uptake rate of 1–2×10⁻⁴mmol·10−6cells·h−1and a lactate production rate of
~2×10⁻⁴mmol·10−6cells·h−1, according to our previous work [28,31] or to other studies [32,37,38].
Figure 4. Effect of cell passage on glycolysis and pentose phosphate pathways intermediates concentration. (A) Extracellular glucose concentration; (B) Extracellular lactate concentration;
(C) Glucose-6-phosphate concentration; (D) Ribose-5-phosphate concentration; (E) Fructose-6-phosphate concentration; (F) Glyceraldehyde-3-phosphate concentration; (G) Phosphoenolpyruvate concentration;
and, (H) Pyruvate concentration. Same conditions and symbols as in Figure3are applied.
Figure 5. Glycolysis fluxes of WJMSC. (A) Hexokinase flux; (B) Phosphoglucose isomerase flux;
(C) Phosphofructokinase flux; (D) Phosphoglycerate kinase flux; (E) Pyruvate kinase flux; and, (F) Lactate dehydrogenase flux. Same conditions and symbols as in Figure3applied.
Model simulations suggest that most of the glycolytic flux feeds pyruvate synthesis. Indeed, the pentose phosphate pathway (PPP) accounts for less than 1% of the total glycolytic flux (Figure6). From pyruvate, the metabolic flux is distributed either to lactate or to the TCA cycle. Interestingly, P4 cells direct more than 50% of their glycolytic flux to lactate production during the entire culture, whereas P9 cells show opposite behaviour with more than 50% of glycolytic flux feeding to the TCA cycle. These results highlight that P4 cells mainly have a glycolytic metabolism compared to P9 cells, which show an oxidative phosphorylation metabolism. P9 cells may also be undergoing senescence [35]. Of interest, model simulation results suggest that P9 cells have a higher demand on energy. This possible switch from a glycolytic to a respiratory metabolism may represent a valuable biomarker of the phenotypic transition that seem to occur with increasing cell passages. However, although the literature clearly identified a aerobic glycolytic metabolism as a character of immunosuppressive cells [39], further characterization of immunosuppressive WJMSCs is still required. Our results may simply confirm that P4 cells still express (but not significantly) immunosuppressive traits when compared to P9 cells.
Figure 6.Glycolysis flux distribution. (A) P4 cell culture; (B) P9 cell culture. Lactate production, TCA feeding, pentose phosphate pathways (PPP) feeding.
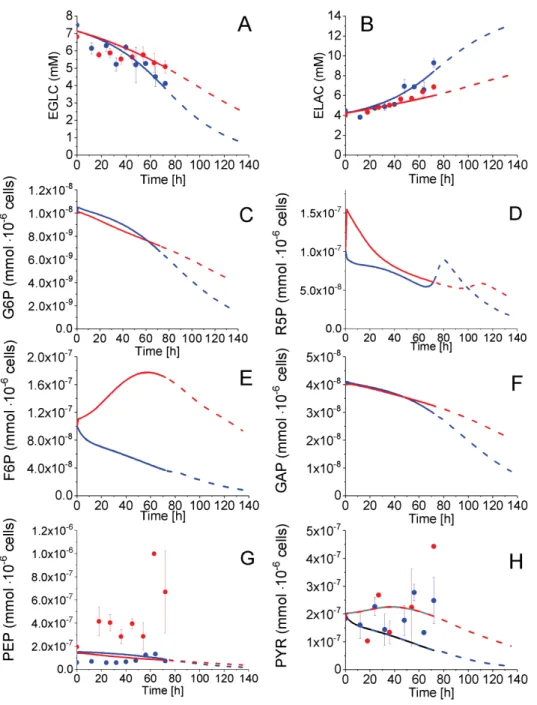
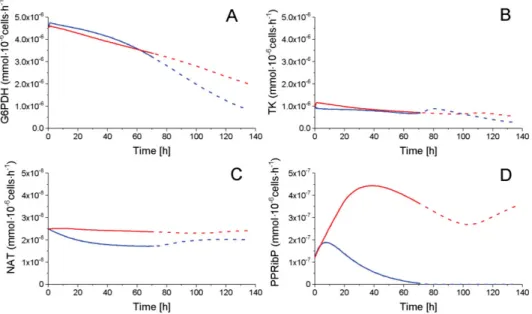
2.4.2. The Pentose Phosphate Pathway Is More Solicited in P9 Cells
The pentose phosphate pathways (PPP) is consuming a minor part of the glycolytic flux, as mentioned above, with a glucose-6-phosphate dehydrogenase (G6PDH) flux of
~10−6 mmol·10−6 cells·h−1 as compared to a glycolytic global flux of ~10−4 mmol·10−6 cells·h−1 for both P4 and P9 cells (Figure7). Ribose-5-phosphate (R5P), the only PPP intermediate, which cell concentration was quantified, shows a similar decreasing trend for both P4 and P9 cells (Figure4). The transketolase (TK) enzyme shows a similar decreasing trend for both P4 and P9 cells, and the reaction flux producing NAD from R5P (NAT) stayed constant for both conditions with, however, a higher value for P9 cells. Interestingly, phosphoribosyl pyrophosphate (PPRibP) activity is much higher in P9 cells with 2.5×10⁻⁷mmol·10−6cells·h−1, whereas it decreases in P4 cells at 80 h from an initial value of 12×10−7to 1.7×10⁻¹mmol·10−6cells·h−1. Of interest, the simulated G6PDH flux is similar in magnitude (~10−6mmol·10−6cells·h−1) to values reported in literature for CHO cells [31,37].
Figure 7.Fluxes of PPP. (A) Glucose-6-phosphate dehydrogenase flux; (B) Transketolase flux; (C) NAT flux; and, (D) Phosphoribosyl pyrophosphate flux. Same conditions and symbols as in Figure3 are applied.
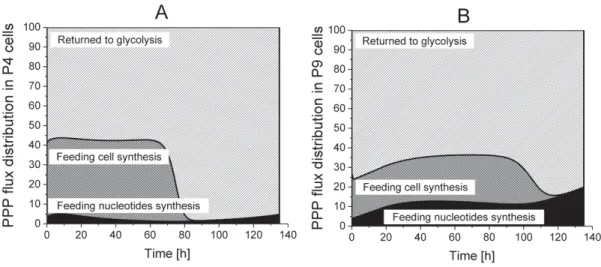
The analysis, by the use of model simulation, regarding the distribution of PPP fluxes to cell synthesis, nucleotides synthesis as well as returning to glycolysis, reveals that 55% of the incoming G6PDH flux returns to glycolysis in P4 cells, but this contribution reaches 65 to 75% in P9 cells, in their growth phase (Figure8). However, P4 cells direct a higher part of the PPP flux to cell synthesis as compared to P9 cells; a result agreeing with P4 higher specific cell growth rate observed experimentally.
P4 cells require around 40% of the PPP flux in their growth phase, whereas it reaches only 20% in P9 cells. Furthermore, P4 cells only need 3 to 5% of the PPP flux for nucleotide synthesis, which represents half of P9 cells requirements. PPP flux dynamics maintained a NADPH-to-NADP ratio of
~1 (Figure S1), which was similar to that observed in hMSCs [35].
Figure 8.Flux distribution in PPP. (A) P4 cell culture; (B) P9 cell culture. Returned to Glycolysis, Feeding cell synthesis, Feeding nucleotides synthesis.
2.5. P9 Cells Maintain a Higher TCA Activity
The impact of successive cell passages on TCA cycle activity was also studied. The cell concentrations in major TCA intermediates, such as malate (MAL), succinate (SUC), alpha-ketoglutarate (AKG), and fumarate (FUM) were measured while model simulation enabled the determination of citrate (CIT), succinyl-CoA (SCOA), oxaloacetate (OXA) concentrations, as well as the TCA precursor acetyl-CoA (ACCOA) (Figure9). SUC and AKG concentrations showed similar but specific behaviours in P4 and P9 cells. SUC concentration remained constant in both cultures at an average value of 3.3×10⁻⁷mmol·10−6 cells·h−1, increasing briefly from 54 h in P4 cells. In both conditions, AKG increased from 8.6×10⁻⁸to 1.3×10⁻⁷mmol·10−6cells·h−1at 54 h decreasing slightly thereafter. FUM concentration showed a similar increasing behaviour in both P4 and P9 cells, although maintaining a higher concentration in P4 cells. In the case of MAL, its intracellular concentration stayed higher in P9 as compared to P4 cells. In the simplified metabolic network described in the model, FUM is synthesized by succinate dehydrogenase (SDH) and also by argininosuccinate lyase (ASL), a combination that may explain a higher FUM concentration level in P4 cells due to a higher activity of ASL in the Urea cycle in P4 when compared to P9 cells. The concentration of non-measured metabolites were estimated from model simulation, with higher concentrations for all simulated TCA intermediates in P9 cells except for OXA. Higher amounts of TCA intermediates, which suggests a more active TCA cycle in P9 cells, agrees with the above-mentioned observation of a respiratory metabolism in these late passage P9 cells as compared to P4 cells.
Figure 9. Effect of cell passage on TCA cycle intermediates concentration. (A) Acetyl-CoA concentration; (B) Citrate concentration; (C) Alpha-ketoglutarate concentration; (D) Succinyl-CoA concentration; (E) Succinate concentration; (F) Fumarate concentration; (G) Malate concentration; and, (H) Oxaloacetate concentration Same conditions and symbols as in Figure3are applied.
Model simulated fluxes coming from glycolysis are of a magnitude of 10−4mmol·10−6cells·h−1, whereas TCA metabolic intermediates show a concentration magnitude of ~10−7mmol·10−6cells (Figure10). Therefore, a slight variation of a unique reaction flux can result in a high divergence of associated metabolite concentrations. Thus, this may explain the high sensitivity of model parameters involved in six TCA cycle reactions, such as pyruvate dehydrogenase (PDH), citrate synthase (CS), aconitase/isocitrate dehydrogenase (CITS), SDH, ASTA, and AAtoSUC. Interestingly, the changes in sensitive parameter values between P4 and P9 cells differ with the enzyme (Table1). Indeed, AAtoSUC enzyme has the most modified kinetics, with a maximal flux rate augmenting by a factor of 22×and its global affinity constant being augmented by a factor of up to 3 (Table1). Conversely, CS and CITS enzymes kinetics show the smallest variation with only×1.2 of their maximum reaction rate, and ASTA and SDH enzymes did not require any modification of their parameter values. Overall, all the model simulated fluxes of TCA show higher values in P9 cells as compared to P4 cells. This result can be attributed to the higher entry flux from pyruvate to the TCA and PDH enzyme in P9 cells, as well as
the non-accumulation of TCA intermediates in model simulations. However, the higher TCA activity of P9 cells did not lead to a higher growth rate compared to P4 cells, but most probably supported higher energy production and maintenance requirements.
Figure 10. TCA intermediates flux profile. (A) Pyruvate dehydrogenase flux; (B) Citrate synthase flux; (C) aconitase/isocitrate dehydrogenase flux; (D) Alpha ketoglutarate dehydrogenase flux;
(E) Succinyl-CoA synthetase flux; (F) Succinate dehydrogenase flux; and, (G) Fumarase flux; (H) Malate dehydrogenase flux. Same conditions and symbols as in Figure3are applied.
2.6. P9 Cells Exhibit a Higher ATP Turnover Rate than P4 Cells
Model simulation also allowed estimating the global ATP turnover rate. In agreement with an active TCA cycle, it is clear that the ATP turnover rate was higher in P9 cells, with a total ATP production rate starting from 4.9 × 10⁻³ and increasing at a sTable value of 6.2×10⁻³mmol·10−6cells·h−1(Figure11). Conversely, the ATP turnover rate in P4 cells regularly decreased from an initial value of 4.9 × 10⁻³ to 1.2 × 10⁻³ mmol·10−6 cells·h−1 at the end of the simulation.
Figure 11.Total ATP turnover rate of early and late passage cells. Same conditions and symbols as in Figure3are applied.
Among the major roles of the TCA cycle, the recycling of nucleotide shuttles that are fuelling ATP regeneration in the oxidative phosphorylation metabolism is a priority. Model simulations thus allowed questioning cell metabolism in order to determine the specific contributions of glycolysis, TCA cycle, and respiration on ATP turnover rate (Figure12). In glycolysis, PGK and PK fluxes contribute to ATP recycling, whereas in the TCA cycle, succinyl-CoA synthetase (SCOAS) and SDH are directly contributing in addition to the other reactions feeding proton shuttles to the oxidative phosphorylation reactions leading to massive ATP regeneration. In P4 cells, glycolysis accounts for more than 45%
of total ATP turnover while in P9 cells, ATP is mainly recycled via the oxidative phosphorylation metabolism. This difference in ATP turnover rate as well as its metabolic location may both represent efficient biomarkers of cell phenotypic loss with passages: early passage cells exhibit a glycolytic metabolism with a high lactate-to-glucose ratio, whereas late passage senescent cells show increasing respiratory metabolism. These results are in agreement with other works, suggesting that glycolysis is the main energetic support for healthy stem cells [40,41].
Figure 12. Distribution of ATP turnover origin between glycolysis, TCA cycle and oxidative phosphorylation. (A) P4 cell culture; (B) P9 cell culture. ATP production from glycolysis, ATP production from TCA cycle, ATP production from respiration.
In this work, energetic and redox nucleotides were quantified and simulated by the model, as concentrations (Supplementary Materials, Figure S1), as well as energetic ratios (Figure 13).
Interestingly, comparing nucleotide concentration showed no clear differences between P4 and P9 cells (Figure S1), but the analysis of nucleotide ratio reveals clear distinct behaviour with cell age.
In P9 cells, ATP-to-ADP ratio regularly decreases from 13.0 to 5.1, while this energetic ratio stays constant and at a lower level in P4 cells; between 2.3±0.6 to 4.8±3.2, as observed experimentally and simulated by the model. The AMP-to-ATP ratio in P9 cells, however, shows a constant slight increase from 2.6±0.5×10⁻²to 10.2±9.2×10⁻², but to a lower level than in P4 cells in which this ratio evolves with no clear trend between 2.9±0.3×10⁻¹and 1.5±1.1×10⁻¹. Interestingly, the simulation of the ATP-to-ADP ratio closely reflects experimental data, while the model simulation trends slightly differ from experimental values for the AMP-to-ATP ratio. The ATP and ADP concentrations agree with previous results in CHO cell lines [28,30,31], and lead to similar ATP-to-ADP ratio levels. However, the AMP concentration is five times higher in WJMSCs than CHOs with a value of ~5×10⁻⁷mmol·10−6cells. Taking the higher ATP-to-ADP ratio observed (and simulated) in P9 cells, results that are consistent with a respiratory metabolism, the expected low AMP-to-ATP ratio is observed (and simulated). Interestingly, both experimental ATP-to-ADP and AMP-to-ATP ratios tend to reach similar values at the end of the cultures, which coincided with P4 cell confluency and growth rate reduction (see above). Hardie et al. proposed a high AMP-to-ATP ratio as a marker of oxidative stress [42]. Moreover, they demonstrated that an oxidative stress could activate the AMP-activated protein kinase (AMPK), leading to the inhibition of ATP-consuming pathways such as glucose uptake, reduction of cell growth, and the activation of efficient ATP-producing pathways [43,44]. Thus, our results on the energetic nucleotides suggest the WJMSCs immunomodulatory phenotype can support a higher oxidative stress level, a hypothesis also supported by a glycolytic metabolism. However, the change of phenotype impedes P9 cells to support such oxidative stress level, which cause a switch from a glycolytic to a respiratory metabolism, as observed in this work.
Figure 13.Effect of cell passage on energetic nucleotides ratio. (A) ATP-to-ADP ratio; (B) AMP-to-ATP ratio. Same conditions and symbols as in Figure3are applied.
2.7. P4 Cells Show a Higher Urea Cycle Activity
The urea cycle activity is known to be modulated with the immunosuppressive activity [9,45].
In this work, although MLR data showed no significant differences in the immunosuppressive activity between P4 and P9 cells, in the sections above, our results have demonstrated distinct metabolic behaviours (Figure14). Indeed, P4 cells show a tendency towards expressing some immunosuppressive traits at higher levels than P9 cells when comparing glycolysis, TCA, and energetic behaviours.
Experimental data of extracellular arginine (EARG), urea, and nitric oxide (NO), as well as intracellular citrulline (CTR), show similar trends for both P9 and P4 conditions, although the concentration of ornithine (ORN) in P9 cells is increased as compared to P4 cells. The differences in behaviour were simulated by the model for ORN, while the model simulates slight differences of behaviour for the
other metabolites. Interestingly, simulations show a higher consumption of EARG and a higher production of NO and UREA in P4 cells. A high EARG consumption and NO production are markers of immunosuppressive activity [8,46]; it thus seems that the passage number effects overlaps with changes in the immunosuppressive phenotype. The rapid increase of citrulline from 72 h may be a consequence of the simplicity of description of this urea cycle sub-network, as well as growth cessation in P4 cells, a phenomenon reducing the cell consumption of intracellular metabolites. In the case of NO, we have previously shown such NO increase in bone marrow-derived MSCs in culture [34] is even more pronounced when the immunosuppressive function is strong. The slow increase observed and reported here may be due to the weak immunosuppressive trait of P4 and P9 cells.
Figure 14.Effect of cell passage on urea cycle intermediates. (A) Extracellular arginine concentration;
(B) Extracellular urea concentration; (C) Ornithine concentration; (D) Citrulline concentration; and, (E) Nitric oxide concentration. Same conditions and symbols as in Figure3are applied.
While ARGt activity in P9 cells remains higher and diverges from that in P4 cells, all other enzymes of urea cycle show a higher activity in the P4 cells when compared to P9 cells (Figure15).
Sensitive parametervmaxOCTdecreased 0.7x for P9 cells, but P4 OCT activity slightly and continuously increased with time while staying higher than in P9 cells. ARG1 and iNOS, on the other hand, exhibit a similar time-profile in both cells. ASS and ASL activities are higher in P4 cells before 80 h (i.e., at growth cessation), before reaching similar values than P9 cells. Thus, the urea cycle is more active
in P4 as compared to P9 cells, agreeing with higher consumption rate of EARG and production rate of NO, which are two known biomarkers of a cell immunosuppressive activity [8,9,39]. Thus, in agreement with above-mentioned results, P4 cells exhibit higher levels of known biomarkers of an immunosuppressive phenotype when compared to P9 cells with, however, clear evidence that the cell passage effect overlaps with that of immunosuppressive phenotype, such as a more pronounced NO concentration increase is observed in highly immunosuppressive MDC cells [8,9,39].
Figure 15. Urea cycle fluxes. (A) Arginine transferase flux; (B) Arginase-1 flux; (C) Ornithine carbamoyltransferase flux; (D) Inducible nitric oxide synthetas flux; (E) Argininosuccinate synthase flux; and, (F) Argininosuccinate lyase flux. Same conditions and symbols as in Figure3are applied.
2.8. P4 Cells Consume Less Tryptophan
Tryptophan metabolism is also well known as a key biomarker of an immunosuppressive phenotype [6,47]. Indeed, in agreement with our MLR data, experimental concentration data show a faster ETRP consumption in P4 cells (Figure16). P4 ETRP concentration continuously decreases, with model simulations suggesting this essential amino acid being a potential limiting nutrient of cell growth (from model simulations). At the opposite, KYN concentration increased during P4 and P9 cells growth, for decreasing from ETRP depletion (estimated from model simulations).
Interestingly, and as previously shown for other metabolic sub-pathways, model simulations allow for obtaining a clearer view on tryptophan metabolism. The model simulates a higher tryptophan specific consumption rate in P9 cells as compared to P4 cells (Figure17), although one can think the
opposite looking at TRYP concentrations (Figure16). P4 and P9 IDO fluxes both start at a similar value then decreases asymptotically to a zero value ~10 h before respective growth cessation. In the case of kynureninase (KOT) flux, both P4 and P9 cells also start at a similar value, and then increases in P9 cells until 60 h then decreases. KOT flux stayed at a constant value in P4 cells until ~40 h, then decreases with a similar trend as for P9 cells. For instance, and similarly to glucose consumption, P4 cells show a lower IDO activity but ETRP is consumed at a faster rate than for P9 cells due to a higher cell growth rate for P4 cells. This faster tryptophan depletion suggests that P4 cells behave similarly to macrophages that inhibit the T-cell response against maternal foetus [5]. This faster tryptophan depletion in P4 cells, that is a phenomenon representing a known biomarker of immunosuppressive phenotype, may seem contradictory with the higher tryptophan specific uptake rate in P9 cells. However, the immunosuppressive phenotype does not rely on an uptake rate, rather than on the maintenance of a low extracellular concentration in tryptophan. Therefore, in agreement with all data above, P4 WJMSCs show characteristics that are specific to immunosuppressive cells when compared to late P9 cells. However, this hypothesis has been showed to be clearly biased by the phenotype senescence phenomenon induced with cell passages and that is overlapping with the immunosuppressive phenotype.
Figure 16. Effect of cell passage on tryptophan consumption. (A) Extracellular tryptophan concentration; (B) Extracellular kynurenine concentration. Same conditions and symbols as in Figure3 are applied.
Figure 17. ETRP metabolism fluxes. (A) Indoleamine 2,3-dioxygenase flux; (B) Kynureninase flux.
Same conditions and symbols as in Figure3are applied.