Agility Quantification using Body Worn Inertial
Sensors
by
Chika U. Eke
B.S., University of Portland (2015)
Submitted to the Department of Mechanical Engineering
in partial fulfillment of the requirements for the degree of
Master of Science in Mechanical Engineering
at the
MASSACHUSETTS INSTITUTE OF TECHNOLOGY
June 2017
@
Massachusetts Institute of Technology 2017. All rights reserved.
A uth or . ...
...
Department of Mechanical Engineering
May 12, 2017
Certified by ...
.
...
.
....
Leia Stirling
Charles Stark Draper Professor of Aeronautics and Astronautics
Certified
Accepted
by
Thesis Supervisor
N.
v..
..
H
n.
Neville Hogan
Sun Jae Professor of Mechanical Engineering
Thesis Su ervisor
b y . . . .. . . . . .. . . . .
Rohan Abeyaratne
MASSACHUStMI~NSTITUTE OF TECHNOLOGYJUN 2
12017
Quentin
Berg Professor of Mechanics
Chairman, Graduate Program Committee
0o
w
Agility Quantification using Body Worn Inertial
Sensors
by
Chika U. Eke
B.S., University of Portland (2015)
Submitted to the Department of Mechanical Engineering
in partial fulfillment of the requirements for the degree of
Master of Science in Mechanical Engineering
at the
MASSACHUSETTS INSTITUTE OF TECHNOLOGY
June 2017
@
Massachusetts Institute of Technology 2017. All rights reserved.
Signature redacted
A uthor ...
of
E
... .
Department of Mechanical Engineering
Certified by ...
Signature redacted
May 12, 2017
Leia Stirling
Charles Stark Draper Professor of Aeronautics and Astronautics
Certified by
S
ignature redacted
Thesis Supervisor
Neville Hogan
Accepted by...
MASSACHUStMI~NSTITUTE OF TECHNOLOGYJUN 21017
0owj
Jae Professor of Mechanical Engineering
A~Tb
esi sk
Sinrvisor
Signature redacted
Rohan Abeyaratne
Quentin
Berg Professor of Mechanics
Chairman, Graduate Program Committee
K
1~~Agility Quantification using Body Worn Inertial Sensors
by
Chika U. Eke
Submitted to the Department of Mechanical Engineering on May 12, 2017, in partial fulfillment of the requirements for the degree of
Master of Science in Mechanical Engineering
Abstract
Agility is defined as the ability to quickly change speed or direction. Planned agility refers to the physical act of changing direction and reactive agility addresses the additional cognitive responses needed to react quickly to an external cue. This work specifically consid-ers reactive agility. Agility performance is often evaluated using time-based metrics, which provide little information about which factors aid or limit success. Two studies were com-pleted to identify key factors contributing to agility performance. The objective of the first study was to determine how novices and experts working in athletic, clinical, and military environments qualitatively and quantitatively evaluate agility performance. Thirty-three participants completed a survey which involved scoring 16 athletes on a 7 point Likert scale of not agile to agile. The spread of the scores indicated that even within groups, participants had different opinions about which aspects of technique contributed to high performance. Participant responses were used to link several terms to agility technique.
The objective of the second study was to apply these terms to the development of objective biomechanical metrics. An array of body-worn inertial sensors was used to calculate metrics that were sensitive to performance speed. Five metrics were defined (normalized number of foot contacts, stride length variance, arm swing variance, mean normalized stride frequency, and number of body rotations). Eighteen participants donned 13 sensors to complete a reactive agility task, which involved navigating a set of cones in response to a vocal cue. Participants were grouped into fast, medium, and slow performance based on their completion time. Participants in the fast group had the smallest number of foot contacts after normalizing by height, highest stride length variance, highest forearm angular velocity variance, and highest stride frequency after normalizing by height.These metric values translate to an efficient strategy for making turns by minimizing path length between cues and cones, effectively adjusting stride in reaction to turn points, and using tight pumping arm motions to aid in accelerating out of endpoint cones.The results of this study have the potential to inform the development of a composite agility score constructed from the list of significant metrics.
Study 1 informed the quantification of qualitative agility terminology and Study 2 mapped these terms to speed of performance. The outcomes from these studies can assist
in strategy development for training and rehabilitation across athletic, clinical, and military domains.
Thesis Supervisor: Leia Stirling
Title: Charles Stark Draper Professor of Aeronautics and Astronautics Thesis Supervisor: Neville Hogan
Acknowledgments
I would like to thank Professor Leia Stirling, without whom, this thesis would not have
been possible. I am grateful for all of the time she has spent meeting with me, teaching and mentoring me, as well as creating opportunities that have allowed me to develop as both an an engineer and a person. Her passion, enthusiasm, and general wealth of knowledge has been invaluable throughout my SM experience.
I want to deeply thank our collaborators at the University of Michigan not only for pro-viding the videos of the athletes on the obstacle course and performing the data collection, but also for their feedback on methodology and hypotheses during weekly meetings through-out the past year and a half. In particular I would like to thank Prof. Noel Perkins, Dr. Stephen Cain, Dr. Antonia Zaferiou, Mr. Steven Davidson, Dr. Lauro Ojeda, Ms. Rachel Vitali, Mr. Jon Mendicelli, Mr. Nathan Kossey, and Mr. Cody McKay.
I would also like to thank Professor Neville Hogan and the rest of the Newman Lab for
welcoming me into the group, providing insights during weekly lab meetings, and providing exposure to other biomechanics applications that have helped me to develop as an engineering student.
Thank you to the members of the Man Vehicle Lab, for their ideas, friendship, and support. I would especially like to thank: Alan Natapoff for discussions on the statistical analysis; My UROPs Aaron Huang, Solan Megerssa, and Alexander Danielsen-Haces for their work on data synchronization and GUI development for an additional project; Liz Zotos and Sally Chapman for providing advice and help throughout my stay at MIT; and my officemates Alison Gibson and Raquel Galvan-Garza for making our office a fun place to work.
The research presented in this thesis was supported by the US Army Natick Soldier Research, Development and Engineering Center (W911QY-13-C- 0011) and a National Sci-ence Foundation Graduate Research Fellowship under Grant No. 1122374. Any opinions, findings, and conclusions or recommendations expressed in this material are my own and do not necessarily reflect the views of the sponsors.
Table of Contents
1 Introduction 10
1.1 M otivation . . . . 10
1.2 Literature Review and Background . . . . 11
1.2.1 A gility Tasks . . . . 11
1.2.2 Measures of Agility . . . . 13
1.2.3 Methods of Biomechanics Measurement . . . . 17
1.3 Research Objectives . . . . 18
1.3.1 O verview . . . . 18
1.3.2 Specific Aim s . . . . 18
1.4 T hesis O utline . . . . 19
2 Study 1: User Study 20 2.1 B ackground . . . . 20
2.2 M ethods . . . . 20
2.2.1 Participants . . . . 20
2.2.2 Athlete Videos . . . . 21
2.2.3 User Study Experimental Protocol . . . . 22
2.2.4 Data Analysis . . . . 23
2.3 Hypotheses ... ... ... ... . .. ... .. ...24
2.4 Results and Discussion . . . . 25
2.4.1 Analysis of Qualitative Descriptions . . . . 25
2.4.3 2.4.4
Effect of Expertise on the Agility Score . . . . Comparison of Agility Scores with Forced Rankings
2.5 Limitations . . . . 2.6 Hypothesis Review
2.7 Summary . . . . .
3 Study 2: Metric Development 3.1 Background ... 3.2 M ethods . . . . 3.2.1 Participants . . . . 3.2.2 Experimental Protocol . . . 3.2.3 Metric Selection . . . . 3.2.4 Hypotheses . . . . 3.2.5 Data Processing and Metric
3.2.6 Statistical Analysis . . . . . 3.3 Results . . . . 3.4 Discussion . . . . 3.5 Limitations . . . . 3.6 Hypothesis Review . . . . 3.7 Summary . . . . 4 Conclusion 4.1 Research Summary 4.2 Contributions . . . 4.3 Future Work . . . . Appendix A Additional A. 1 Overview . . . . A.2 Metric Details . . .
Calculation Metrics Considered
. . . .
. . . .
. . . . . . . . 29 31 33 33 34 36 36 37 37 37 38 41 41 44 45 48 50 51 51 53 53 54 55 57 57 58 . . . . . . . .Appendix B
Appendix C
Appendix D
Appendix E
Appendix F
Full Obstacle Course
Sensor Characteristics
Survey Setup
Extended Survey Responses
Foot Contact Detection
65
66 67 68 77
List of Figures
1.1 Planned agility courses . . . . 12
1.2 Reactive agility courses . . . . 13
2.1 Selected reactive agility course . . . . 22
2.2 Average group scores for first and second video evaluation . . . . 29
2.3 Score 2 distribution between groups . . . . 30
2.4 Fourth spread of Score 2 . . . . 31
3.1 IMU placement . . . . 38
3.2 Torso heading angle . . . . 44
3.3 Distribution of metric values for speed groups . . . . 46
A.1 Cue and cone locations for a sample trial. . . . . 58
A.2 Torso heading angle profile . . . . 59
A.3 Sacrum acceleration magnitude . . . . 63
A.4 Representation of observed sacrum acceleration patterns for fast and slow perform ers . . . . 64
List of Tables
1.1 Metrics associated with planned and reactive change of direction (COD) 17
2.1 A gility Term s . . . . 27
2.2 Agility Term Frequencies Broken Down by Group . . . . 28
2.3 Chi-squared Statistical Results . . . . 32
3.1 Agility Metric Details . . . . 40
3.2 Speed Group Details . . . . 45
3.3 Agility Metric Statistical Results . . . . 47
Chapter 1
Introduction
1.1
Motivation
Agility, the ability to quickly change speed or direction [1], is a common consideration for success in athletic settings and has been anecdotally described as characteristic of the world's best team sport athletes [1,2]. Agility is also important in military domains, where warfighters need to make quick evasive maneuvers, and in clinical domains where patients traverse crowded environments [3, 4]. Two types of agility are discussed in literature -planned agility and reactive agility. Planned agility includes a course that requires the physical act of changing direction, where the person knows the course a priori and navigates a predefined path. Reactive, or unplanned agility, incorporates a cognitive component by involving perception and reaction to an external cue [5]. For reactive agility, the course is not pre-planned and direction changes are signaled during the navigation of the course.
Planned and reactive agility tests typically quantify agility performance using time-based metrics-primarily the time elapsed between crossing the start and finish line. While speed is important for agility, the parameter does not provide insights about strategy or technique, which enable identification of injury risk and areas of improvement. An athlete may traverse a course at high speed while putting himself or herself at risk for an Ante-rior Cruciate Ligament (ACL) injury. Additionally, without any feedback other than time
taken to complete a course, an individual may find it difficult to target specific aspects of their movement pattern that restrict them from reaching their full performance potential or progressing in a rehabilitation program. It is unclear from the literature whether additional measures should be considered beyond speed for assessing agility performance and which measures would be most appropriate. Insights about agility strategy and technique made in athletic, clinical, and military environments are typically obtained from experts that visu-ally assess agility tasks qualitatively. This thesis explores the potential to quantify agility using biomechanical metrics so that performance can be clearly monitored and the success of training methods can be determined.
1.2
Literature Review and Background
1.2.1
Agility Tasks
Multiple planned agility tests have been implemented for evaluation purposes. Three of the most commonly used tests are the T-Test, Illinois Agility Test, and 505 Test (Figure 1.1).
The T-Test, named for the shape of the associated course, requires 4 directional changes. The athlete runs from the start line to a cone 5 meters ahead, side steps to a cone 5 meters to the left of the center cone, side steps in the opposite direction to a cone 5 meters to right of the center cone, sidesteps from the right cone to the center once again, and backpedals to the start line [2]. The Illinois Agility Test is a timed task involving straight sprinting and weaving through 4 cones. The movement patterns resemble those applied to dodge opponents in soccer and rugby [6]. To complete the 505 test, which was originally designed for cricket players, athletes sprint forward from a start line, pivot 180 degrees and return to the start line [4].
A
B
.4 mw~ -.4rV
4
U X U09"/S
VOW"-giI
7
p
A
Figure 1.1 Planned Agility Courses [6]. A, T-Test. B, IllinoisTest
Agility Test. C, 505 Agility
Although these tests accurately replicate the sharp direction changes required in multiple athletic environments, they do not address the cognitive processes involved. Other tests have been developed that consider the reactive aspects of agility. Spasic et al. [71 designed a course, similar to the T-Test, for handball players that required participants to react to visual cues (Figure 1.2a). Light-emitting diodes (LEDs) placed within one of two cones lit up in a randomized order each time the participant crossed an infrared beam during the straight sprint. Athletes had to assess which cone was illuminated and shuffle to that cone as quickly as possible. Additional reactive agility tests have assessed anticipation skills and
SH
S"-C
I-B
10M SMdecision time using stimuli provided in real-time by another person or through a video clip of an athlete performing a set of sport-specific movements [5,8]. Sekulic et al. [9] developed a reactive agility course that permitted evaluation of variation in cutting angle, while enabling flexibility in running technique (side stepping not required), and was distinct from other courses by requiring athletes to come to an abrupt stop and accelerate out of breakpoints (Figure 1.2b).
A
B
MC
start line
Figure 1.2 Reactive Agility Courses [7, 9].A, Reactive test developed by Spasic et al. B, Reactive test developed by Sekulic et al. Both courses included visual cues in the form of LEDs within cones, triggered once an infrared sensor detected motion
(MC - microcontroller, JR - infrared sensor).
1.2.2
Measures of Agility
A majority of the literature discussing agility tasks has relied on time through an agility
course as the agility measure. Sekulic et al. [9] found that the performance times for their reactive agility course differentiated college-aged athletes involved in agility-saturated sports (soccer, basketball, handball, volleyball) from those not involved in agility-saturated sports (gymnastics, dance). Spasic et al. [7] used performance time to create a
perceptual-reactive-W
...
-
-
---B
0
A
D
4&IR
"C
Start W*
B
capacity index (the ratio of completion time for the reactive version of the course divided
by completion time of the planned version of the course). This index was examined with
the hypothesis that it would distinguish defensive handball players from offensive handball players. The results of the study supported the hypothesis that defensive players, who regularly react to opponents' actions, have a better perceptual-reactive-capacity index than offensive players, who primarily perform planned changes in direction.
Previous studies have also explored particular components of technique (e.g., straight sprinting performance, leg strength, and power qualities) and their correlations with planned agility course time [10-13]. Tsitkaris et al. [10] designed a study to investigate the influences of balance, speed, and power on agility performance for male and female college students. Power was measured using a squat jump test. Balance scores were recorded after partici-pants completed a dynamic balance assessment during which they viewed a moving cursor and adjusted their center of mass in response while standing on a moveable platform. Speed was captured during a 10 meter and 20 meter straight sprint. The investigators calculated correlation coefficients between speed, balance, and power test scores and the time to com-plete five planned agility tasks. Their findings indicated that female participants had power values that were associated with time to complete two of the five agility tasks. They found that the agility performance of male participants was significantly related to their dynamic
balance test scores.
In an examination of agility in college-aged male physical education students, Markovic et al. [12] selected leg extensor strength qualities as predictors. These qualities consisted of: explosive strength (vertical jump and countermovement jump tests), elastic strength (drop jumps), and maximal strength (squat jumps). The course time for three agility tests formed the agility performance metric. After completing a regression with three strength factors as predictors and an agility factor as the criterion, the researchers concluded that leg extensor strength qualities are poor predictors of agility performance in physically active men.
In addition to power and strength, muscle activity has been explored as a predictive mea-sure for agility performance. Spiteri et al. [5] compared the differences in muscle activation
strategy employed when performing two consecutive agility movements. Electromyography
(EMG) of six muscles in the dominant leg was recorded using wireless surface electrodes.
Participants completed sharp cuts over force plates to the left or right of a projection screen presenting a visual stimulus. Decision time was quantified during agility trials as the time between the presentation of a video clip alerting a participant to change direction and the participant's first foot strike initiating a change of direction. The investigators concluded that faster agility performance was associated with more pre-heel strike activity and greater anterior activation during stance phase for the rectus femoris, vastus medialis, and biceps femoris muscles. This muscle activity increased hip and knee extension, leading to a greater propulsive impulse. They also observed that longer decision times during one of the direc-tional changes led to greater activation of the anterior muscles and body deceleration while movement direction was determined.
Some studies have analyzed the mechanics of movement when reacting to a cue for slow direction changes [14-16]. These studies were reviewed for their potential to provide insight into biomechanical measures that may set planned and reactive agility performance apart. Ashburn et al. [14] compared the ability of adults with and without Parkinson's disease to complete 180 degree turning-on-the spot when cued and found both groups had initial head movement followed by eyes, head, shoulders, feet. Patla et al. [15] examined whole body turning kinematics while walking at a self-selected pace with visually cued turns and found that two mechanisms were used to move the center of mass in a new direction:
(1) foot placement (more common for planned movements) and (2) trunk roll about the
hip joint in the frontal plane. Houck et al. [16] evaluated frontal plane trunk and lower extremity adjustments during anticipated and unanticipated walking to detect ACL injury risk. Anticipation affected participant hip and knee adduction, which was speculated to increase the likelihood for the knee to enter the injury prone valgus position. These studies were performed at lower speeds than the quick cuts exercised in athletic and military settings, but highlight that reactive tasks can drive differences in how one performs the motion.
change of direction ability of athletes and soldiers performing in higher speed environments. In an evaluation of male collegiate soccer players, Sasaki et al. [17] discovered that forward angular displacement of the trunk was positively correlated with a cutting task similar to the 505 agility test. It was proposed that optimal inclination angles may exist that directly affect change of direction performance. Marshall et al [18] recruited gaelic hurling players to complete a 75 degree cut over a force plate. Biomechanical factors including peak ankle power, range of pelvis lateral tilt, peak ankle plantar flexor moment, and ground contact time were associated with cutting time. Kim et al. [19] studied the biomechanical factors contributing to anticipated and unanticipated side cutting maneuvers in middle school male soccer players. The findings of this study revealed that knee flexion and time to peak ground reaction force were greater for the unanticipated condition. Failure to anticipate alters the external moments applied to the knee due to the reduced time to implement postural adjustment strategies. McGinnis et al. [20] evaluated sacrum kinematics for a slalom run course completed using a belt-worn inertial measurement unit (IMU). Two groups were identified that demonstrated unique movement patterns to negotiate the turns. One group was characterized by greater forward tilt of the pelvis, as well as alignment between the anterior direction of the pelvis and the instantaneous direction of travel. These technique differences did not result in significantly different course completion times, indicating that multiple techniques could contribute to high agility performance.
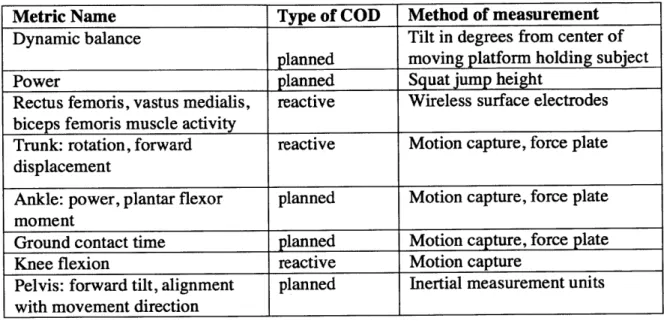
A summary of the measures that have been shown to be correlated with planned and
reactive changes in direction is given in Table 1.1. The findings of these studies highlight potential differences in planned and reactive agility tasks. These studies also confirm the feasibility of defining kinematic measures for agility performance and provide a range of current measures that may inform additional metrics that capture agility technique.
Table 1.1 Metrics associated with planned and reactive change of direction (COD)
Metric Name
Type of COD
Method of measurement
Dynamic balance
Tilt in degrees from center of
planned
moving platform holding subject
Power
planned
Squat jump height
Rectus femoris, vastus medialis,
reactive
Wireless surface electrodes
biceps femoris muscle activity
Trunk: rotation, forward
reactive
Motion capture, force plate
displacement
Ankle: power, plantar flexor
planned
Motion capture, force plate
moment
Ground contact time
planned
Motion capture, force plate
Knee flexion
reactive
Motion capture
Pelvis: forward tilt, alignment
planned
Inertial measurement units
with movement direction
1.2.3
Methods of Biomechanics Measurement
Human biomechanics is often quantified using 3D motion capture systems (mocap), which typically incorporate reflective markers tracked by infrared cameras. The advantages of mocap are that it allows researchers to analyze kinematics in a relatively standardized manner for a variety of applications. However, mocap involves extensive processing time, requires data collection to take place in a fixed volume, and can have marker occlusions limiting potential analyses. Another method for quantifying human biomechanics is the use of IMUs, which extend the tasks and environments that may be assessed. IMUs are particularly useful for agility evaluation which can benefit from taking place outdoors for military training and field sports. A limitation of IMUs is the drift error that occurs as a result of integrating raw acceleration or angular velocity values over time. Accelerometer data can be fused with angular velocity data in Kalman filters to help address this problem [21]. Other methods used for drift correction are zero velocity updates or updates at times within a course when position is known if trajectories are being estimated. An alternative approach
to preventing drift error is to avoid integration altogether and create metrics that use raw sensor data.
1.3
Research Objectives
1.3.1
Overview
This thesis addresses two aspects of reactive agility performance evaluation. It first explores the effect of different user groups on qualitative and quantitative agility assessment. As discussed in Section 1.1, insights about agility strategy and technique made in athletic, clinical, and military environments are typically obtained from experts that visually assess agility tasks. The large range of measures that have been explored experimentally (Section 1.2.2) emphasize that different experts may assess agility differently. Determining the key terms experts use to define athlete agility level may identify new parameters for assessing agility technique. The new parameters may be more aligned with operational interpreta-tion of agility than the measures already examined in the literature. Formalizing expert terms may also extend previous studies that have found weak correlations when comparing agility performance to course time, enabling the identification of performance strengths and weaknesses.
This thesis also discusses the application of expert terms to the development of biome-chanical metrics that are sensitive to the speed of agility task performance. All of the
metrics we propose map to common terms highlighted by athletic, clinical, and military experts while evaluating videos of agility performance. These metrics are applicable for training across these domains and may provide improved understanding of technique and in the future could be related to injury risk mechanisms.
1.3.2
Specific Aims
Aim 1: Determine how experts evaluate agility and identify key terms defining optimal agility technique.
Aim 2: Derive biomechanical metrics to quantify reactive agility technique using an array of body-worn IMU sensors.
1.4
Thesis Outline
These specific aims are addressed with the following structure:
Chapter I. Introduction - This chapter presents the motivation, literature review, re-search objectives, and specific aims of the thesis.
Chapter II. Study 1: User Study - This chapter explains the methods, results, and discussion for the study of clinical, military, and athletic evaluations of agility performance. Chapter III. Study 2: Metric Development - This chapter explains the methods, results, and discussion related to the derivation of biomechanical metrics using IMUs.
Chapter IV. Conclusion - Concluding remarks on the research and its contributions are made in this chapter, and suggestions for future research beyond the scope of this thesis are offered.
Chapter 2
Study 1: User Study
2.1
Background
It is unclear from the literature whether additional measures should be considered be-yond speed for assessing agility performance. Insights about agility strategy and technique made in athletic, clinical, and military environments are typically obtained from experts that visually assess agility tasks. The objective of this study was to determine how experts evaluate agility and to identify key terms defining agility performance. The metrics identi-fied may enable a focused examination of new parameters for assessing agility technique and extend previous studies that have found weak correlations when comparing to solely course time, enabling the identification of performance strengths and weaknesses.
2.2
Methods
2.2.1
Participants
The study was completed by 33 adults (mean age 30 years, SD=9 years; 16 female). Participants were recruited within an expert group- athletic (n=8), clinical (n=7), military
(n=8)- or novice group (n=10) based on their experience evaluating human performance. Expert groups were familiar with formal training and evaluation guidelines within their
field. The novice group had no previous knowledge of formal guidelines. The athletic group
consisted of coaches specializing in football, rugby, soccer, field hockey, tennis, and track. The clinical group consisted of physical therapists. The military group included experienced members of Air Force and Army Reserve Officers' Training Corps (ROTC).
2.2.2
Athlete Videos
Expert and novice participants were asked to analyze videos of athletes completing a reactive agility obstacle. These videos were obtained from a previously collected data set. The reactive agility obstacle (Figure 2.1) was a sub-set of the obstacles performed by the athletes (see Appendix B for full course). To complete the obstacle, athletes (n=16) ran from the start line to an endpoint, touched the top of the endpoint cone, ran back to the start line, and turned around to repeat these actions for three more endpoints as quickly as possible. Endpoints were vocally announced each time the athletes crossed the cue line. Athletes were not provided a strategy on how to complete the task. Half of the athletes completed the reactive agility obstacle 6 times, while the other half completed this obstacle 3 times. The same 3 obstacle paths were traversed by all athletes. Written consent was provided
by each athlete and procedures were approved by the University of Michigan IRB and the
MIT Committee on the Use of Humans as Experimental Subjects (COUHES). Athletes were compensated up to $50 for their participation. The videos were parsed and the reactive agility videos of the athletes on their second and third runs through the obstacle were used within the user study. Videos were de-identified by blurring participant faces using Adobe After Effects software. Athlete videos were categorized as slow, medium, or fast based on the time it took them to complete the course. Videos were shown at real-speed and not normalized for time.
4g4
CU*!
start line
Figure 2.1 Reactive agility course adapted from Sekulic et al [9]. Athletes received verbal cues at the location notated and touched 4 endpoint cones (30 cm tall) per trial.
2.2.3
User Study Experimental Protocol
Procedures for the user study were approved by the MIT COUHES and all participants provided written consent. Participants received up to $20 in compensation. Participants completed an online agility evaluation survey consisting of 4 parts (Appendix D). Part 1 was a short answer question asking for any terms or definitions that the participant associated with agility performance. Part 2 presented the videos showing the 16 athletes completing their second time through the reactive agility course. Participants were asked to score each athlete's video on a Likert scale ranging from 1 (not agile) to 7 (very agile). Each video was approximately 45 seconds long and was presented on a new page of the form in a randomized order. Participants took a 10 minute break after the first 16 videos. The second set of 16 videos showed the athletes completing their third time through the reactive agility course and were presented in mirrored order, without informing participants of the repetition of athletes. There was an option to take a 5 minute break before beginning Part 3 of the survey, which requested a ranking of agility performance. Two sub-sets of 5 videos from the group of 16 athletes were arranged on the same page and participants ranked each set of videos from most agile to least agile. Both sub-sets contained a mixture of videos
from the first and second set of athlete videos. The first sub-set of 5 videos included the performance of 1 fast and 4 medium speed athletes. The second sub-set contained 1 fast,
1 medium, and 3 slow athletes. The sub-sets grouped athletes with similar performance
times together, placing predominantly fast and medium speed athletes in the first group and predominantly slow and medium speed athletes in the second group. The grouping was done this way to encourage participants to think about factors other than time when determining rankings. Participants were not asked to rank all videos because the representative selections in the sub-sets met the goal of identifying whether technique was being used to differentiate athletes with similar performance times. Both the scoring and ranking sections of the survey prompted participants to provide explanations for their selections. Part 4 of the survey provided space for further explanation if the participant's definition of agility had changed based on watching the videos. Survey completion time ranged from 1 to 2 hours.
2.2.4
Data Analysis
A Wilcoxon Signed Rank test was used to evaluate difference in rater score between first
and second videos for the athletes. A paired t-test was used to assess difference in course completion time between the first and second videos for the athletes. A Kruskal-Wallis
test was used to evaluate differences in score between groups. Differences between rankings as determined through scores and explicit ranks were determined with a Chi-squared test. The fourth spread of the scores was calculated for each video to quantify variability. This calculation involved ordering the observations of data from smallest to largest and subtracting the median of the lower half of the data from the median of the upper half of the data. The fourth spread was chosen as an alternative to standard deviation because of its use of median values instead of mean values, which is more appropriate for Likert scale data [22].
A qualitative analysis was performed to identify the most common descriptors for agility
performance. An initial list of terms to describe commonly used phrases in the survey explanations was developed by a first pass through of the qualitative data. Subsequent passes through all terms were made to assess if a phrase by a rater aligned with a term, or if
a new term needed to be generated. Similar terms or phrases were combined and the coding scheme was refined upon follow-on passes through the terms. Frequencies for each term were assessed as the number of participants who used it.
2.3
Hypotheses
In this thesis, we consider how agility is characterized by athletic, clinical, and military experts when viewing the same task and group of participants. Variations in environment and performance expectations for each area of expertise may drive differences in qualitative assessment. For example, a physical therapist may place less emphasis on speed than a soccer coach, given a desire for patients to develop healthy movement patterns rather than react quickly to an external cue. Further, we anticipate that even though all experts were trained in their discipline, there may be variability within as well as across disciplines based on different specialties or sub-specialties.
To extend the understanding of agility performance beyond speed-based measures, this study investigated how videos of athletes with comparable speeds were ranked. Rankings using internal reference frames (a Likert score) and forced reference frames (explicit ranks) were considered. Maio et al. [23 discussed the potential differences between the two, high-lighting that rankings of ethical acceptability of behaviors using scores were more correlated with a priori predictions than explicit ranks. The investigators argued that explicit rank-ings may cause participants to make unimportant distinctions that would not have been made otherwise. However, the additional distinctions explicit rankings may generate by forcing participants to be more detail-oriented may be particularly useful for assessing hu-man perforhu-mance. We included both ranking methods in order to further evaluate these relationships.
In this study, we hypothesize that (1) agility scores are consistent between viewings of the same athlete; (2) the definition of agility differs by expert background; (3) assessments within group are similar; (4) the rankings assessed through a forced reference frame differ from an internal reference frame.
2.4
Results and Discussion
2.4.1
Analysis of Qualitative Descriptions
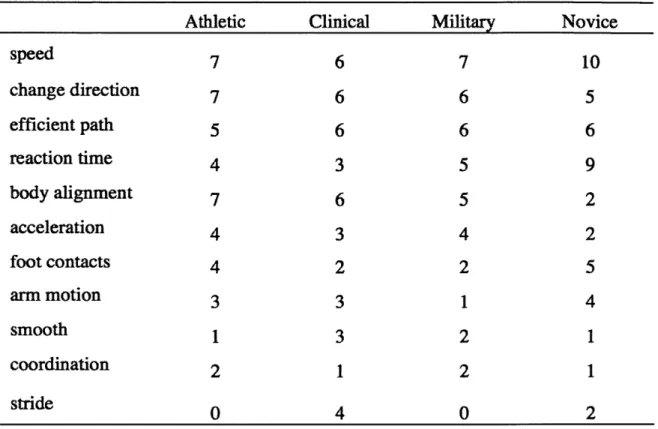
The survey responses (Tables 2.1 and 2.2, Appendix E) demonstrated that participants evaluated agility most frequently using terms related to athlete speed and ability to change direction, which aligns with the definition of agility found in literature [1]. Examples of phrases coded as speed and change of direction were "time through the course" and "sharp movements when cutting and turning". The next frequently used term, "efficient path" is closely tied to the ability to change direction. Several raters commented that an athletes ability to cut his or her body "quickly in the given direction without requiring any arcing paths to get there" was important. The efficient path term is distinct from the change of direction term as it highlights a particular strategy for making the turn, specifically the ability make precise turns towards the desired endpoint by minimizing path length. The high frequency of performance speed was supplemented by the term "reaction time," which is a focus on the response time after cue calls. Experts repeatedly mentioned decision-making in their responses, which highlights the importance of cognitive performance in the agility task. Their comments align with the agility definition provided by researchers such as Spiteri et al. [5], which discuss the correct identification and rapid interpretation of environmental cues in addition to changing direction. Another term that emerged from the survey responses was "body alignment," which included comments such as lowering the center of mass while bending at the knee and hip joints. Participants suggested that a proper body alignment enabled athletes to make sharp changes in direction, burst out of the course's breakpoints, and decelerate with full control. While related to speed and direction change, acceleration was categorized as a separate term as locations within the course could be performed using a constant speed direction change. Expert comments related to acceleration during the course provided additional information on strategy. Foot contacts provide additional information on athlete technique, with a given body speed having the potential for few or many contacts. Experts noted that athletes with good footwork minimized the amount of steps taken to make
a turn and used "short, quick steps" or "good stutter stepping". They also mentioned that tight pumping arm motions aided athletes in changing direction and maintaining stability. Those that did not adequately pump their arms appeared to be less energetic. A smaller frequency of participants mentioned the value of making smooth movements, which may contradict with the stutter stepping strategy, efficient path, and abrupt body movements contributing to quick changes in direction.
In the last section of the survey, participants were asked to discuss whether the definition they provided for agility at the beginning of the survey had changed after viewing the videos. While many novices explicitly noted they adapted their definition (n=8 of 10), fewer participants made this explicit assessment in the expert groups (n=3 out of 8 athletic experts, n=3 out of 7 clinical experts, and n=2 out of 8 military experts). It was expected that novice definitions would experience the most change given their lack of exposure to formal agility evaluation methods. Some experts commented that while their general view of agility remained the same, the factors they considered to contribute to this view were dependent on the selected drill and were easier to articulate after reviewing the videos. For example, one expert in the athletic group expanded on his initial listing of speed and body control at the start of the survey to include "sharp, quick turns with the subject accelerating out of the turn using their arms". Other experts mentioned a new consideration of "bend in the knee and hip to allow twist and drive" to quantify readiness as well as the "accuracy of movement pathway".
Table 2.1 Agility Terms
Example Phrase
quickness, foot speed and time through the course cutting, pivoting efficient path reaction time body alignment acceleration foot contacts arm motion smooth coordination stride
arcing paths, distance from cone on turns
good reflexes, responds to commands in timely manner lowering center of gravity in and out of numbered breakpoints, bends well at the knees giving her sharpness changing direction quick starts and stops, acceleration out of turns
unnecessary steps before breakpoints, double footed turns, long foot contacts
she is not using her arms fully, can use arms more to pump very smooth runner, fluid movements
disjointed, legs trunk and arms all coordinated in the position changes
long strides and at a good speed, shorter stride length and accurate change of direction
Term speed change direction Frequency 30 24 23 21 20 13 13 11 7 6 6
Table 2.2 Agility Term Frequencies Broken Down by Group
Athletic
Clinical
Military
Novice
speed
7
6
7
10
change direction
7
6
6
5
efficient path
5
6
6
6
reaction time
4
3
5
9
body alignment
7
6
5
2
acceleration
4
3
4
2
foot contacts
4
2
2
5
arm motion
3
3
1
4
smooth
1
3
2
1
coordination
2
1
2
1
stride
0
4
0
2
2.4.2
Effect of Viewing Number on the Agility Score
Higher scores were provided by the clinical (Z = 2.603, p<.01), military (Z = 3.229, p<.01,), and novice (Z = 1.961, p<.05) groups for the second set of videos than for the
first set (Figure 2.2). This result does not support Hypothesis 1, that scores would remain consistent during both evaluations of the same athlete. There was no significant difference in athlete time through the course for the two videos shown in the survey (t = 1.103, p=.282).
Differences in scoring may be due to participants having been unable to gauge the range of athletic skillset in performance before beginning the survey and therefore they relied on an internal representation of performance. Clinical, military, and novice groups may have adjusted their internal reference after the first set of viewings. The updated clarity in
definition mentioned by participants at the end of the survey (Section 2.4.1) aligns with the difference in Score 2 observed for some groups. As the selected reactive agility task was from the athletic literature, there is a possibility that the athletic group was more familiar with assessing agility with similar tasks, creating a more informed initial representation that was not adjusted to a significant level. This difference in scoring for some groups informed the decision to assess within and across group differences using Score 2 for further analysis.
7
*
*
*
6
5
4
"Eval 1
3Eval 2
*p <.052
Athletic Clinical Military Novice
Figure 2.2 Average group scores for first and second video evaluation. Scores ranged from
1 (low agility) to 7 (high agility). The asterisks (*) represent Wilcoxon Signed Rank test results with p-values below .05
2.4.3
Effect of Expertise on the Agility Score
Score 2 was only significantly different between groups for one video (Video 2, X2
10.055, p < .05) (Figure 2.3). This outcome does not support Hypothesis 2, which states
that the definition of agility differs by expert background. What was observed was variability even within groups. The scoring disagreement between groups for Video 2 stemmed from the athletes good technique but slow pace, according to the scoring explanations provided by the participants. While speed was one of the most popular metrics considered to contribute to agility (see Table 2.1), some groups gave more weight to metrics related to strategy. The
explanations provided by the clinical group for Video 2 as well as the trend of higher scores from this group despite the athlete's slow pace, indicated that clinicians prioritized metrics that were independent of speed such as efficient turns and skillful footwork (foot contacts and stride) to cut in the proper direction. Conversely, the trend of low scores for Video 2 from athletic group evaluators can be interpreted as heavier penalties for the low speed of the performance.
Trends from Figure 2.3 indicate that videos 6, 10, and 12 received the highest median scores from each group. The comments made by participants for these videos were in agree-ment about fast pace and good technique contributing to high performance. Participants specifically mentioned that these 3 athletes had fast reaction times, made quick turns, and lowered their center of gravity to touch the cones.
7- 6- 5-3-. 2-I-~ *|n 0 l 1 ; I 4 I I I 12 3 4 567 0 * i I 8
9
Vio 10 11 12 13 14 15 18 *cicai * p <.05Score 2 distribution between groups. Scores ranged from (high agility). The asterisks (*) represent Kruskal-Wallis values below .05
1 (low agility) to 7
test results with
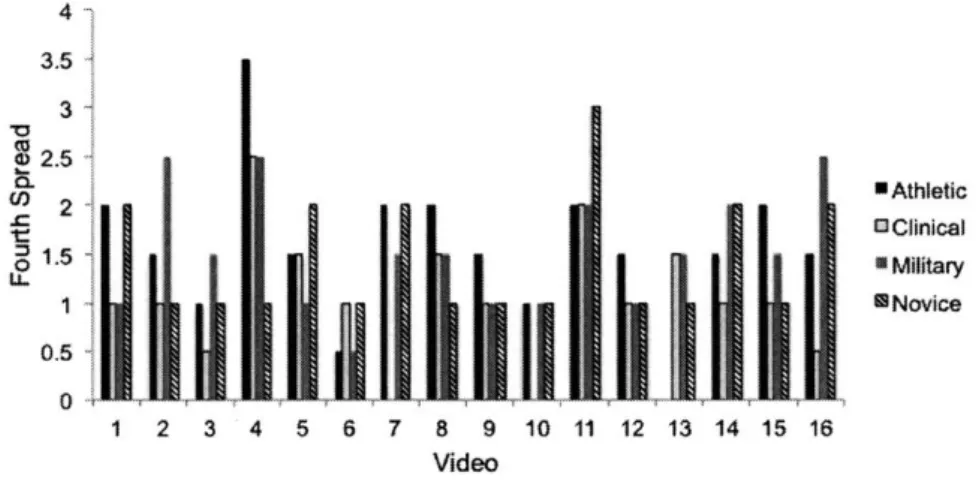
p-The spread of responses within groups fluctuated by video presented and was largest for the athletic and novice groups (Figure 2.4). The spread in novice users is likely a result of individuals without basic training with which to guide their evaluations. However, the
results for the athletic group do not support Hypothesis 3 which states that assessments within group are similar. While athletic-driven agility courses are used across multiple sports, individual sports may still value different components of agility performance. The variation in athletic group scoring may arise from our inclusion of a variety of sports. For example, the athletic group consisted of coaches from sports such as such as soccer and tennis, which differ in required skillset. Large fourth spreads were observed across most groups for the evaluation of videos 4 and 11. Participants commented that the athletes in these videos were fast but had poor technique. There were disagreements within groups about what constituted poor technique, with some evaluators mentioning poor posture, while others discussed slow decision making and a lack of coordination. This variability in responses implies that even within groups, participants had different opinions about which aspects of technique contributed to high performance. Additionally, the variability in the rating of a fast athlete indicates that speed alone does not make an individual agile.
4 3.5 3 2.5 Athletic 2Clinical "~~~~ UNA~ Military 2
~
*
Novice
1 2 3 4 5 6 7 8 9 10 11 12 13 14 15 16 VideoFigure 2.4 Fourth spread of Score 2 within groups for each observed video.
2.4.4
Comparison of Agility Scores with Forced Rankings
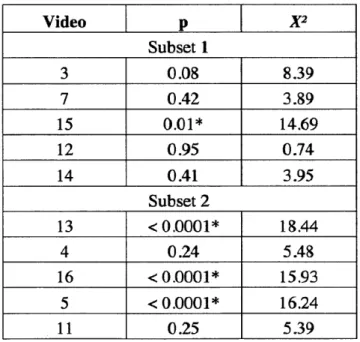
Hypothesis 4 examined if the ranking created by pooling scores for each athlete was different from the explicit ranking completed in Part 3 of the survey. The Chi-squared test results revealed that significantly different (p <.05) rankings were provided for 4 out of the 10
athletes evaluated using both methods (Table 2.3). It is important to note that participants were forced to give different explicit ranks for each athlete while the scoring section of the survey permitted ties. The difference in ranking procedure is one possible source of variability in these two ordering methods. It was also observed that the 4 athletes with different rankings were either classified as medium speed out of the possible fast, medium, and slow categories or had speeds that were approximately equal to other athletes with which they were ranked. In these cases, the difficulty in discerning performance by speed alone likely drove participants to consider technique in ways that may not have been considered when scoring athletes individually. The forced rankings provide additional support that participants had varying internal valuations on the metrics for evaluating athletes.
Table 2.3 Chi-squared Statistical Results. The asterisks
0.05.
(*) represent results with p below
Video p X2 Subset 1
3
0.08
8.39
7
0.42
3.89
15
0.01*
14.69
12
0.95
0.74
14
0.41
3.95
Subset 213
<0.0001*
18A4
4
0.24
5.48
16
< 0.0001*
15.93
5
< 0.0001*
16.24
11
0.25
5.39
2.5
Limitations
A larger sample size may have aided in accommodating subgroups within the expert
groups. Subgroups would have prevented the pooling of sub-specializations, which may look for different skillsets, and may have reduced the variability observed within groups. Another limitation of the survey was the use of videos filmed from inconsistent angles, which some participants stated made athletes appear faster or slower. While a forced ranking across all videos would have been interesting to examine, sub-set rankings with representative selections met the goal of identifying whether participants used technique to differentiate athletes with similar performance times.
2.6
Hypothesis Review
In this study, we hypothesized that (1) agility scores are consistent between viewings of the same athlete; (2) the definition of agility differs by expert background; (3) assessments within group are similar; (4) the rankings assessed through a forced reference frame differ from an internal reference frame.
Our findings did not support Hypothesis 1. Clinical, military, and novice groups pro-vided higher scores for the second set of videos. The second score propro-vided for the videos was only significantly different between groups for one athlete. This result did not support Hypothesis 2, which expected a much greater difference in score values for evaluators in separate fields. Large fourth spreads in Score 2 for multiple videos as well disagreements in evaluator comments within groups for the same videos, did not provide the consistency expected for Hypothesis 3. Hypothesis 4 was partially supported by chi-squared results. These results revealed that significantly different rankings were provided for 4 out of the 10 athletes evaluated using both forced ranks and explicit ranks.
2.7
Summary
The objective of this study was to determine how experts evaluate agility and to iden-tify key terms defining agility performance. The metrics identified have potential to aid in quantifying agility for training and rehabilitation in clinical, military, and athletic environ-ments. The survey analysis found that expert decision-making is guided by technique-based metrics in addition to speed-based metrics. These findings are based on qualitative analysis of the participant-provided descriptions and quantitative analysis of the scores and ranks. The value placed on certain strategies was not dependent on area of expertise as scoring was variable within and across groups for several athletes scored.
The qualitative analysis summarizing the agility techniques noted by the participants can be used to define quantitative biomechanical metrics. There is opportunity to select metrics that are possible to robustly estimate using mocap, as well as defining measures that map to these terms using data from wearable sensors. The use of wearable sensing enables data collection in a natural setting, which extends the tasks and environments that may be assessed. The definitions of quantitative metrics that map to the qualitative terms provide a means to examine the multiple components that combine to enable an interpretation of agility. Similar to a decision-maker, these component metrics could be combined to construct a composite agility score. For example, the composite could be defined as a weighted average, with the frequency with which terms occurred in the survey used to define the weights. However, the variability in responses for individuals within and between groups highlights that such a composite may need to be tuned to address the strategies desired by a particular user or have weightings shown explicitly so that it can be interpreted by users who prioritize different techniques. The development of quantitative scores will enable a better understanding of a persons strategy and can aid in detecting areas for performance training beyond the time-based methods currently used. These methods will also be valuable in assessing operational decisions for military environments, or rehabilitation needs in a clinical environment. For example, quantitative scores could inform how selected military gear affects agility and could aid clinicians in selecting a plan of care using metric-based
Chapter 3
Study 2: Metric Development
3.1
Background
Both planned and reactive agility drills use time-based metrics to evaluate agility per-formance. While speed is important for agility, the parameter does not provide insights about which aspects of performance contribute to or limit success. Human biomechanics is often quantified using mocap, which typically requires data collection to take place in a lab setting. IMUs are an alternative to mocap that extend the tasks and environments that may be assessed. The objective of this study was to derive biomechanical metrics to quantify re-active agility technique using an array of body-worn IMUs and extend previous studies that have found weak correlations when comparing to solely course time. All of the metrics we propose map to common terms highlighted by athletic, clinical, and military experts while evaluating videos of agility performance. These metrics are applicable for training across these domains, may provide improved understanding of technique, and in the future could
3.2
Methods
3.2.1
Participants
This study was completed by 18 recreational athletes (9 female, mean age: 20 2 years, height: 68 4 inches, weight: 152 t 30 pounds; mean standard deviation), recruited from the University of Michigan for participation. Two additional athletes completed the agility task but were excluded from the analysis as a result of missing data for a foot IMU and helmet IMU. Participants were eligible if they (1) were between the ages of 18-26, (2) were physically active, (3) had not had a recent hip, knee, or ankle surgery, and (4) were not experiencing lower limb joint pain. All athletes provided written consent. The experimental protocol was approved by the University of Michigan IRB and the MIT Committee on the Use of Humans as Experimental Subjects (COUHES).
3.2.2
Experimental Protocol
Participants completed a reactive agility course (Figure 2.1), which was part of a larger obstacle course (Appendix B). Cones 30 cm high marked the path. Participants wore 13 wireless Inertial Measurement Units (APDM Opal IMUs, with a 3-axis accelerometer (6g range), angular rate gyro (2000 deg/s range), and magnetometer (6 Gauss)). Additional technical specifications are listed in Appendix C. The IMUs (sampled at 128 Hz) were placed on the feet, shanks, thighs, sacrum, torso, forearms, biceps, and head. Each IMU was secured with velcro straps and athletic tape (Figure 3.1). Trials consisted of four endpoints traversed in a randomized sequence. To complete an endpoint sequence, participants began at the start line, ran across a cue line where they received a vocal cue, touched the prescribed cone, returned to and touched the start line, and repeated the process for 3 more cues. All athletes had identical endpoint sequences defined by cone number: 4-4-1, 2-4-4, and 3-4-1-2. An investigator captured completion time for each trial by pressing the button on a trigger-enabled IMU when the participant crossed the start and finish lines.
A
C
B
Figure 3.1
Placement of IMUs on the subject [20].Boxes illustrate the locations of the torso
IMU (box A), the sacrum IMU (box B), and the lower extremity IMUs (box C).
IMUs are held in place using a combination of elastic straps and athletic tape, as depicted in box C.3.2.3
Metric Selection
A total of 10 agility metrics were calculated. Five of these metrics were not included
beyond the initial definition stage because they had confounds or were highly correlated with another metric. The 5 metrics discussed in this chapter (Table 3.1) were associated with
terms used by military, clinical, and athletic experts to evaluate agility technique in Study
1. All of these metrics are unique from those previously described in literature (Section
1.2.2). Experts used the terms "foot contacts" and noted that athletes with good footwork minimized the number of steps taken to turn. Additionally, these athletes used "short, quick
![Figure 1.1 Planned Agility Courses [6]. A, T-Test. B, Illinois Test](https://thumb-eu.123doks.com/thumbv2/123doknet/13906914.448547/13.917.116.775.127.663/figure-planned-agility-courses-t-test-illinois-test.webp)
![Figure 1.2 Reactive Agility Courses [7, 9].A, Reactive test developed by Spasic et al](https://thumb-eu.123doks.com/thumbv2/123doknet/13906914.448547/14.917.127.754.348.641/figure-reactive-agility-courses-reactive-test-developed-spasic.webp)
![Figure 2.1 Reactive agility course adapted from Sekulic et al [9]. Athletes received verbal cues at the location notated and touched 4 endpoint cones (30 cm tall) per trial.](https://thumb-eu.123doks.com/thumbv2/123doknet/13906914.448547/23.917.311.581.134.390/figure-reactive-agility-sekulic-athletes-received-location-endpoint.webp)


![Figure 3.1 Placement of IMUs on the subject [20].Boxes illustrate the locations of the torso IMU (box A), the sacrum IMU (box B), and the lower extremity IMUs (box C).](https://thumb-eu.123doks.com/thumbv2/123doknet/13906914.448547/39.917.282.633.121.607/figure-placement-subject-boxes-illustrate-locations-sacrum-extremity.webp)
