Fascicle VI – Food Technology (2020), 44(1), 193-211
https://doi.org/10.35219/foodtechnology.2020.1.12
ORIGINAL RESEARCH PAPER
PHENOLIC COMPOUNDS FROM ARTICHOKE (Cynara scolymus L.) BYPRODUCTS: OPTIMIZATION OF MICROWAVE ASSISTED
EXTRACTION AND ENRICHMENT OF TABLE OIL
MENANA GUEMGHAR1, HOCINE REMINI1,2,NADIA BOUAOUDIA-MADI1,3, KHOKHA MOUHOUBI1, KHODIR MADANI1,4, LILA BOULEKBACHE-MAKHLOUF1
1
Laboratoire de Biomathématiques, Biophysique, Biochimie et Scientométrie, Faculté des Sciences de la Nature et de la Vie, Université de Bejaia, 06000 Bejaia, Algérie
2
Département de Biologie, Faculté des Sciences de la Nature et de la Vie et des Sciences de la Terre, Université de Bouira, 10000 Bouira, Algérie
3 Université de M'sila Mohamed Boudiaf , Algérie. 4
Centre de recherche en technologie agro-alimentaire (CRTAA), Route de targua-ouzemour, 06000, Bejaia Algérie
Corresponding author: lilaboulekbachemakhlouf@yahoo.fr
Received on 9 May 2020 Revised on 13 July 2020
Abstract
The present study deals with the optimization of phenolic compounds extraction from artichoke (Cynara scolymus L.) waste, and development of a functional enriched edible oil with potential health promoting effects.. Box–Behnken Design (BBD), a widely used form of response surface methodology (RSM), was applied to investigate the effect of process variables on the microwave-assisted extraction (MAE) for the recovery of total phenolic compounds (TPC). Independent variables including ethanol concentration (%), microwave power (W), irradiation time (min), solvent-to-material ratio (mL/g) for MAE were studied. The statistical analysis revealed that the optimal MAE conditions were obtained with 72 % ethanol as extraction solvent, 81:1 mL/g of solvent/solid ratio, 4 min and 900 W for irradiation time and power, respectively. Maximum predicted TPC recovery under the optimized conditions was 37.43 ± 1.26 mg GAE/g DW, which was close to the experimental value 36.10 ± 0.72, indicating suitability of the employed model and the success of RSM in optimizing the extraction conditions. The TPC confirmed the efficiency of MAE methods when compared with the conventional method. The studied edible oil enriched with the optimized extract had a content of phenolic compounds equivalent to 56.41 ± 2.03 µg/mL compared to the control oil.
Keywords: artichoke by-products, optimization, microwave-assisted extraction,
Introduction
It is estimated that about 1.3 billion of food wastes are produced per year, which cause important problems for the industry and the environment (Arshadi et al., 2016; Fregapane et al., 2020), such as the collection cost, industrial processing and environmental pollution. Indeed, the magnitude of loss and waste is too large to be ignored, so one-third of the edible parts of global food produced for human consumption is estimated to be lost or wasted (Lopez Barrera and Hertel, 2020). Agro-industrial wastes are rich sources of phenolic compounds, which have been widely studied due to their potential health-promoting properties (Castro-Vargas et
al., 2019; Shahidi et al., 2019). Currently, the exploitation of theses wastes and the
use of phenolic antioxidant-rich plant extract as food additives and/or nutraceutical have both been of increasing interest. This is because wastes of plant origin often contain natural antioxidants which are much safer than synthetic antioxidants and constitute a large source of valuable compounds (Yu et al., 2017).
Several studies demonstrated different phenolic profiles and antioxidant activity from food plant by-products such as grape pomace and seeds from processed winery (Bozan and Temelli, 2008; Lafka et al., 2007), pomegranate marc (Qu et
al., 2010), soybean (Tyug et al., 2010) and orange peel (Khan et al., 2010) and
there has been a significant data showing that these by-products could be used to produce innovative foods as they might promote human health (Djaoud et al., 2020). Indeed, the daily intake of phenolic compounds is very variable due to different proportion of the different food groups and individual foods of our diet. Thus, a good strategy to ensure an optimal intake of polyphenols through the diet would be to make available enriched oils with well-known bioactive polyphenols. Different sources of biologically active substances can be potentially used to enrich edible oils (Dairi et al., 2017). Indeed, the development of these functional oils may help in prevention of chronic diseases (such as cardiovascular diseases, immune frailty, ageing disorders and degenerative diseases) (Torrent et al., 2019) and improving the quality of life for many consumers reducing health care costs (Fregapane et al., 2020).
The first step for both analysis and exploitation of plant bioactive constituents is their extraction from the cellular matrix. The “ideal” extraction method should be quantitative, non-destructive, and time saving (Dahmoune et al., 2013). The extraction of phenolic compounds requires special care, because they are easily oxidized and rapidly degraded by light. This consists in the extraction procedures design that use environmental friendly solvents, classified as minimal or no harm upon ecosystems or the environment (Płotka-Wasylka et al., 2017), and renewable products, reduce the consumption of energy and have a suitable extract in terms of safety and other quality parameters as result (Chemat et al., 2012). Indeed, this method is used for the production of extracts rich in phenolic antioxidants from
Olea europaea L. and Cynara scolymus L. matrices (Płotka-Wasylka et al., 2017)
Recently, different novel and emerging technologies for green extraction such as High Hydrostatic Pressures (HHP), Ultrasound (US), Pulsed Electric Fields (PEF) and Microwaves (MW) are being increasingly used (Deng et al., 2015;
Kyriakopoulou et al., 2015). In this regard, MAE appears to be one of the best methods to extract phenolic compounds due to the special microwave/matter interactions and the very rapid extraction time (Setyaningsih et al., 2015). The MAE system rapidly generates heat and this characteristic results in a shorter extraction time, efficient extraction, automation, and reduction of organic solvent consumption (Spigno and De Faveri, 2009). Different chemical substances absorb microwaves to different extents and this behaviour makes MAE an efficient method for extraction and, more importantly, makes possible to selectively extract target compounds from complex food matrices (Eskilsson and Björklund, 2000). Extraction technique, temperature, time, type and solvent concentration, solvent to solid ratio, and extraction cycles are some of the factors which individually and/or in combination affect the extraction efficiency (Karabegović et al., 2013). Optimization of these parameters is very important to obtain high extraction yields. Response surface methodology (RSM) is the most commonly used for development, improvement and optimization of extraction processes (Simić et al., 2016). Moreover RSM is an efficacious mathematical and statistical technique for simultaneously evaluating the interaction of several experimental parameters (Bezerra et al., 2008; Izadiyan and Hemmateenejad, 2016).
Globe artichoke (Cynara scolymus L.) is a perennial plant originating from the Mediterranean region and grown for its edible flower buds. The most recent statistics about globe artichoke in the world show that the most important producer country is Italy with more than 45,000 ha and ~440,000 t year. Traditionally globe artichoke is cultivated in Mediterranean countries, with more than 76% of the world’s globe artichoke growing areas (Riahi et al., 2019). It is extensively cultivated in the Mediterranean region, constituting the 85 % of world production (Romani et al., 2016; Ruiz-Aceituno et al., 2016). The edible parts of the artichoke are large inflorescences, collected in the early stages of their development, representing about 30–40 % of its tare weight. Since only the central part of the inflorescence is being consumed, the ratio “edible fraction/total biomass” is rather low (less than 15–20 % of the total plant biomass) (Angelov et al., 2015). During the industrial processing of artichokes, about 80 –85 % of the total plant biomass is discarded and turned into a solid waste (Zuorro et al., 2016). This material consists mainly of the stems and the external parts of the flowers, commonly known as bracts, which are unsuitable for human consumption. The valorisation of both residues would improve the industrial process both economically and environmentally and will allow a massive reduction in biomass wastes (Zuorro, 2014). However, an analysis of its composition shows that artichoke waste is a very rich source of phenolics (Gaafar and Salama, 2013), that exhibit a wide range of beneficial health effects, such as: anti-allergenic, anti-inflammatory, antioxidant, antimicrobial, antithrombotic, cardio protective and vasodilatory effects. Several beneficial effects of polyphenols are mainly due to their antioxidant activity (Yolmeh et al., 2014).
Therefore, the wastes and by-products generated during the deep freezing of artichoke can constitute a great source of high added-value compounds, which have
the potential to be used as food and/or nutraceuticals ingredients. Thus, wastes and by-products valorisation from artichoke can help solve waste management problems in the associate industry and can be useful to produce health-promoting compounds. To the best of our knowledge, no literature report exists on the optimization of MAE procedure for the extraction of total phenolic compounds (TPC) from artichoke stem. Consequently, the objectives of the present study are: the optimization of the extraction of TPC from stem by using green technology (MAE) and their valorisation by enrichment application of table oil.
Materials and methods
The effect of different extraction parameters (ethanol concentration, solvent/material ratio, microwave power and irradiation time) on the efficiency and recovery of phenolic compounds from artichoke stem was studied. Box–Behnken design (BBD), which allows the reduction of the number of experiments compared to other statistical designs, was combined with RSM to analyse the interaction among the MAE operating factors, such as to maximize the extraction of the phenolic compounds. Additionally, to further confirm the extraction efficiencies, a comparison between MAE and a conventional extraction method (maceration) was done. The results were treated by RSM, which generates a mathematical model that is adjusted to the obtained experimental responses and this allows the effects of the independent variables to be analysed. The optimum values of these variables were obtained by solving the mathematical equation and the evaluation of the response surface plots. The phenolic content was then quantified in the enriched sun flower oil using the optimized extract.
Materials
Fresh artichokes were obtained from a local market (Bejaia-Algeria), the stems were separated from the globe using a knife.
Chemicals and solvents
Sodium carbonate (Na2CO3), Folin–Ciocalteu phenol reagent were obtained from Prolabo (made in CE). Gallic acid was purchased from Biochem-chemopharma (UK). All solvents used were of analytical grade and purchased from Prolabo (CE). Evaluation of moisture content of the sample
Before the extraction experiments, the initial moisture content was determined according to the method described by Boulekbache-Makhlouf et al. (2013). The moisture content was about 87 %.
Extraction equipment and procedure
Microwave- assisted extraction
Before extraction, the samples were washed with distilled water and cut into washers, and dried for about 48h at room temperature in a ventilated dark room, then they were ground to obtain a thin powder (250 µm diameter).
The extraction of the phenolic compounds from the artichoke by-products was performed in domestic microwave oven system (2.45 GHz, Samsung Model
NN-S674MF, Kuala Lumpur, Malaysia). The apparatus was equipped with a digital control system for irradiation time and microwave power (the latter was linearly adjustable from 100 to 1000 W). The oven was modified (Figure 1) in order to condense the vapours generated during extraction into the sample. For the extraction, one gram of the stem powder was placed in a 250 mL volumetric flask containing the extraction solvent. The suspension was irradiated at regular intervals according to oven operation. Depending on the trial, a different solvent, irradiation time, microwave power and solvent-to-solid ratio were used (Tables 1 and 2). At the end of microwave irradiation, the volumetric flask was allowed to cool to room temperature. After extraction, the extract was recovered by filtration in a Büchner funnel through Whatman No. 1 paper, and collected in a volumetric flask, then stored at (4 °C) until used and analysed for TPC( for the optimized MAE extracts and the sunflower oil).
Figure 1. Diagram of a modified microwave apparatus
Conventional solvent extraction
Phenolic compounds were extracted using a conventional solvent extraction method following the procedure described elsewhere by Zuorro (2014). Briefly, one gram of powder was placed in a conical flask, and an appropriate volume of solvent/water was added. The mixture was kept in a batch mode and magnetically stirred and thermostatically controlled. After the extraction, the sample was recovered by filtration in a Büchner funnel through Whatman N°. 1 paper, and collected in a volumetric flask, then stored at 4 °C until its analysis.
Determination of total phenolic content
Total phenolic content (TPC)
TPC of stem extracts was determined according to Georgé et al. (2005) method. Briefly, 2.5 mL of diluted Folin-Ciolcateu reagent (diluted ten times 1/10) were added to the extracts. The mixture was incubated for 2 min at room temperature, and 2 mL of saturated sodium carbonate solution (75 g/L) were added. The mixture was incubated for 15 min at 50 °C and finally cooled in a water-ice bath. The
specific absorbance at 760 nm was immediately measured by a spectrophotometer (UV-mini 1240, Shimadzu, Japan). The TPC was expressed as milligram gallic acid equivalents per gram of dry weight (mg GAE/ g DW) basis.
Preparation of enriched sunflower oil
The fortified sunflower oil was prepared according to the methodology reported by Dairi et al. (2017). Appropriate weighed quantities of sample extract were dissolved in an appropriate volume of ethanol (50 %), in order to have a final concentration of 200 ppm. Then, 500 µL were added to sunflower oil (500 g) progressively under vigorous stirring for 30 min. Oil samples were stored in the dark until analysis. Oil sample without extract was considered thecontrol sample.
Extraction of polyphenols from enriched oil
This procedure was adapted from the methodology described by Kalantzakis et al. (2006). A sample of 2.5 g of oil was added to 5 mL of hexane (99 %) and 5 mL of methanol/water (6/4, v/v), then vortexed for 2 min and centrifuged at 3500 rpm for 10 min. The polar fraction (methanolic phase) was recovered, while the apolar phase (hexane) underwent exhaustion (depletion). The three fractions obtained were mixed and stored at 4 °C and protected from light. The same procedure was used with the control sample without artichoke waste extract.
Experiment design
To reduce the total experimental work and to optimize the MAE approach, the influences of process variables were first examined separately in single-factor experiments. In the MAE experiments when one variable was not studied, it was kept constant. To begin the experiments different mixtures of solvent/water i.e. , ethanol, methanol and acetone (1:1 v/v; organic solvent: water) were used to identify the adequate solvent for extraction, and then ethanol has been chosen and studied to set the best concentration (20 to 100 %). When testing the influence of both factors (type and concentration of solvent), the constant values of microwave power, irradiation time and solvent / solid ratio were: 500W, 60s and 40:1 mL/g respectively.
After setting the concentration of the solvent (ethanol 60 %), the best ratio was selected by varying the last one from 30:1 to 90:1 mL/g and the constant values of the other factors were the same as those cited above (500W and 60s)
The ratio was fixed at 70:1 mL/g to study the effect of microwave power ranging from 100 to 1000 W, and the other parameters were fixed as follows: ethanol at 60 %, irradiation time at 60 s and 70:1 mL/g for the ratio.
Lastly four irradiation times (1, 2, 3 and 4 min) have been studied, setting the power at 700 W and other factors were the same as those cited above (ethanol 60%, 70:1 mL/g ). On the basis of the single-factor experimental results (Tables 1), the major influence factors were selected. Then, an RSM based on a Box–Behnken Design (BBD) was conducted to optimize MAE process (Table 2).
Regression analysis of the data to fit a second-order polynomial equation (quadratic model) was carried out according to the following general equation (Eq. (1)), which was then used to predict the optimum conditions of extraction process.
2 0 1 1 K K K i i ii ij i j i i i j Y B B X B X B X X E
(1)Where Y represents the response function (in our case TPC); B0 is a constant coefficient; Bi, Bii and Bij are the coefficients of the linear, quadratic and cross terms, respectively, and Xi,Xj represent the coded independent variables. According to the analysis of variance, the regression coefficients of individual linear, quadratic and interaction terms were determined. In order to visualize the relationship between the response and experimental levels of each factor and to deduce the optimum conditions, the regression coefficients were used to generate 3-D surface plots from the fitted polynomial equation. The factor levels were coded as −1 (low), 0 (central point or middle) and 1 (high), respectively. The variables were coded according to the following equation (Eq. (2)):
0 i i
x
x
X
x
(2)Where Xi is the (dimensionless) coded value of the variable xi and x0 is the value of
X at the center point and Δx is the step change. The analysis of variance was
performed for the response variable using the full model, where P-values (partitioned into linear and interaction factors) indicated whether the terms were significant or not. To verify the adequacy of the models, additional extraction experiments were carried out at the optimal conditions predicted with the RSM and the obtained experimental data were compared to the values predicted by the regression model. Optimized MAE conditions were then compared to a reference CSE procedure and added to the sunflower oil in order to improve the phenolic content of the sunflower enriched oil and finally compared to the control (unenriched oil).
Statistical analysis
Each extraction trial and all the analyses were carried out in triplicate and all the data in this paper have been reported as means ± SD. Influence of each factor on the TPC yield in the single-factor experiment for the MAE was statistically assessed by ANOVA (analysis of variance) and posthoc Tukey test with 95% confidence level. Data obtained from the BBD trials for the MAE were statistically analysed using ANOVA for the response variable in order to test the model significance and suitability. p < 0.05 and p < 0.01 were taken as significant and highly significant level, respectively. The JMP (John's MacIntosh Product), Version 7.0, SAS, and Design-Expert (Trial version8.0.7.1) software were used to construct the BBD and to analyse all the results.
Results and discussion Results of Single-Factor Tests
Preliminary trials were performed to select the experimental range of the MAE factors. The obtained results are summarized in Table 1.
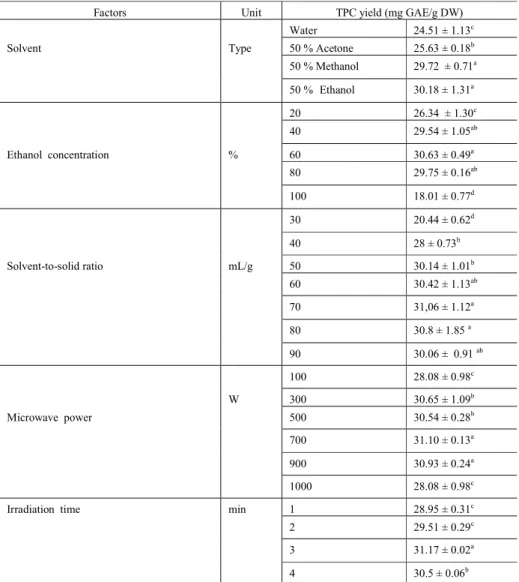
Table 1. Results of single-factor experiments for Microwave-assisted extraction.
Results are reported as means ± S.D. Same letters in the same column refer to means not statistically different according to ANOVA and Tukey’s test. TPC - total phenols yield referred to dry weight (DW) of stem; GAE - gallic acid equivalents.
Thus, different mixtures solvent/water i.e., ethanol, methanol and acetone, were tested. The highest outcomes were achieved with the mixtures of ethanol: water (1:1; v/v) (30 ± 2.31 mg GAE/g DW) and methanol: water (1:1; v/v) (29.72 ± 2.71 mg GAE/ g DW), and the less interesting ones were reached with acetone: water (1:1; v/v). Indeed, ethanol is a safer organic solvent which is used in food and pharmaceutical industries. Even though methanol: water has been described as one
Factors Unit TPC yield (mg GAE/g DW) Water 24.51 ± 1.13c
Solvent Type 50 % Acetone 25.63 ± 0.18b
50 % Methanol 29.72 ± 0.71a 50 % Ethanol 30.18 ± 1.31a 20 26.34 ± 1.30c 40 29.54 ± 1.05ab Ethanol concentration % 60 30.63 ± 0.49a 80 29.75 ± 0.16ab 100 18.01 ± 0.77d 30 20.44 ± 0.62d 40 28 ± 0.73b Solvent-to-solid ratio mL/g 50 30.14 ± 1.01b 60 30.42 ± 1.13ab 70 31,06 ± 1.12a 80 30.8 ± 1.85 a 90 30.06 ± 0.91 ab 100 28.08 ± 0.98c W 300 30.65 ± 1.09b Microwave power 500 30.54 ± 0.28b 700 31.10 ± 0.13a 900 30.93 ± 0.24a 1000 28.08 ± 0.98c
Irradiation time min 1 28.95 ± 0.31c
2 29.51 ± 0.29c
3 31.17 ± 0.02a
of the most efficient solvent for phenolic compounds extraction, ethanol: water (1:1; v/v) was selected as the optimum one for the subsequent RSM optimization studies because the attained yields with both mixtures were not significantly different, and ethanol is a food grade solvent (Li et al., 2012). It is also a solvent that can be produced from different bioresources (biosolvent) by fermentation, and can contribute to the sustainability of industrial processes.
The solvent constitution decides the type and quantity of phenolic compounds extracted from plant materials, and is one of the most important factors in an extraction process (Nayak et al., 2015). Aqueous ethanol solution was widely used because it has low toxicity and good accessibility, and can easily dissolve phenolic compounds (Fang et al., 2015; H. Li et al., 2012).
As it can be seen from Table 1, the extraction yields and TPC in stem extracts strongly depends on the concentration of ethanol, this could be due to the polarity of solvent, which was critical for the solubility of phenolic compounds (Simić et
al., 2016).
The effect of different concentrations of ethanol on total phenolic compounds yield was analysed, and other conditions were kept constant: 40:1 mL/g, 1 min, and 500 W for the ratio, time and power, respectively. As shown in Table 1, as the proportion of ethanol in hydroalcoholic solvent increased from 20 to 60 %, the TPC value was improved significantly (p < 0.05) from 26.34 ± 1.13 to 30.63 ± 1.41 mg GAE/g DW. However, the TPC value gradually decreased when the concentration of ethanol continued to rise. Therefore, 60 % ethanol was considered as the ideal concentration for further experiments.
Relatively high solvent volume could accelerate substance transfer and promote solubility, and then improve the extraction efficacy within a certain range as also reported by (Spigno and De Faveri, 2009). The impact of solvent/material ratio (S/M ratio) on phenol yield was investigated from 30:1 to 90:1 mL/g under these conditions (60 % ethanol, 1 min, 500 W). Table 1 shows that the TPC value increased from 30:1 to 70:1 mL/g, and reached the peak (31.06 ± 3.12 mg GAE/g DW) at 70:1 mL/g, then it decreased (80:1 mL/g), and remained almost constant (80:1–90:1 mL/g). We speculated that when the TPC value reached the peak at 70:1 mL/g, the substance transfer probably reached the equilibrium.
A sample of 1 g was extracted by 70:1 mL of 60 % ethanol for 1 min, with different levels of microwave power. As shown in table 1, the TPC value was improved with the increase of microwave power from 100 to 700 W, with a maximum of 38.08 - 0.20 mg GAE/g DW at 700 W.
As the irradiation power continued to rise, the TPC value decreased gradually, possibly because microwave power (> 700 W), indeed, higher microwave power could cause the degradation of phenolic compounds and affect negatively the extraction yield due to the thermal sensibility of these compounds. In general, the extraction yield increases proportionally with increasing microwave power up to a limit before the increase becomes insignificant or decline (Mandal and Mandal,
2010; Xiao et al., 2008). Hence, 700 W was chosen as the most efficient microwave power.
Table 1 showed the influence of different extraction times on the TPC value when other conditions were fixed as: 60 % ethanol, 70:1 mL/g, 700 W. Firstly, the TPC value increased from 28.95 ± 0.31 to 31.17 ± 0.63 mg GAE/g DW with duration increasing from 1 to 3 min. When duration was extended to 4 min, the extraction efficiency decreased, and kept constant., Longer irradiation exposition without temperature control probably induced thermal degradation of phenolic compounds (Dahmoune et al., 2014; Yang et al., 2009).
Optimization microwave-assisted extraction (MAE)
Linear and interactive effect of independent variables over the response is examined through three-dimensional surface plots (3D). 3D plots were studied by varying two factors over a response while keeping the other two factors at a constant point. These were generated by plotting response in Z-axis and two varying factors in X and Y axis, respectively. These plots also help to interpret the optimum process conditions for maximum yield of response (Al-Dhabi et al., 2017).
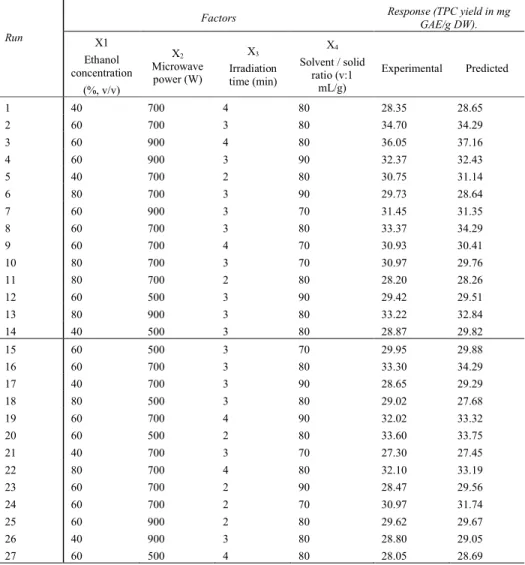
The measured and predicted results for each trial for response are shown in Table 2. The four independent variables and their corresponding levels were: X1- Ethanol concentration (%) 40-60-80; X2- Microwave power (W) 500-700-900; X3- Irradiation time (min) 2-3-4 ; X4- solvent/solid ratio (g/mL) 70-80-90.
First, an analysis of variance (ANOVA) was performed to evaluate the effect of the variables, to identify possible interactions between them, and to assess the statistical significance of the model (Table 3).
The statistical significance of the regression model was checked by F-test and p-value, the corresponding variables would be more significant if the F-value becomes greater and the p-value turns to smaller, therefore, the ANOVA in Table 3 showed that the fitted model was significant (F = 22.62, p < 0.0001). The non-significance of the lack-of-fit test (p = 0.76) verified the suitability of the selected model. The R2 of 0.96 implied that 96 % of the variations of TPC value were attributed to the three independent variables. Besides, the adjusted R2 value of 0.92 was close to the R2 of 0.96, indicating that the observed values were correlated with the predicted values to a high degree.
All the above results revealed the validity of the model to predict the real correlations between the response value and independent variables.
This analysis provides information on the mathematical model that is generated from the experimental data. The extraction of both types of compounds is related to the experimental conditions by a second-order polynomial equation, with non-significant items being removed:
(3) 1 2 3 1 2 1 3 2 3 33.79 0.87 1.04 0.49 1.06 1.57 2.99 Y X X X X X X X X X 2 2 2 2 3 4 1 2 3 4
0.89
X X
2.76
X
0.96
X
1.25
X
1.98
X
Table 2. Box–Behnken design with the observed responses and predicted values for yield
of total phenolic compounds (TPC) (mg GAE/g DW) of artichoke stem using MAE
Run
Factors Response (TPC yield in mg GAE/g DW). X1 Ethanol concentration (%, v/v) X2 Microwave power (W) X3 Irradiation time (min) X4 Solvent / solid ratio (v:1 mL/g) Experimental Predicted 1 40 700 4 80 28.35 28.65 2 60 700 3 80 34.70 34.29 3 60 900 4 80 36.05 37.16 4 60 900 3 90 32.37 32.43 5 40 700 2 80 30.75 31.14 6 80 700 3 90 29.73 28.64 7 60 900 3 70 31.45 31.35 8 60 700 3 80 33.37 34.29 9 60 700 4 70 30.93 30.41 10 80 700 3 70 30.97 29.76 11 80 700 2 80 28.20 28.26 12 60 500 3 90 29.42 29.51 13 80 900 3 80 33.22 32.84 14 40 500 3 80 28.87 29.82 15 60 500 3 70 29.95 29.88 16 60 700 3 80 33.30 34.29 17 40 700 3 90 28.65 29.29 18 80 500 3 80 29.02 27.68 19 60 700 4 90 32.02 33.32 20 60 500 2 80 33.60 33.75 21 40 700 3 70 27.30 27.45 22 80 700 4 80 32.10 33.19 23 60 700 2 90 28.47 29.56 24 60 700 2 70 30.97 31.74 25 60 900 2 80 29.62 29.67 26 40 900 3 80 28.80 29.05 27 60 500 4 80 28.05 28.69
Regarding the linear, quadratic and interaction effects on the response (Table 3), microwave power (X2) followed by ethanol concentration (X1) and irradiation time
(X3) were the most influent parameters, both respective linear and quadratic factors
were highly significant (p < 0.05). However, the sample/solvent ration had the smallest effect on the response.
The interaction between the extraction variables; ethanol concentration and irradiation time (X1X3), ethanol concentration and irradiation time (X1X3), microwave power and irradiation time (X2X3), irradiation time and sample/solvent
Positive signs indicate a direct relationship between the effect and the response variable, while negative signs refer to an inverse relationship
Table 3. Analysis of mean square deviation of the quadratic model terms (Eq. (3)) applied
to the experimental values of total phenolic yields obtained with MAE extraction. df, degrees of freedom. Source Sum of Squares DF F- Value p-value Prob > F Model 129.15 14 22.61 <.0001* X1- Ethanol concentration % 9.25 1 22.67 0.0005* X2- Microwave power (W) 13.21 1 32.40 0.0001* X3- Irradiation time (min) 2.89 1 7.09 0.0207* X4- sample/solvent (g/mL) 0.067 1 0.16 0.69 X1X2 4.56 1 11.19 0.005* X1X3 9.92 1 24.31 0.0003* X1X4 1.67 1 4.10 0.065 X2X3 35.88 1 87.93 <.0001* X2X4 0.52 1 1.28 0.27 X3X4 3.31 1 7.88 0.01* X12 40.68 1 100.16 <.0001* X22 4.92 1 12.07 0.004* X3 2 6.75 1 16.54 0.0016* X42 20.95 1 51.36 <.0001* Residual 0.99 15 Lack of fit 3.65 10 0.58 0.76 Pure error 1.24 2 R2 0.96 Adj-R2 0.92 With an asterisk (*) : Significant
The effects of the independent variables and their mutual interaction on the extraction yield of phenolic acids can also be seen on three-dimensional response surface curves and contour plots shown in Fig.2. A–C. The plots were generated by plotting the response using the Z-axis against two independent variables while keeping the other two independent variables at their zero level (Hayat et al., 2009). Figure 2. A–B depicts the interactions between the amount of ethanol concentration and each of both other factors (Microwave power, irradiation time) on the recovery of total phenolic content. The response value of the stem raised from 29 to 33.80 mg GAE/g DW when ethanol concentration increased from 40 to 65 %, and extraction power from 500 to 750 W and nearly reached a peak at the 65 % of ethanol concentration tested. In general, it was found that ethanol solution that
ranged from 40 to 80 % had greater efficiency in the extraction of phenolics compared to pure ethanol (Hayouni et al., 2007; Song et al., 2011).
Figure 2. Response surface analysis for the total phenolic yield from stem of artichoke
(Cynara scolymus L.) with microwave assisted extraction with respect to ethanol concentration and microwave power (A); ethanol concentration and irradiation time (B); Irradiation time and Microwave power (C); liquid to solvent ration and irradiation time (D)
After that, additional ethanol concentration and extraction power caused negative effects according to Table .3, the recovery of TPC mainly depends on the ethanol concentration as its quadratic and linear effects were highly significant (p < 0.01), which result in a curvilinear increase in TPC yield for all the extraction powers and times tested (Figure 2A and B). Increase in the TPC suggests that the phenolic compounds are more soluble in ethanol/water, confirming the single-factor experiments results. Ethanol could increase the extraction yields and water could enhance swelling of cell material, increasing positively the contact surface area between plant matrix and solvent, resulting in increase of the extraction yield (Dahmoune et al., 2015; Hayat et al., 2009).
As can be seen in Figure 2C, an increase in microwave power enhanced the extraction yield at first, and then decreased it. This outcome is consistent with the data reported by Périno-Issartier et al. (2010) and Y. Li et al. (2012), who also observed a similar trend for the effect of microwave power on the MAE of natural
antioxidants from several plants. When a high microwave power was used, at long extraction times, it promotes the degradation of total phenolic contents.
As showed in Figure 2D. The increase of the liquid to solid ration from 70:1 to 85 mL/g improved greatly the yield of polyphenols which reached the peak at 82:1 mL/g, this result correlate with the preliminary tests after the decrease of the extraction of phenolic compounds.
This is consistent with mass transfer principles; the driving force during mass transfer is the concentration gradient between the solid and the liquid, which is greater when a higher solvent to solid ratio is used. Similar results about the effect of solvent to solid ratio on the extraction of phenolic compounds were reported for date seeds by Al-Farsi and Lee (2008), Pinelo et al. (2005), and dried sage by Durling et al. (2007).
Validation of the models
On the basis of the RSM predictive models and values, the ideal MAE conditions for the extraction of TPC from stem were estimated to be: 72 % of ethanol , power of 900 W, irradiation time equal to 4 min, and solvent/solid ratio of 81:1 mL/g. Validation experiments were performed under the above mentioned optimal conditions to validate the adequacy of the models.
The mean yield value 36.10 ± 0.72 and (n =3) obtained from real experiments showed close correlations between the predicted and experimental values indicating the adequacy of the models to predict the optimal MAE conditions. Therefore, these conditions were recommended for future extractions of TPC, of Artichoke stem (Table 4). These findings also justified the validity of the RSM model, and indicated that the model was adequate for the extraction process.
Table.4. Predicted and experimental values of TPC yield with microwave-assisted
extraction (MAE) under optimised extraction conditions
Run Factors Response (TPC yield in mg GAE/g DW) X1 Ethanol concentration (%, v/v) X2 Microwave power (W) X3 Irradiation time (min) X4 Solvent / solid ratio mL/g Experimental Predicted 1 72 900 4 81:1 36.10 ± 0.72 37.43 ±1.26
Comparison of MAE with conventional method
Theefficiencyof MAE was compared with maceration in several aspects, mainly in term of total phenolic content. The efficient of MAE process increased the total phenol yield by 93.77 % (18.63 ± 1.61 mg GAE/g DW for the maceration and 36.10 ± 0.72 mg GAE/g DW for MAEunder optimised extraction conditions) in comparison with maceration extraction in a very short extraction time. In terms of the extraction duration, the best results were also achieved by the MAE with just 4 min (which conceded a 30-minute reduction in extraction time). In addition, MAE cost less solvent. Similar results were also reported in comparing MAE with
conventional extraction techniques in extracting polyphenols from Melastoma
sanguineum fruit by Zhao et al. (2018) and from Pistacia lentiscus leaves by
Dahmoune et al. (2014).
Quantification of phenolics in sun flower enriched oil
The extract obtained under the optimum conditions was tested in term of the efficiency by its incorporation in the sun flower oils. The TPC yield was examined and the results revealed the presence of phenolic compounds in the oil enriched with a concentration of 56.41 ± 2.03 µg/mL and its absence in the control oil (without extract) as summarized in Table 4. These results confirmed that the extract has greatly improved the quality of the tested oil, by increasing its bioactive substances content, which in turn improves its nutritional quality, compared to the control oil which reveals no TPC.
Conclusions
The recovery of natural antioxidants or other health-promoting compounds from agro-industrial wastes is a topic of a growing interest in the field of applied biotechnology. In this context to the best of our knowledge this is the first report on the extraction of phenolic compounds from artichoke stem using MAE. RSM was successfully employed to optimize the extraction and several experimental parameters have been evaluated to determine the optimal conditions for the extraction. The proposed method showed satisfactory linearity (correlation coefficients between 0.96 and 0.92). The applied second-order polynomial model gave a satisfactory description of the experimental data showing that the TPC yield was most affected by ethanol concentration and extraction power (p < 0.05). Under the optimal conditions, the yield of stem was 36.10 ± 0.72 mg GAE/g DW, significantly higher than that of conventional extraction. According to the obtained results, it can be concluded that the microwave-assisted extraction was a promising technique for extracting phenolic compounds from stem, which might play important roles in improving extraction rate of antioxidant compared to traditional solid–liquid extraction.
Microwave technique gave a significant increase in extraction yield with various advantages including: reduced extraction time, the use of less extraction solvent for a particular bioactive phytochemical when conditions are optimized and better extraction yield.
Utilization of stem for extraction of beneficial phytonutrients such as phenolic antioxidants not only provides health benefits, but also adds value to the waste generated by the artichoke processing industries.
Acknowledgments
We wish to acknowledge the Ministry of Higher Education and Scientific Research of Algeria and the Direction Générale de la Recherche Scientifique et du Développement Technologique (DGRSDT).
References
Al-Dhabi, N.A., Ponmurugan, K., Jeganathan, P.M. 2017. Development and validation of ultrasound-assisted solid-liquid extraction of phenolic compounds from waste spent coffee grounds. Ultrasonics sonochemistry, 34, 206-213.
Al-Farsi, M.A., Lee, C.Y. 2008. Optimization of phenolics and dietary fibre extraction from date seeds. Food Chem, 108 (3), 977-985.
Angelov, G., Georgieva, S., Boyadzhieva, S., Boyadzhiev, L. 2015. Optimizing the extraction of globe artichoke wastes. Comptes rendus de l’Académie bulgare des
Sciences, 68 (10).
Arshadi, M., Attard, T.M., Lukasik, R.M., Brncic, M., da Costa Lopes, A.M., Finell, M., Geladi, P., Gerschenson, L.N., Gogus, F., Herrero, M. 2016. Pre-treatment and extraction techniques for recovery of added value compounds from wastes throughout the agri-food chain. Green Chemistry, 18 (23), 6160-6204.
Bezerra, M.A., Santelli, R.E., Oliveira, E.P., Villar, L.S., Escaleira, L.A. 2008. Response surface methodology (RSM) as a tool for optimization in analytical chemistry.
Talanta, 76 (5), 965-977.
Boulekbache-Makhlouf, L., Slimani, S., Madani, K. 2013. Total phenolic content, antioxidant and antibacterial activities of fruits of Eucalyptus globulus cultivated in Algeria. Industrial Crops and Products, 41, 85-89.
Bozan, B., Temelli, F. 2008. Chemical composition and oxidative stability of flax, safflower and poppy seed and seed oils. Bioresource Technology, 99 (14), 6354-6359. Castro-Vargas, H.I., Ballesteros Vivas, D., Ortega Barbosa, J., Morantes Medina, S.J.,
Aristizabal Gutierrez, F., Parada-Alfonso, F. 2019. Bioactive Phenolic Compounds from the Agroindustrial Waste of Colombian Mango Cultivars 'Sugar Mango' and 'Tommy Atkins'-An Alternative for Their Use and Valorization. Antioxidants (Basel),
8 (2).
Chemat, F., Vian, M.A., Cravotto, G. 2012. Green extraction of natural products: concept and principles. Int J Mol Sci, 13 (7), 8615-8627.
Dahmoune, F., Boulekbache, L., Moussi, K., Aoun, O., Spigno, G., Madani, K. 2013. Valorization of Citrus limon residues for the recovery of antioxidants: Evaluation and optimization of microwave and ultrasound application to solvent extraction. Industrial
Crops and Products, 50, 77-87.
Dahmoune, F., Nayak, B., Moussi, K., Remini, H., Madani, K. 2015. Optimization of microwave-assisted extraction of polyphenols from Myrtus communis L. leaves. Food
Chem, 166, 585-595.
Dahmoune, F., Spigno, G., Moussi, K., Remini, H., Cherbal, A., Madani, K. 2014. Pistacia lentiscus leaves as a source of phenolic compounds: Microwave-assisted extraction optimized and compared with ultrasound-assisted and conventional solvent extraction.
Industrial Crops and Products, 61, 31-40.
Dairi, S., Carbonneau, M.A., Galeano-Diaz, T., Remini, H., Dahmoune, F., Aoun, O., Belbahi, A., Lauret, C., Cristol, J.P., Madani, K. 2017. Antioxidant effects of extra virgin olive oil enriched by myrtle phenolic extracts on iron-mediated lipid peroxidation under intestinal conditions model. Food Chemistry, 237, 297-304. Deng, Q., Zinoviadou, K.G., Galanakis, C.M., Orlien, V., Grimi, N., Vorobiev, E.,
processing on glucosinolates and its derived forms, isothiocyanates: extraction, degradation, and applications. Food Engineering Reviews, 7 (3), 357-381.
Djaoud, K., Boulekbache‐Makhlouf, L., Yahia, M., Mansouri, H., Mansouri, N., Madani, K., Romero, A. 2020. Dairy dessert processing: Effect of sugar substitution by date syrup and powder on its quality characteristics. Journal of Food Processing and
Preservation, 44(5), e14414.
Durling, N.E., Catchpole, O.J., Grey, J.B., Webby, R.F., Mitchell, K.A., Foo, L.Y., Perry, N.B. 2007. Extraction of phenolics and essential oil from dried sage (Salvia officinalis) using ethanol–water mixtures. Food Chemistry, 101 (4), 1417-1424. Eskilsson, C.S., Björklund, E. 2000. Analytical-scale microwave-assisted extraction.
Journal of Chromatography A, 902 (1), 227-250.
Fang, X., Wang, J., Hao, J., Li, X., Guo, N. 2015. Simultaneous extraction, identification and quantification of phenolic compounds in Eclipta prostrata using microwave-assisted extraction combined with HPLC–DAD–ESI–MS/MS. Food Chemistry, 188, 527-536.
Fregapane, G., Guisantes-Batan, E., Ojeda-Amador, R.M., Salvador, M.D. 2020. Development of functional edible oils enriched with pistachio and walnut phenolic extracts. Food Chemistry, 310, 125917.
Gaafar, A., Salama, Z. 2013. Phenolic compounds from artichoke (Cynara scolymus L.) by-products and their antimicrobial activities. Journal of Biology, Agriculture and
Healthcare, 3, 1-6.
Georgé, S., Brat, P., Alter, P., Amiot, M.J. 2005. Rapid determination of polyphenols and vitamin C in plant-derived products. Journal of Agricultural and Food Chemistry, 53 (5), 1370-1373.
Hayat, K., Hussain, S., Abbas, S., Farooq, U., Ding, B., Xia, S., Jia, C., Zhang, X., Xia, W. 2009. Optimized microwave-assisted extraction of phenolic acids from citrus mandarin peels and evaluation of antioxidant activity in vitro. Separation and
Purification Technology, 70 (1), 63-70.
Hayouni, E.A., Abedrabba, M., Bouix, M., Hamdi, M. 2007. The effects of solvents and extraction method on the phenolic contents and biological activities in vitro of Tunisian Quercus coccifera L. and Juniperus phoenicea L. fruit extracts. Food
Chemistry, 105 (3), 1126-1134.
Izadiyan, P., Hemmateenejad, B. 2016. Multi-response optimization of factors affecting ultrasonic assisted extraction from Iranian basil using central composite design. Food
Chemistry, 190, 864-870.
Kalantzakis, G., Blekas, G., Pegklidou, K., Boskou, D. 2006. Stability and radical‐ scavenging activity of heated olive oil and other vegetable oils. European Journal of
Lipid Science and Technology, 108 (4), 329-335.
Karabegović, I.T., Stojičević, S.S., Veličković, D.T., Nikolić, N.Č., Lazić, M.L. 2013. Optimization of microwave-assisted extraction and characterization of phenolic compounds in cherry laurel (Prunus laurocerasus) leaves. Separation and Purification
Technology, 120, 429-436.
Khan, M.K., Abert-Vian, M., Fabiano-Tixier, A.-S., Dangles, O., Chemat, F. 2010. Ultrasound-assisted extraction of polyphenols (flavanone glycosides) from orange (Citrus sinensis L.) peel. Food Chemistry, 119 (2), 851-858.
Kyriakopoulou, K., Papadaki, S., Krokida, M. 2015. Life cycle analysis of β-carotene extraction techniques. Journal of Food Engineering, 167, 51-58.
Lafka, T.-I., Sinanoglou, V., Lazos, E.S. 2007. On the extraction and antioxidant activity of phenolic compounds from winery wastes. Food Chemistry, 104 (3), 1206-1214. Li, H., Deng, Z., Wu, T., Liu, R., Loewen, S., Tsao, R. 2012. Microwave-assisted
extraction of phenolics with maximal antioxidant activities in tomatoes. Food
Chemistry, 130 (4), 928-936.
Li, Y., Fabiano-Tixier, A.-S., Abert-Vian, M., Chemat, F. 2012. Microwave-Assisted Extraction of Antioxidants and Food Colors. In: Microwave-assisted Extraction for
Bioactive Compounds, Chemat F. and Cravotto G. Eds., p. 103-125, Springer,
Boston, MA
Lopez Barrera, E., Hertel, T. 2020. Global food waste across the income spectrum: Implications for food prices, production and resource use. Food Policy, 101874. Mandal, V., Mandal, S.C. 2010. Design and performance evaluation of a microwave based
low carbon yielding extraction technique for naturally occurring bioactive triterpenoid: Oleanolic acid. Biochemical Engineering Journal, 50 (1-2), 63-70. Nayak, B., Dahmoune, F., Moussi, K., Remini, H., Dairi, S., Aoun, O., Khodir, M. 2015.
Comparison of microwave, ultrasound and accelerated-assisted solvent extraction for recovery of polyphenols from Citrus sinensis peels. Food Chemistry, 187, 507-516. Périno-Issartier, S., Zill e, H., Abert-Vian, M., Chemat, F. 2010. Solvent free
microwave-assisted extraction of antioxidants from sea buckthorn (Hippophae rhamnoides) Food By-Products. Food and Bioprocess Technology, 4 (6), 1020-1028.
Pinelo, M., Rubilar, M., Jerez, M., Sineiro, J., Núñez, M.J. 2005. Effect of solvent, temperature, and solvent-to-solid ratio on the total phenolic content and antiradical activity of extracts from different components of grape pomace. Journal of
Agricultural and Food Chemistry, 53 (6), 2111-2117.
Płotka-Wasylka, J., Rutkowska, M., Owczarek, K., Tobiszewski, M., Namieśnik, J. 2017. Extraction with environmentally friendly solvents. TrAC Trends in Analytical
Chemistry, 91, 12-25.
Qu, W., Pan, Z., Ma, H. 2010. Extraction modeling and activities of antioxidants from pomegranate marc. Journal of Food Engineering, 99 (1), 16-23.
Riahi, J., Nicoletto, C., Bouzaein, G., Haj Ibrahim, M., Ghezal, I., Sambo, P., Kouki Khalfallah, K. 2019. Optimization of offshoot outgrowth in globe artichoke using a combination of chemical and mechanical treatments. Agronomy, 9 (2), 104.
Romani, A., Scardigli, A., Pinelli, P. 2016. An environmentally friendly process for the production of extracts rich in phenolic antioxidants from Olea europaea L. and
Cynara scolymus L. matrices. European Food Research and Technology, 243 (7),
1229-1238.
Ruiz-Aceituno, L., Garcia-Sarrio, M.J., Alonso-Rodriguez, B., Ramos, L., Sanz, M.L. 2016. Extraction of bioactive carbohydrates from artichoke (Cynara scolymus L.) external bracts using microwave assisted extraction and pressurized liquid extraction. Food
Chemistry, 196, 1156-1162.
Setyaningsih, W., Saputro, I.E., Palma, M., Barroso, C.G. 2015. Optimisation and validation of the microwave-assisted extraction of phenolic compounds from rice grains. Food Chemistry, 169, 141-149.
Shahidi, F., Varatharajan, V., Oh, W.Y., Peng, H. 2019. Phenolic compounds in agri-food by-products, their bioavailability and health effects. Journal of Food Bioactives, 5. Simić, V.M., Rajković, K.M., Stojičević, S.S., Veličković, D.T., Nikolić, N.Č., Lazić,
M.L., Karabegović, I.T. 2016. Optimization of microwave-assisted extraction of total polyphenolic compounds from chokeberries by response surface methodology and artificial neural network. Separation and Purification Technology, 160, 89-97. Song, J., Li, D., Liu, C., Zhang, Y. 2011. Optimized microwave-assisted extraction of total
phenolics (TP) from Ipomoea batatas leaves and its antioxidant activity. Innovative
Food Science & Emerging Technologies, 12 (3), 282-287.
Spigno, G., De Faveri, D. 2009. Microwave-assisted extraction of tea phenols: a phenomenological study. Journal of Food Engineering, 93 (2), 210-217.
Torrent, J., Arce Menocal, J., López Coello, C., Ávila González, E. 2019. Effects of functional oils on performance and carcass characteristics of broilers under two different temperature environments. Poultry Science, 98 (11), 5855-5861.
Tyug, T.S., Prasad, K.N., Ismail, A. 2010. Antioxidant capacity, phenolics and isoflavones in soybean by-products. Food Chemistry, 123 (3), 583-589.
Xiao, W., Han, L., Shi, B. 2008. Microwave-assisted extraction of flavonoids from Radix Astragali. Separation and Purification Technology, 62 (3), 614-618.
Yang, B., Liu, X., Gao, Y. 2009. Extraction optimization of bioactive compounds (crocin, geniposide and total phenolic compounds) from Gardenia (Gardenia jasminoides Ellis) fruits with response surface methodology. Innovative Food Science & Emerging
Technologies, 10 (4), 610-615.
Yolmeh, M., Habibi Najafi, M.B., Farhoosh, R. 2014. Optimisation of ultrasound-assisted extraction of natural pigment from annatto seeds by response surface methodology (RSM). Food Chemistry, 155, 319-324.
Yu, H., Yang, G., Sato, M., Yamaguchi, T., Nakano, T., Xi, Y. 2017. Antioxidant activities of aqueous extract from Stevia rebaudiana stem waste to inhibit fish oil oxidation and identification of its phenolic compounds. Food Chemistry, 232, 379-386.
Zhao, C.N., Zhang, J.J., Li, Y., Meng, X., Li, H.B. 2018. Microwave-assisted extraction of phenolic compounds from melastoma sanguineum fruit: Optimization and identification. Molecules, 23 (10), 2498.
Zuorro, A. 2014. Response Surface Methodology Analysis of polyphenol recovery from artichoke waste. American Journal of Applied Sciences, 11 (9), 1463-1471.
Zuorro, A., Maffei, G., Lavecchia, R. 2016. Reuse potential of artichoke (Cynara scolimus L.) waste for the recovery of phenolic compounds and bioenergy. Journal of Cleaner