The $100 question:
Supply chain priorities for small firms
byRafaela Pereira Nunes
BS, Naval Engineering, Universidade de São Paulo, 2010 Ramón Paulino
BS, Industrial Engineering, Instituto Tecnológico de Santo Domingo, 2003
SUBMITTED TO THE PROGRAM IN SUPPLY CHAIN MANAGEMENT IN PARTIAL FULFILLMENT OF THE REQUIREMENTS FOR THE DEGREE OF
MASTER OF APPLIED SCIENCE IN SUPPLY CHAIN MANAGEMENT AT THE
MASSACHUSETTS INSTITUTE OF TECHNOLOGY JUNE 2018
©2018 Rafaela P. Nunes and Ramón Paulino. All rights reserved.
The authors hereby grant to MIT permission to reproduce and to distribute publicly paper and electronic copies of this capstone document in whole or in part in any medium now known or hereafter created.
Author: ... Rafaela Pereira Nunes Master of Applied Science in Supply Chain Management May 11, 2018 Author: ... Ramón Paulino Master of Applied Science in Supply Chain Management May 11, 2018 Certified by: ...
Dr. Josué C. Velázquez Martínez Executive Director, Supply Chain Management Blended Program Capstone Advisor Certified by: ...
Dr. Cansu Tayaksi Postdoctoral Associate, Center for Transportation and Logistics Capstone Co-Advisor Accepted by: ...
Dr. Yossi Sheffi Director, Center for Transportation and Logistics Elisha Gray II Professor of Engineering Systems Professor, Civil and Environmental Engineering
1 The $100 question:
Supply chain priorities for small firms by
Rafaela Pereira Nunes and
Ramón Paulino
Submitted to the Program in Supply Chain Management on May 11, 2018 in Partial Fulfillment of the
Requirements for the Degree of Master of Applied Science in Supply Chain Management
ABSTRACT
A large majority of companies in Latin America are micro or small firms, making them an important part of the region’s economy. These firms are a relevant source of jobs, but a lack of managerial skills and resources threatens their survival. In this study, we analyze a set of supply chain best practices and define the more relevant practices for micro and small enterprises in a growth context. Based on a set of interviews and immersion, by way of site visits, with 15 small and micro firms located in Mexico City, we develop a system dynamics model that illustrates the influence of these supply practices on company growth. Our results show that, after quality and service baselines are met, practices related to capacity building, collaboration, and market expansion drive faster growth and should be prioritized by companies that aim for expansion. These insights are a major step in developing more effective assessments and training for micro and small firms in Latin America and improving the overall economic performance of the region. Capstone Advisor: Dr. Josué C. Velázquez Martínez
Title: Executive Director, Supply Chain Management Blended Program Capstone Co-Advisor: Dr. Cansu Tayaksi
2 ACKNOWLEDGEMENTS
This project and our graduation would not be possible without the many people who have supported us along the way.
We would like to thank our advisor and Program Director, Josué Velázquez, for starting this amazing research to improve Latin America’s productivity and allowing us to collaborate on this important endeavor.
We would like to thank our co-advisor, Cansu Tayaksi, for providing insightful feedback and support in developing the work.
We would like to thank the ITESM academic staff, especially Teresa Cotera, Jaime Mendoza, Iván Solares, and Camilo Mora, for their hearty reception and support during our stay in Mexico. Also for the work they and their students developed with the Mexican SMEs that served as a pillar of this work.
We would like to thank the 15 Mexico City companies that shared their operational and strategic data with us. We are also grateful to all the small and micro firm owners who provide more than half of Latin American jobs and are essential to the region’s development.
Finally, we would like to thank our partners in life, Alejandra and Marcos, who encouraged us before we ever started this work, supported us through the journey, and continue to do so after.
3 COMMONLY USED ABBREVIATIONS
BOP : Base of the Pyramid ... 11 DCGM: Data Collection Guidelines Manual ... 12 GDP : Gross domestic product. ... 5, 8 ITESM : Instituto Tecnológico y de Estudios Superiores de Monterrey ... 11, 13, 15 MSEs : Micro and Small Entreprises ... passim OECD : Organisation for Economic Co-operation and Development ... 7 SME: Small and medium entreprises ... 1
4
CONTENTS
ABSTRACT ... 1
ACKNOWLEDGEMENTS ... 2
COMMONLY USED ABBREVIATIONS ... 3
1. INTRODUCTION ... 5
2. LITERATURE REVIEW ... 7
2.1. Small Firms in Developing Countries... 7
2.1.1. Small Firms in Mexico... 8
2.2. Small Business Survival and Growth ... 8
2.3. Supply Chain and Small Business Performance ... 10
3. EXPERIMENTAL SET AND METHODOLOGY ... 11
3.1. The Data Collection Guidelines Manual... 12
3.2. Mexican City Companies Data ... 13
3.3. Systems Model ... 15
3.3.1. Model Basics ... 15
4. RESULTS ... 18
4.1. Classification of Immersion Questions ... 18
4.2. Key Observations from the Interviews ... 19
4.2.1. Not Every Company Wants to Grow ... 19
4.2.2. Growing Small Firms Do Not Pursue Price Differentiation ... 20
4.2.3. Product and Service Differentiation... 20
4.2.4. Building Capacity is Imperative for Growth ... 21
4.3. Mexican Context Visualized in the Model ... 21
4.3.1. Capacity as a Priority to Growth ... 22
4.3.2. Why NOT Cost Reduction? ... 23
4.3.3. Practice Priorities ... 25
5. RECOMMENDATIONS ... 27
5.1. Prioritization Matrix... 27
6. CONCLUSION AND FUTURE RESEARCH ... 32
REFERENCES ... 34
5 1. INTRODUCTION
Latin American countries face a complex economic situation caused by lower growth and the prevailing uncertainty in the global economy. Although the region can withstand short-term recessions, the medium-term outlook is less favorable than in the previous decade (OECD - ECLAC, 2013). The OECD also supports that improving the productivity of the region is imperative to overcome a lack of competitiveness in the medium-term. They believe Small and Micro Enterprises (SMEs) can be an agent of productivity increase due to their impact on the countries’ economies and potential to create high-quality jobs (OECD - ECLAC, 2013).
The labor productivity gap (i.e. GDP per employee) of micro and small firms in Latin America lags significantly behind that of their larger counterparts. For instance, labor productivity of small firms relative to that of large firms ranges from 16% to 36%, while in Europe it ranges from 63% to 75% (OECD - ECLAC, 2013). Since 98% of the firms in Latin America are micro and small, labor productivity is a significant factor that affects the rate of development in the region (OECD - ECLAC, 2013).
Adoption of supply chain and business best practices is associated with performance improvement in large and small firms (McKenzie & Woodruff, 2016) (Lockamy III & McCormack, 2004). The Ministry of Economy of Mexico (2010) defines a small firm as one with fewer than 30 employees. Due to the size of these small firms, it can be difficult to allocate resources to tackle every different potential improvement. Thakkar, Kanda, & Deshmukh (2009) reinforce that the limited amount of employee-time SMEs have makes productivity performance and monetary safety critical for those firms. This limitation on resources makes it imperative for small firms to prioritize their activities. Therefore, for small firms to move towards greater
6 productivity, it is essential not only to implement supply chain practices, but to provide guidance as to which activities are most important for their performance.
The focus of this research is to propose a framework with which these small firms can evaluate and prioritize these best practices for implementation. Based on a literature review focused on SMEs from emerging countries and the study of 15 Mexican Micro and Small Enterprises (MSEs), we use system dynamics to illustrate that supply chain activities are strongly related to small firms’ growth. The final framework that results from this analysis is based on the firms’ competitive advantage and potential to capture business opportunities.
We call this work “the $100 question” because this figure represents the scale of resources that micro and small firms have available to invest in their business improvement, as opposed to “the million-dollar question” that larger firms would face. The decision of where to focus these resources must envision results that will contribute to the survival of the firm. For companies with such limited resources, we identify the practices that will benefit the company the most from a list of other supply chain recommendations proposed in previous studies.
In Chapter 2, we describe our literature review, focused on studies of SMEs and MSEs in the developing world and what drives their survival. In Chapter 3, we present our methodology, involving interviews and assessments of Mexico City companies, and later in Chapter 4 we complement the resulting insights with system dynamics thinking. Finally, in Chapter 5, we recommend a framework that helps small companies prioritize actions according to their current strategy and growth ambitions. Our recommendations are relevant not only for micro and small firms, but for organizations that aim to support small business performance and improve Latin America competitiveness, including private consultants and public-sector organizations.
7 2. LITERATURE REVIEW
In this chapter, we begin by explaining the differences between small and big businesses. We also discuss studies that explore the particulars of small companies in different geographic locations, contrasting companies in developing and developed countries. For developing economies, we present studies that explore the main reasons for business survival: sales growth and the entrepreneur’s managerial skills. We then describe studies that relate managerial skills with business practices, and more specifically, supply chain practices. Finally, we mention studies that relate supply chain practices to firm performance and how our study complements previous works. Our project goal is to weight the relevance of some of these practices and provide small companies with priorities for supply chain practice implementation.
2.1. Small Firms in Developing Countries
The fact that small and big business are different has been recognized for years (Welsh and White, 1981). However, more recent studies point out that these differences extend across regions and show the gap in productivity between small and big firms around the globe (OECD – ECLAC, 2013). The dynamics of a small business are shaped by external policies, macroeconomic scenarios, and the internal motivations of the entrepreneur. As opposed to developed countries, most of the small businesses in developing countries are started not because of an opportunity but due to an entrepreneurial necessity. The different entrepreneurs’ motivations, added to the macroeconomic and political scenario in developing countries, results in a productivity that can be 40 percentage points lower than that of big businesses in Latin America OECD – ECLAC (2013).
8 2.1.1. Small Firms in Mexico
The Ministry of Economy of Mexico (2010) defines micro firms as having fewer than 10 employees or generating annual sales under 4 million MXN1. Companies that fit these criteria represent 95% of the companies in Mexico. For small firms, the Ministry of Economy of Mexico (2010) set the threshold at 30 employees and 100 million MXN in sales; these companies make up an additional 3% of firms in Mexico. Grouped together, these two categories of Mexican firms hold 55% of the jobs and generate 29% of the country’s GDP (Ministry of Economy of Mexico, 2010).
Retail and services lead the way in terms of numbers for micro and small firms with a total of over 1,000,000 each; manufacturing has over 300,000 (Mittelstädt, 2007). For the manufacturing sector, food, textile, and equipment / machinery comprise the top three sub-categories and account for over 75% of all manufacturing micro and small firms. Mittelstädt (2007) details this breakdown in Table 1.
Table 1: Mexican Companies by Sector - Source: Taken from (Mittelstädt, 2007)
2.2. Small Business Survival and Growth
The socioeconomic factors mentioned above not only influence the start of a new business, but shape how the business evolves. Khelil (2015) shows that small companies have either a person
1 MXN is the symbol for “Mexican Pesos”, the current Mexican currency. As of April 22nd, 2018, the exchange rate was 1 MXN = 0.054 USD
Sector Total Number Micro Small Medium and
Large
Retail 1,580,587 97.0% 2.1% 0.8%
Service 1,013,743 94.7% 4.3% 1.0%
Manufacturing 328,718 90.9% 6.0% 3.1%
9 or a company behavior. In the former case, the closure of the company is more related to personal reasons and macroeconomic trends; the person can give up on a business because it is not profitable enough when compared to other job opportunities. In the latter case, the reasons for a business disappearing relate more to managerial skills and business practices.
In a case study of African and Latin American micro and small firms, Liedholm (2002) shows that a 1% in growth in number of employees results in a 5% greater chance of survival. This suggests that growth is a key determinant of small business survival in developing countries. The author also reinforces that, besides growth, human capital matters. The managerial skills that come from vocational training or previous business experience drive better business practices.
Although Liedholm (2002) shows that growing firms are more likely to survive, Nichter & Goldmark (2009) show that not all the small firms that survive will grow. The study shows that growth relates to the profitability of business opportunities and the entrepreneur’s ability to capture those opportunities. The study argues that a common mistake of programs that aim to support and develop MSEs is the assumption that all the entrepreneurs aim to grow their businesses, which is not true. This distinction is fundamental for the success of these programs. Nichter & Goldmark (2009) recommends development programs that consider this differentiation and develop customized interventions to elevate firms’ performance.
Another study related to business growth in small firms (Churchil & Lewis, 1983) presents 5 stages of small business development: existence, survival, success, take-off, and resource maturity. Although the study focuses on a group of companies that can capture the business opportunities for growth and does not focus on the developed world, the survival and success stage recommendations are applicable to MSEs in developing countries.
10 The segmentation of MSEs into two groups -- those that aim for growth and those that aim for survival (Nichter & Goldmark, 2009) -- supports the segmentation of companies into the five stages from Churchil & Lewis (1983). The results of this study are aimed at both companies that aim for growth or survival, but only those that are in the survival and success stages. The companies we analised already have customers and deliver product and services, hence they are already ahead of the existence stage. We argue that a company that arrives in the take-off or resource maturity stage is likely not a MSE anymore. Therefore, existence, take-off, and resouce maturity stages are out of the scope of our study.
2.3. Supply Chain and Small Business Performance
Studies show an association between business practices and business outcomes. For instance, McKenzie and Woodruff (2016) show the positive impact of 26 business practices in the performance and survival of small firms by conducting surveys of companies in seven developing countries. Lockamy III and McCormack (2004) show that planning, collaboration, and measure practices are the most relevant for maturing companies. Motivated by (Lockamy III & McCormack, 2004), Thakkar et al. (2009) present a framework to implement supply chain measure practices in small firms based on a case study with Indian companies.
While these studies discuss the practices that improve productivity and survival in small firms, they do not examine the impact of the order in which these practices are implemented, or their relation to business priorities. This is particularly relevant for the context of MSEs because of their constraints in time (fewer employees) and capital to invest. In this study, we cover this gap by providing small companies priorities from among a list of supply chain recommendations. Due to the small firms’ lack of resources, as presented by Kelliher (2013) and Thakkar et al. (2009),
11 we believe that prioritizing the practices that will generate the best results is key to leveraging a firm’s performance.
Due to the importance of context in developing a comprehensive framework and to control for geographic factors, we limit our study and recommendations to firms in Mexico City. However, as we will show in later sections, we argue that our general guidelines apply to other Latin American firms and small firms in general.
3. EXPERIMENTAL SET AND METHODOLOGY
In this chapter, we describe how we approached the problem of defining which supply chain practices should be prioritized by micro and small firms. We make a comparison between small firms and the “bottom of the pyramid” (BOP). BOP is a socio-economic concept that has been defined and redefined by multiple authors to identify the largest and poorest group of world’s citizens (about four billion people). We argue that small firms are the BOP for business because, although they represent the clear majority of companies, they are only account for 30% of the GDP in Latin America (OECD - ELAC, 2013). For creating impact in the BOP, a deeper understanding of the context is more relevant than a new technology (Jue, 2012). For this reason, the core of our methodology is based on immersion into the small firm environment in Mexico City. We partnered with the Instituto Tecnológico y de Estudios Superiores de Monterrey (ITESM), a renowned Mexican institution2, to recruit companies to participate in the research.
2https://tec.mx/en/ - Ranked 199th in the world by QS ranking, ITESM is a private university located
12 Students from ITESM conducted several interviews with MSEs in Mexico City using the data collection methodology developed at MIT (Velazquez, et al., 2017). We also conducted company visits to observe firsthand the main supply chain challenges companies were facing for growth and survival. Using the data collected by the students and the insights from the visits, we propose a system dynamics model to illustrate the impact of supply chain practices on MSE growth. The relationships between practices and firms’ main challenges presented in the model were key to defining the company priorities and building a prioritization framework.
In the following sections we describe the methodology used for data collection, the experimental set of 15 Mexican companies studied and the proposed system dynamics model.
3.1. The Data Collection Guidelines Manual
The Data Collection Guidelines Manual (DCGM) is a guideline for data collection and assessment of business, operations and supply chain processes in micro and small companies (Velazquez, et al., 2017). The guideline is divided into four main areas, each one developed to assess different competencies of companies:
Questioning and Business Practices: Survey-based assessment of the company in which a company representative answers questions about the company’s general composition, products, operations, and current business and supply chain practices. Companies answer from their perspective.
Rapid Plant Assessment (RPA): Survey-based assessment that evaluates the maturity of Lean Manufacturing practices at the company. The analyst doing the data collection answers the questions from his or her perspective.
13 Immersion: Survey- and observation-based assessment in which the data collection analyst inserts themselves into the company’s processes. It serves as validation to the information provided in the Questioning and Business Practices. The analyst doing the data collection answers the questions from his or her perspective.
Shadowing: Observation-based assessment of the activities and time management of the company’s key decision maker. The data collection analyst gathers the information by following the decision maker through a normal day.
Although the ITESM students used the entire methodology to collect data from our experimental set, in this study we focus on the data from the Immersion area. This area is based on the supply chain processes of SCOR model (Supply Chain Council, 2010) adapted for the context of small firms. Even though there are studies with best business practices aimed at small firms (McKenzie & Woodruff, 2016), there is a gap in supply chain related practices. Thus, we chose to focus on “Immersion” questions to fill this gap.
3.2. Mexican City Companies Data
The students from ITESM used the surveys in the DCGM (Velazquez, et al., 2017) to gain an understanding of the company’s use of best practices, its strategies, and its current challenges. As part of their work, the students made recommendations on what the companies need to improve based on their current adoption of best practices, gaps, and challenges.
We collected interview data from our conversations with small business owners. This information was gathered through in-person visits to four small-sized companies in the Mexico City metro area: MEX1, MEX6, MEX8 and MEX10 (see Table 2 below for more details about these companies). In addition, students performed their own data collection for all the companies in Table 2.
14 In addition to general questions from the DCGM, in the visits we asked questions about companies’ competitive advantage. We particularly asked the general manager: “What is your main advantage among your competitors” and explored the question with some examples of main competitors. We also took the main recommendations from the students who interviewed the company and summarized it as “main challenges”. Both “Competitive advantage” and “Main challenges” are presented with general manager and company socioeconomic data in Table 2.
Table 2: Experimental setting: 15 Mexico City Small Companies
Table 2 contains a mix of companies from manufacturing, service, and retail/commerce sectors; most of the companies surveyed belong to manufacturing. This is to be expected, since most of the companies are small (between 10 and 30 employees), a size where the disparity in numbers between micro and small companies is not drastic.
ID Age
(years)
Size
(employees) Sector Industry Competitive advantage Main challenges MEX1 16 25 Commerce Energy - Features - end to end solution - Cost reduction
- Internal communication gaps MEX2 36 26 Manufacturing Equipment - Quality (durability)
- Market pioneer
- New players
- Process standardization MEX3 33 na Manufacturing Food and Beverage - Quality- Branding - Increase machine capacity- Increase machine flexibility
MEX4 6 20 Manufacturing Food and
Beverage - Quality (international standard)
- Entering new markets - export - Increase machine capacity MEX5 17 20 Manufacturing Safety Equipment - Quality- Service (fast delivery) - Customer collaboration- Process standardization
MEX6 21 14 Manufacturing Textile - Innovation
- Quality
- Market Expansion MEX7 9 36 Service Marketing - Market pioneer- Quality - Market Expansion
MEX8 20 18 Service Commercia
l Printer
- Price - Quality
- Getting into new markets - Fierce competition MEX9 9 na Service / Commerce Wellness - Features - end to end solution- Service - Market Expansion- Inventory Management MEX10 na na Manufacturing Furniture - Quality / Service
MEX11 na 3 Commerce Party
articles
- Relationship - Price
- Training - delegate - Inventory control MEX12 50 90 Manufacturing / commerce Furniture - Service (personalized project)- quality - Build a growth strategy (organization/capacity)
MEX13 10 19 Manufacturing Plastic - Features
- Quality - Increase Capacity
MEX14 1 2 Commerce Toys - Innovation- Quality - sustainable sourcing - Market Expansion MEX15 10 20 Manufacturing Plastic - Features (do things big
companies don't want)
- Capacity + efficiency - Price strategy
15 These companies have very different profiles. For example, they vary widely in age (from 1 year in the market to 50). However, they all fit the size and geography that this paper focuses on. In terms of size, they range from as few as two employees to as many as 90, although most of the companies are close the overall average size of 25 employees. This is in line with common micro and small Mexican companies in the sector as defined by Mexico’s Ministry of Economy.
Using the data collected using the DCGM, interviews with small company owners, and data collected by ITESM students and faculty, together with our literature review that focuses on the main challenges of MSEs in the developing world, we designed a model that expresses the relationship between best practices and the growth of small firms.
3.3. Systems Model
Given that growth is an influential factor in increasing the likelihood of survival of micro and small firms (Liedholm, 2002), we use system dynamics thinking, specifically a custom variation of the Limits to Success archetype detailed in (Kim & Anderson, 2011). This model relates internal and external factors to a firms’ sales growth. Using this model as a basis, we added variables that describe the relationships between small firms’ growth and best practice implementation.
3.3.1. Model Basics
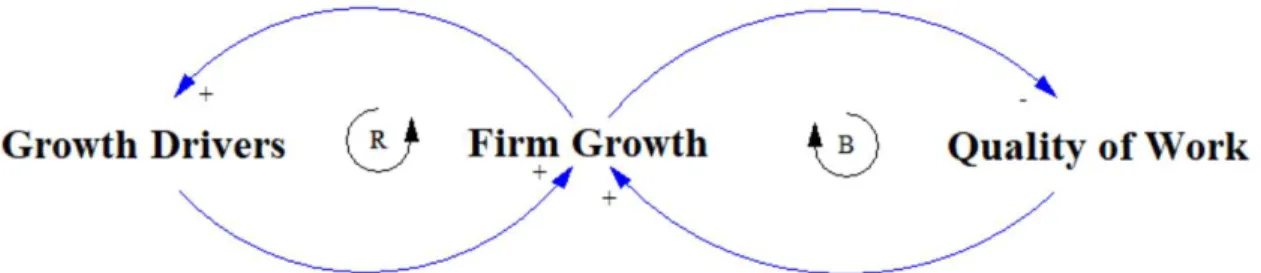
To illustrate the basic structure of our model, we present a section of our Limits to Success archetype (Kim & Anderson, 2011), as depicted in Figure 1.
16
Figure 1: Sectionalized Limits to Success casual loop diagram (Kim & Anderson, 2011)
This section of the Limits to Success model (Kim & Anderson, 2011) highlights the basic construct of system dynamics modeling: feedback loops. These loops are created through the cause and effect relationship among variables in the model. A positive sign indicates that an increase in one variable will result in the increase in the connected variable. A negative sign indicates the opposite, that an increase in the causal variable would result in a decrease in the connected variable. These relationships form loops, which can be reinforcing (R) or balancing (B). Reinforcing loops result in behavior that is either exponentially increasing or decreasing, ultimately reinforcing each other. In contrast, balancing loops lead to the system finding a stable state, and as a result, limiting the growth or decline of the variables involved (Sterman, 2000).
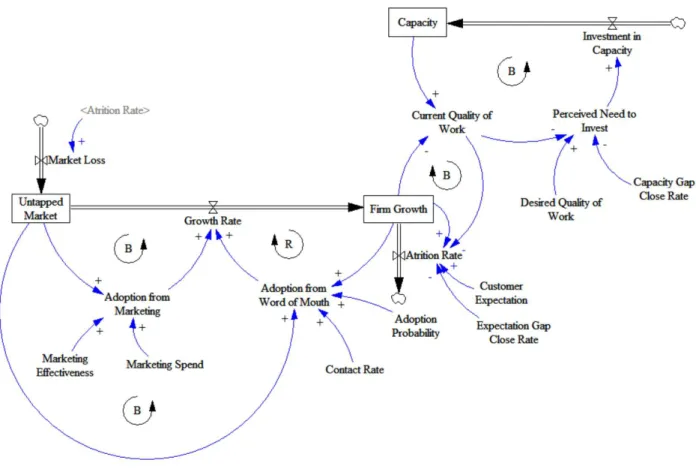
We base our modeling on the Limits to Success archetype described by (Kim & Anderson, 2011). This archetype offers the basic structures for growth that we want to test our assumptions on. Starting from this archetype, we build the baseline model described in Figure 2 and Figure 3 (see Exhibit B for model specifications).
17
Figure 2: Casual Loop Diagram representation of the baseline model
18 In the RESULTS section, we detail how we derive insights from this model by interposing the observed relationships between supply chain practices and the related loops they affect in the model.
4. RESULTS
4.1. Classification of Immersion Questions
We classify the 40 questions from the DCGM Immersion section based on the main challenges of the Mexican companies presented previously in Table 2. We assign to each question a performance attribute driven by the practice. We use 7 performance attributes split into two categories: “growth drivers” and “baseline keepers”. The summary of the classification is in Table 3. A more detailed breakdown is found in Exhibit A.
Table 3: Summary of Immersion Practices Classification
We use “growth driver” to classify the performance levers that lead to new customers or an increase in sales in existing customers: marketing practices, collaboration practices and capacity increase. As “baseline keepers”, we classify the practices that drive better performance with existing customers. The baseline keepers drive firm efficiency but do not necessarily bring about new sales. However, these “baseline keepers” are essential for retaining the current sales or the current sales “baseline”.
Impact category Performance Immersion practices
Growth driver Capacity 5
Growth driver Collaboration 2
Growth driver Marketing 2
Baseline keeper Quality 6
Baseline keeper Service 9
Baseline keeper Cost - Control 10 Baseline keeper Cost - Reduction 6
19 This classification is important for differentiating priorities among companies that are willing to grow between those that do not have this goal. Although the non-growing companies are less likely to survive and growth is the best way to increase the probability of survival (Liedholm, 2002), growth is not the only factor that explains survival. Market conditions, human capital, and managerial skills, for instance, are also important. Therefore, non-growing firms can also increase their survival through better management (i.e. best practices). Excluding non-growing firms from the scope would only deteriorate their competitiveness (Nichter & Goldmark, 2009). The importance of this differentiation, as observed in our sample of Mexican companies and in the literature (Nichter & Goldmark, 2009), is central to the framework proposed in the RECOMMENDATIONS section.
4.2. Key Observations from the Interviews 4.2.1. Not Every Company Wants to Grow
In our survey data we observe that, although firms that grow are more likely to survive (Liedholm, 2002), not all small firms seek growth. We observed in the companies surveyed that, as Nichter & Goldmark (2009) stated, some firms are not growing because of lack of business opportunities and others because they do not know how to capture those opportunities.
For instance, firm MEX8 is a commercial printer that, even though it is focusing on service and quality products, its market decreased in the past year; indeed, the business opportunities in their market are disappearing. On the other hand, we observe that company MEX11, a small retail store with a close-to-retirement entrepreneur at its head and two additional employees, cannot offer the same value for customers because they are aging and cannot do the same physical activities as before. The owner does not want to replace employees because of their long-term relationship. In
20 this case, despite their market remaining unchanged over the years, the business owner is not seeking to grow.
4.2.2. Growing Small Firms Do Not Pursue Price Differentiation
We observe in the data compiled that the companies looking to grow are differentiating themselves by offering different solutions (MEX9, MEX13, MEX14), high quality products (MEX8), or more variety (MEX6), among other strategies. Price, although a minimum requirement to compete in the space, is not one of the sources of differentiation for these companies. The micro and small companies that we are analyzing are not startups, but well-established firms with years of experience. This indicates that they have already achieved the price point level that would allow them to enter the market; the minimum requirement of price is met. To grow, they seek differentiations not related to price.
4.2.3. Product and Service Differentiation
For firms that offer product or service differentiation, one of the main challenges is making customers aware of the choices. They also need to increase capacity to accommodate business growth. MEX6 and MEX14 are two examples of companies on this growth path.
In addition, we see companies that feel that they have offer a different type of integration for customers. In this category we have companies like MEX13, which offers design services on top of the more traditional injection molding business offered by the competition. And MEX3, which sells energy projects and services on top of selling generators. MEX9 also tries to blur the line between product and service by offering their customers wellness instruction courses and all the product and equipment necessary for a wellness business.
21 4.2.4. Building Capacity is Imperative for Growth
There can be no growth without building capacity. This extends not only to machine capacity but to human capital expansion via hiring, training, and delegation. The micro and small companies surveyed in this paper exhibit a high dependency on owner knowledge, with a few key individuals in managerial/supervisory roles. Take, for example, company MEX13. This company operates with production supervisors that set up the machines. If the supervisor is not available, the company owner is the only other person with the technical knowledge to do the machine setup; the rest of the employees, although veterans with the company, have are not empowered to do so.
4.3. Mexican Context Visualized in the Model
In this section, we use the adapted Limits to Success archetype (Kim & Anderson, 2011) to walk through some of the situations observed in the Mexican companies surveyed. These insights help us to develop relationships that aid in prioritizing the different best practices.
22 4.3.1. Capacity as a Priority to Growth
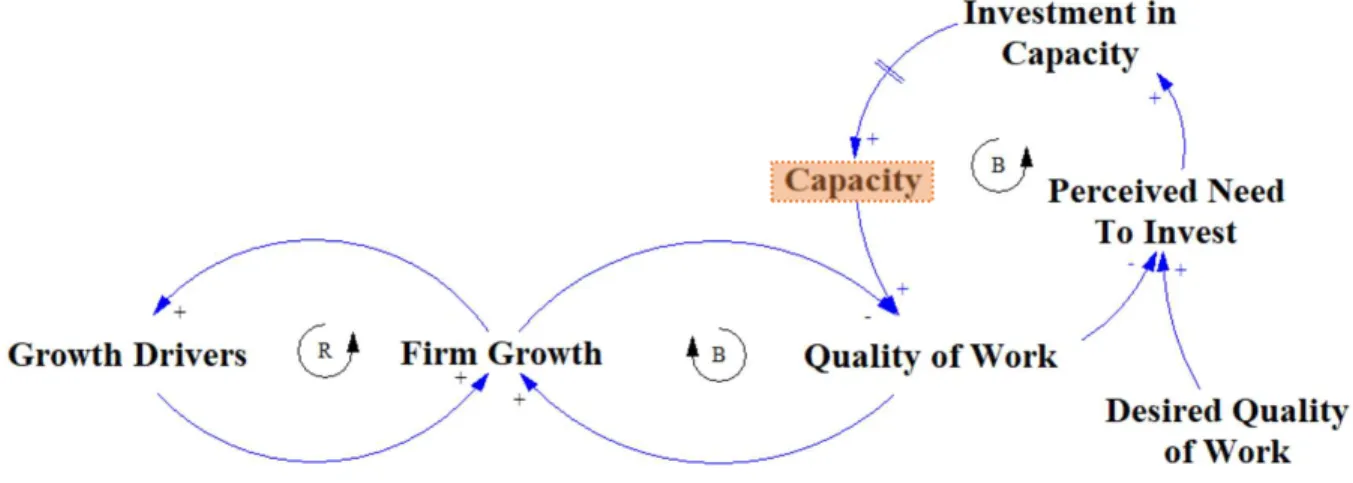
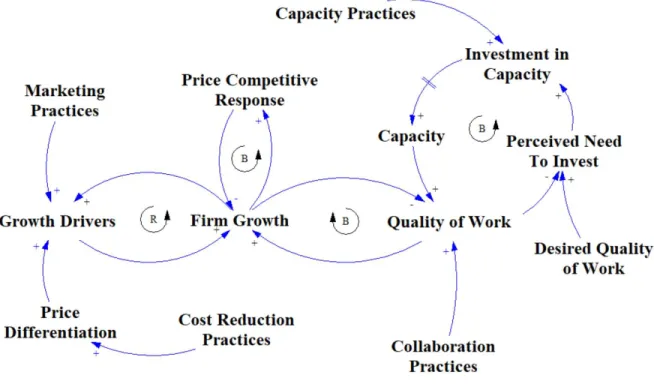
We first test the basic assumptions of the model. Because the model focuses on firm growth (i.e. sales), we want to see what the steady state of the system would be with no external intervention. Under this model, the limiting factor for Firm Growth is Capacity (see Figure 4).
Figure 4: Casual loop representation of model
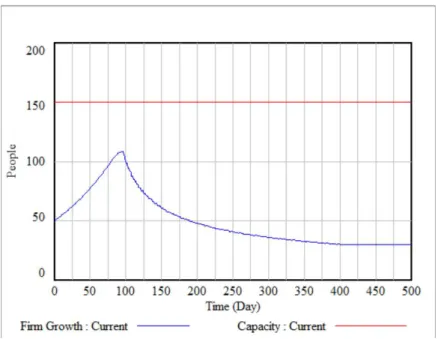
23 In Figure 5, the blue line (curve) represents the number of customers the firm has at a given time, while the red line (straight line at y =100) shows the overall system capacity the firm can serve as measured in number of people. In this situation, the lack of capacity is the limiting factor to growth. This aligns with the realities of the companies surveyed. Companies like MEX3, MEX4, and MEX13 have capacity issues, and the main recommendations presented by the ITESM students point to ways of increasing that capacity. When it comes to micro and small companies that are looking at a growth path, the priority is very clear: where capacity constraints exist, the priority for growth is to invest time and resources in increasing this capacity.
4.3.2. Why NOT Cost Reduction?
Cost reduction practices are a staple of the operating handbook of large firms. We observe supply chain best practice initiatives that measure their success in financial savings to the company, and companies that look to establish a competitive advantage with their supply chains through being the lowest cost provider (Fisher, 1997).
We continue to test this type of initiative in a small firm by adding to the model the interaction of cost reduction best practices. This results in a differentiation advantage for the small firm as low-cost provider.
24
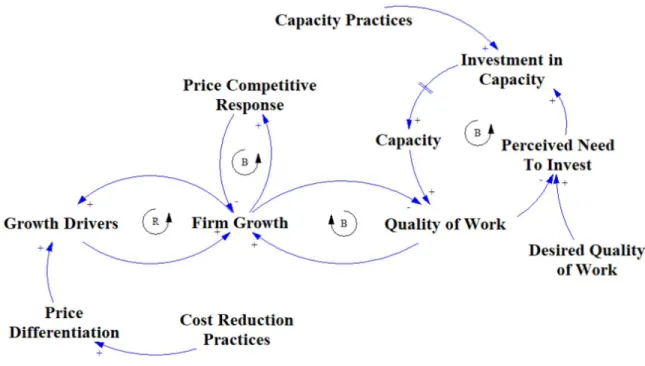
Figure 6: Causal Loop representation of different initiatives
Price differentiation does not have the same effect for a small firm that it could have for a large firm. Large firms can use strategic cost reduction to achieve a cost leadership in the market and expand their market share (Taqi, 1987). Due to their size, large firms can achieve economies of scale that smaller firms cannot. In contrast, as shown in Figure 7, the cost leadership advantage for a small firm quickly erodes. This is a result of a quick competitive response from larger firms, as depicted by the balancing loop with the Price Competitive Response in Figure 6.
25
Figure 7: Attrition behavior due to Competitive Response
In Figure 7 the blue line (curve) represents a firm’s growth in sales. We observe that the firm has a steeper climb in number of customers. However, the growth is temporary, since once a larger competitor takes notice of the price competition, they respond with their own price reduction. This causes the company’s previous advantage to disappear.
Even though we see here how price differentiation through cost reduction would not be the right priority for a small firm that focuses on growth, cost-oriented practices still play a role for firms. In the RECOMMENDATIONS section, we present a framework for deciding when these practices should and should not be prioritized.
4.3.3. Practice Priorities
The attrition observed in Figure 7 calls out another important relationship in the model: the importance of retaining and satisfying current customers. As the company in the model begins to grow, resources are depleted and current business suffers. Implementing best practices can
26 enhance the ability to serve customers in the categories that influence the buying decision, for example, quality or service. This helps the company retain its current business.
The key to growth in a dynamic environment is to break the loops that restrain growth from either the supply side or the demand side. For the companies we have been working with in Mexico City, this has meant differentiating in areas where competitors may not offer equal value. This includes offering integrated solutions that are not common in the market place, offering flexibility in lead time or lot size, or providing customized services or products. In the case of our simple company model, this means looking at the Demand Growh Drivers and the Quality of Work. These practices have the same effect of facilitating growth, but, unlike the price differentiation, the ability of large firms to offer a competitive response are not as easily adjusted as price, as they require bigger changes in the way the company operates which result in longer delays.
27 5. RECOMMENDATIONS
In this section we consolidate the insights from our interviews, the data collected from the Mexico City companies, and the adapted model of the Limits to Success archetype (Kim & Anderson, 2011) into a prioritization framework for micro and small firms. We present this framework as both a matrix, for a high-level overview of priorities, and as a flow chart, with more detail on the levels and the order of prioritization decisions.
5.1. Prioritization Matrix
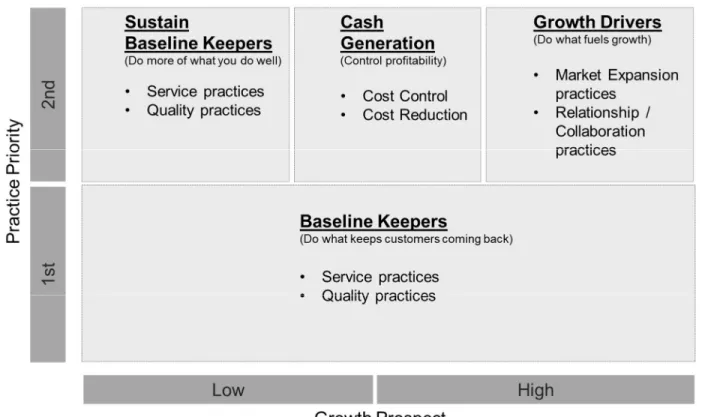
To guide firms’ priorities and training programs, we present a framework that guides companies in selecting the supply chain practices they should prioritize based on the firms’ competitive advantage and willingness to grow. We summarize this framework in the matrix depicted in Figure 9.
28 The practices the in the “1st” level of Figure 9 have a higher priority than those in the “2nd” level. First, small firms should focus on practices that help maintain the current differentiation of the firm in the eyes of customers (“baseline keepers”). Small firms need to define if their customers come to them because of service differentiation or quality differentiation, or both, and prioritize these practices first.
Once the first priorities are met, the firm moves to those practices that align with its growth prospects. For companies with a high growth outlook, “the growth drivers” become the second priority; for companies with a low growth outlook, maintaining the “baseline keepers” remains the priority. Cost oriented practices sit in between as useful to both groups of companies, but not necessarily as growth drivers. In the next session, Prioritization Framework, we break down this matrix into a decision tree and explore, in more detail, the appropriate path for each group of companies.
5.2. Prioritization Framework
The matrix presented in Figure 9 is a simplified version of the prioritization framework. In Figure 10 we present a more detailed description, in the form of a flow chart.
29
Figure 10: Framework for Small Firms SCM Priorities
At the top of the priority order are practices related to quality and service. They should be prioritized by all the companies independent of growth outlook. We call these practices “baseline keepers” because, even though they will not fuel growth, they will keep the current customers satisfied and willing to buy again. What we observe from the companies studied is that companies that are in a growth path tend to have these processes already well-developed. For example, company MEX 13 emphasizes delivering on-time and within the specification requirements. This
Product
Differentiation DifferentiationService Price Service
Cost Control
Growth drivers Practices
Baseline keepers Practices
Capacity
Market
expansion CollaborationRelationship
Strategy review Capacity Building Cash Generation Practices Quality P R I O R I T Y O R D E R GROWTH N Y Y
GROWTH STRATEGY
Y START LEVEL 1 ALL COMPANIES LEVEL 2 GROWING COMPANIES Cost Reduction30 is a main source of value to their customers, and allows them to differentiate from other potentially lower-cost rivals.
Cash generation practices are next in the priority order. The cost control practices, although important for the company’s financial health, will not keep or acquire new customers. However, they are essential to support sustainable growth and operations of the company.
The third element in the priority order is the firm’s growth. If the firm is looking to grow, we suggest priorities based on the firm’s growth strategy. If the firm is not looking to grow, they should keep focus on the first two elements of the framework, “baseline keepers” and cost control, to keep the business on track.
For the growing firms, the priorities relate to the firms’ growth strategy and differentiation conditions. In any scenario, the firm must ensure they will plan capacity to support growth. Therefore, capacity planning is a priority for growing firms.
If the firm has planned capacity, they should then invest in practices that fuel growth according to their strategy. For firms competing in the product differentiation market, expansion practices will bring forth new customers. For firms competing in service differentiation, which means flexibility of delivering different services adapted to customers’ needs, growth will more likely come from current customers asking for new variations of the current services. Therefore, activities related to customer collaboration and relationship building are key.
As we have discussed, engaging in price competition can be misguided for small firms. This strategy drives short-term growth but does not sustain long-term growth. For the price strategy, our framework provides recommendations, but also provides an “attention sign” showing that, even-though companies should focus on “cost reduction” practices, those activities will not
31 fuel grow. For firms competing on price, more than recommending supply chain priorities, we recommend a strategy review. Price competition should not be a focus of small companies in our scope stage (i.e., survival and beginning of business success) (Churchil & Lewis, 1983).
For instance, MEX6, a customer manufacturer, is planning to expand their online operations and start selling in physical Walmart stores. In this case, they might have to compete in price with Asian manufactures and focus on cost reduction practices. As a small firm, they do not have the same monetary safety as large manufacturers (Hudson, Smart, & Bourne, 2001). They run the risk of not having enough cash to sustain this big move, even if they focus on cost reduction practices. For a company like MEX6, our recommendation is to keep their current strategy of product differentiation in online and private stores where the consumer sees the benefit of exclusivity and quality instead of opting for a channel dominated by price. If a company does decide to go for more price competitive channels, the cost reduction practices are imperative for the financial health of the company.
We encourage firms to use our framework as a tool to guide priorities after assessing their own adoption of the immersion practices (Velazquez, et al., 2017). This tool is suitable for firms that have a growth strategy but also for those that do not aim for growth. For “non-growers”, we recommend using practices to maintain and improve quality and service. For growing firms, once quality and service baselines are met, they should focus on practices that are growth drivers, such as market expansion and improving relationships with existing customers while making sure they build capacity to capture the new demand.
For growing companies, the degree to which a company should focus on the “baseline keepers” and control practices also depends on how fast their markets are growing. In the extreme case of startups, for example, the “growth drivers” practices should even overtake the priority,
32 since timing is crucial to capture the new growing market. In this study, we are not focusing on startups but on small companies that are in more stable markets. For that reason, we believe quality and service are essential for them to compete.
To improve the efficiency of micro and small firms, training programs should take into consideration the current level of adoption of quality and service practices, the firms’ strategy, and its growth outlook. As Nichter & Goldmark (2009) already highlighted, the segmentation of MSEs and their diverse needs is a powerful alternative to the traditional development programs for MSEs.
6. CONCLUSION AND FUTURE RESEARCH
Improving the productivity of micro and small firms is imperative for Latin American development. These companies represent a large majority of companies in the region and have untapped potential. Although previous studies recognize the relationship between business practices and the importance of tailor-made guidance for micro and small firms, there is a gap when it comes to giving those firms the priorities to improve their business. Micro and small firms have limited resources and, as a result, the decision of which business practices to prioritize can be the threshold for them to adopt best practices.
Based on a set of interviews with 15 micro and small firms in Mexico City and a literature review focused on emerging economies, we dove into the supply chain challenges small firms are facing in Latin America. We used this knowledge to build a system dynamics model that represents the main relationships between supply chain practices and growth, which our results show is a key indicator of the chances of survival for the firm.
We found that price competition can be dangerous for small firms, and they should focus on flexibility and product differentiation strategies. Larger competitor can quickly respond to price
33 competition from smaller firms, and have economies of scale that provide an advantage. Small firms, on the contrary, can find better paths to growth by differentiating in other areas. After achieving a baseline of service and quality practices, small firms that are looking to grow can focus on the practices that will drive expansion.
To boost their growth, companies should prioritize actions according to their growth strategy. For all the growing companies, building capacity is critical for expansion. For those that offer different products, market expansion practices are important for reaching new customers and boosting grow. Companies that stand out because of service differentiation should invest in relationship and collaboration with customers. Companies that do not aim to grow, either because of lack of opportunities or capabilities to capture them, should still invest in service and quality to keep the current level of sales.
Although our conclusions come from the interviews from 15 MSE from Mexico City, they provide insights that translate to other contexts. We observed company behaviors related to growth similar to those observed in other studies, like (Nichter & Goldmark, 2009), and thus, this study is relevant for both Mexican and Latin American development. Our framework will not only help micro and small firms to prioritize decisions but support governments to better develop training programs and interventions aimed at micro and small firms. Our work also contributes to a not much explored area of supply chain management: small and micro firms in emerging economies.
For future research, we suggest studying the implications of the framework in the context of other small companies in Latin America. For this, researchers might consider what drives firms growth in the region and support their activity prioritization. This prioritization will leverage their performance, increase their survival, and overcome the region’s lack of competitiveness.
34 REFERENCES
Bates, T. (2005). Analysis of young, small firms that have closed: delineating successful from unsuccessful closures. Journal of Business Venturing, 343–358.
Churchil, N. C., & Lewis, L. V. (1983, May-June). The five stages of small business growth. Harvard Business Review, pp. 30-50.
Fisher, M. L. (1997, April). What Is the Right Supply Chain for Your Product? Harvard Business Review, 75(2), pp. 105-116.
Hudson, M., Smart, A., & Bourne, M. (2001). Theory and practice in SME performance
measurement systems. International Journal of Operations & Production Management, 1096-1115.
Jue, D. M. (2012). From the Lab to the Land: Social Impact Technology Dissemination in Rural Southern India. Cambridge: Massachusetts Institute of Technology.
Khelil, N. (2016). The many faces of entrepreneurial failure: Insights from an empirical taxonomy. Journal of Business Venturing, 72-94.
Kim, D. H., & Anderson, V. (2011). Systems Archetype Basics. Waltham, Massachusetts, USA: Pegasus Communications, Inc.
Liedholm, C. (2002). Small Firm Dynamics: Evidence from Africa and Latin America. Small Business Economics, 227–242.
Lockamy III, A., & McCormack, K. (2004). Linking SCOR planning practices to supply chain performance. International Journal of Operations & Production Management, 1192-1218.
McKenzie, D., & Woodruff, C. (2016). Business Practices in Small Firms in Developing Countries. Management Science, 1-16.
Ministry of Economy of Mexico. (2010). Secretaría de Economía - Empresas. Retrieved from Secretaría de Economía:
http://www.2006-2012.economia.gob.mx/mexico-emprende/empresas
Mittelstädt, A. (2007). SMEs in Mexico : issues and policies. Paris, France: Organisation for Economic Co-operation and Development.
Nichter, S., & Goldmark, L. (2009). Small Firm Growth in Developing Countries. World Development , 1453–1464.
OECD - ELAC. (2013). Latin American Economic Outlook - SME POLICIES FOR STRUCTURAL CHANGE. OECD - ELAC.
Silva Rodríguez de San Miguel, J. A. (2017). Small and medium-sized businesses in Mexico. Revista Espacios, 38(57), p. 13.
Sterman, J. (2000). Business Dynamics: Systems Thinking and Modeling for a Complex World. McGraw-Hill Higher Education.
Supply Chain Council. (2010). Supply Chain Operations Reference Model. Supply Chain Council.
Taqi, S. J. (1987). Strategic cost reduction: How international companies achieve cost leadership. Geneva, Switxerland: Business International.
Thakkar, J., Kanda, A., & Deshmukh, S. (2009). Supply chain performance measurement framework for small and medium scale enterprises. Benchmarking: An International Journal, 702-723.
35 Trung , & Belihu, M. (2010). Increasing the performance of SMEs in supply chains of large
enterprises: A SME perspective. Gävle: Gävle University.
Velazquez, M. J., Castañon, X., R., B., G., M., C., M., & J.A., L. (2017). Micro SCM:
Leveraging SCM decisions in small firms @Latin America. Data Collection Guidelines Manual – Version 4.0. MIT. Cambridge.
Welsh, J. A., & White, J. F. (1981, July). A Small Business Is Not a Little Big Business. Harvard Business Review.
36 APPENDIX
Exhibit A - Immersion practices with indication of drivers
Section Question Related Category Drives
Immersion Production cap: Bottleneck identified Production cap Capacity
Immersion Production cap: Delivery time known Production cap Capacity
Immersion Production cap: Future demand match known Production cap Capacity
Immersion Production cap: Plant capacity know Production cap Capacity
Immersion Production cap: Plant utilization known Production cap Capacity Immersion Planning: Suppliers share demand information Planning Collaboration Immersion Supplier net: Suppliers periodical meeting Supplier net Collaboration Immersion Stock Mgmt: Stock reception process described Stock Mgmt Cost - Control Immersion Stock Mgmt: Stock revision periodically performed Stock Mgmt Cost - Control Immersion Stock plan: Average inventory is calculated Stock plan Cost - Control Immersion Stock plan: Average inventory is known Stock plan Cost - Control
Immersion Stock plan: Stock rotation is known Stock plan Cost - Control
Immersion Supplier: Advanced profiles identified Supplier Cost - Control
Immersion Supplier: Basic profiles identified Supplier Cost - Control
Immersion Supplier: Procurement process described Supplier Cost - Control
Immersion Supplier net: Company contracts evidence Supplier net Cost - Control Immersion Supplier net: Purchased orders evidence Supplier net Cost - Control
Immersion Stock plan: Maximum stock determined Stock plan Cost - Reduction
Immersion Stock plan: Minimum stock determined Stock plan Cost - Reduction
Immersion Stock plan: Order consolidation for discount Stock plan Cost - Reduction
Immersion Supplier: Price and quality compared Supplier Cost - Reduction
Immersion Supplier net: Payment way negotiation Supplier net Cost - Reduction Immersion Supplier net: Price or discount negotiation Supplier net Cost - Reduction Immersion Planning: Most popular products identified Planning Marketing Immersion Planning: Most profitable products identified Planning Marketing
Immersion Delivery: Customer preference known Delivery Quality
Immersion Planning: Product elaboration instructions defined Planning Quality
Immersion Planning: Product especification defined Planning Quality
Immersion Planning: Resources registered Planning Quality
Immersion Stock Mgmt: Adequate stock storage Stock Mgmt Quality
Immersion Supplier: Price and quality compared Supplier Quality
Immersion Delivery: Decision rules defined Delivery Service
Immersion Delivery: Order priority rules defined Delivery Service
Immersion Delivery: Product delivery described Delivery Service
Immersion Stock plan: Delivery information recorded Stock plan Service Immersion Stock plan: Priority rules defined (production or service order Stock plan Service
Immersion Stock plan: Shortages identified Stock plan Service
Immersion Stock plan: Stock policy can be described Stock plan Service
Immersion Supplier: Failed delivery registered Supplier Service
37
Exhibit B - Model Specifications Adoption from Marketing=
Untapped Market*Marketing Effectiveness*Marketing Spend Units: People/Day
Number of people turning into customers because of marketing Adoption from Word of Mouth=
Adoption Probability*Contact Rate*Untapped Market*Firm Growth/(Firm Growth +Untapped Market)
Units: People/Day
Represents the number of people that adopt through word of mouth exposure
Adoption Probability= 0.00035 Units: 1/Contacts
Probability a person would adopt after contact with a customer Attrition Rate=
MAX(0, Firm Growth*(Customer Expectation-Current Quality of Work)/Expectation Gap Close Rate ) Units: People/Day Capacity= INTEG ( Investment in Capacity, 150) Units: People
Amount of internal capacity the company has to fulfill its
responsibilities to customers measured in people that can be serviced per day
Capacity Gap Close Rate= 10
Units: Day/People
The rate at which the perceived need to invest adjusts to close the gap between current and desired quality of work. Competition Price Response=
Firm Growth*RAMP(0.0005, 70 , 400 ) Units: **undefined**
Contact Rate= 25
Units: Contacts/Day
number of contact per day per person Current Quality of Work=
38
Units: People/People
This is quality of work and attention that can be put to every
customer and it is represented by the amount of extra capacity available.
Customer Expectation=
Competition Price Response Units: Dmnl
The customer's expectation of quality of work Desired Quality of Work=
1 Units: Dmnl
Desired level of extra capacity needed to attend to current customers
Expectation Gap Close Rate= 1
Units: Day
Time in which customers leave the firm once their quality of work expectations are not met
FINAL TIME = 500 Units: Day
The final time for the simulation. Firm Growth= INTEG (
Growth Rate-Attrition Rate, 50)
Units: People
Represents the number of customers the company has Growth Rate=
MAX(0,MIN( (Adoption from Marketing+Adoption from Word of Mouth) , (Current Quality of Work
-Customer Expectation) )) Units: People/Day
This signifies the rate of growth for the firm, that is, the rate at which it attracts customers INITIAL TIME = 0
Units: Day
The initial time for the simulation. Investment in Capacity=
MAX(0, Perceived Need to Invest ) Units: People/Day
Market Loss=
Attrition Rate Units: People/Day
39 Marketing Effectiveness= 0.00025 Units: Dmnl Marketing Spend= 0 Units: 1/Day
Perceived Need to Invest=
(Desired Quality of Work-Current Quality of Work)/Capacity Gap Close Rate Units: People/Day
The need estimated to close the gap between current work quality performance and desired work quality performance. SAVEPER =
TIME STEP Units: Day [0,?]
The frequency with which output is stored. TIME STEP = 1
Units: Day [0,?]
The time step for the simulation. Untapped Market= INTEG (
Market Loss-Growth Rate, 1e+06)
Units: People
Represents the number of people that have not yet become customers of the company