HAL Id: in2p3-00159377
http://hal.in2p3.fr/in2p3-00159377
Submitted on 27 Jun 2008
HAL is a multi-disciplinary open access
archive for the deposit and dissemination of
sci-entific research documents, whether they are
pub-lished or not. The documents may come from
teaching and research institutions in France or
abroad, or from public or private research centers.
L’archive ouverte pluridisciplinaire HAL, est
destinée au dépôt et à la diffusion de documents
scientifiques de niveau recherche, publiés ou non,
émanant des établissements d’enseignement et de
recherche français ou étrangers, des laboratoires
publics ou privés.
Improvement in the reconstrution method for VAMOS
Spectrometer
S. Pullanhiotan, A. Chatterjee, B. Jacquot, A. Navin, M. Rejmund
To cite this version:
S. Pullanhiotan, A. Chatterjee, B. Jacquot, A. Navin, M. Rejmund. Improvement in the
reconstru-tion method for VAMOS Spectrometer. XVth Internareconstru-tional Conference on Electromagnetic Isotope
Separators and Techniques related to their Applications (EMIS2007), Jun 2007, Deauville, France.
pp.4148-4152, �10.1016/j.nimb.2008.05.024�. �in2p3-00159377�
Improvement in the reconstruction method for VAMOS spectrometer
S. Pullanhiotan
a,b,∗ , A. Chatterjee
a,c, B. Jacquot
a, A. Navin
aand M. Rejmund
aa
Grand Acc´el´erateur National d’Ions Lourds (GANIL), CEA/DSM - CNRS/IN2P3, Bd Henri Becquerel, BP 55027, F-14076 Caen, France
b
Inter University Accelerator Centre, Aruna Asaf Ali Marg, New Delhi, 110067, India and Dept. of Nuclear Physics, Andhra University, Visakhapatnam-530003, A.P, India.
c
Nuclear Physics Division,Bhabha Atomic Research Centre, Mumbai, 400085, India
Abstract
The VAMOS spectrometer at GANIL is a large acceptance magnetic spectrometer employing a trajectory reconstruction technique to identify the reaction products. The spectrometer when coupled with the EXOGAM clover array provides a powerful tool for the spectroscopy of very weak reaction channels. Parameters are reconstructed using a numerical procedure with a polynomial relationship between the measured final coordinates and the quantities of interest. The coefficients of this polynomial function are determined from a numerical fit to the data generated from ray-tracing calculations using the ion optics code ZGOUBI. To reconstruct each parameter, a single polynomial is used with a set of coefficients that are valid across the full accepted phase space of the spectrometer. To further improve upon the reconstruction method, we developed an alternate procedure for reconstruction based on selecting an optimum set of trajectories and interpolating the data within these trajectories. For each detected event, a set of coordinates lying close to the measured trajectory are selected from the database and the target parameters of interest are determined by polynomial interpolation. The results for the reconstructed parameters using the two methods are presented.
Key words: Magnetic spectrometer, trajectory reconstruction PACS: 07.55.-w, 29.30.-h
1. Introduction
The VAMOS spectrometer is a large acceptance ray trac-ing spectrometer [1] used for selecttrac-ing the reaction prod-ucts from heavy ion reactions using both, the direct beams from the GANIL cyclotrons and the SPIRAL [2] beams. It consists of two large aperture quadrupoles, an E × B Wien filter and a large magnetic dipole configured to op-erate in different ion optical modes. Depending upon the kinematics of the reaction, the operating mode of VAMOS can be varied to optimize different requirements. In the mass dispersive mode operation, the spectrometer selects and separates the reaction products according to the mo-mentum to charge(pq) ratio and their unique identification is achieved via event-by-event reconstruction of ion trajec-tories in magnetic fields. When operated as a velocity filter at zero degrees, the spectrometer physically separates the reaction products from beam backgrounds and transports them to the focal plane. The spectrometer has an angular acceptance ranging from -125 mrad to +100 mrad in
hor-∗ Corresponding author
Email address: [email protected] (S. Pullanhiotan).
izontal plane and a momentum acceptance of ±5%( at 25 msr solid angle). The main operational features of the spec-trometer are listed in table 1 and detailed specifications can be found in Ref [1].
The large acceptance of the spectrometer induce signifi-cant image aberrations in the focal plane of the spectrome-ter making it practically difficult to resolve the mass spec-trum by direct position measurement alone. It is essen-tial to employ trajectory reconstruction to determine the particle momentum and scattering angles from the mea-sured final coordinates. In VAMOS, event reconstruction is implemented using numerical methods that relate the final coordinates to the initial parameters by polynomial functions. The unique identification of reaction products is achieved by combining the reconstructed parameters (mag-netic rigidity Bρ and path length l) with measured quanti-ties such as time of flight (T OF ), energy (E) and energy loss (∆E) obtained from focal plane detectors. VAMOS cou-pled with a high efficiency γ detector array EXOGAM [3], has been used in a recent experiment to identify the γ ray transitions belonging to very neutron rich nuclei produced in deep inelastic reactions [4]. Using kinematic reconstruc-tion of the velocity and emission angle at the target, the
Table 1
Operational features of VAMOS for dispersive mode operation Horizontal Acceptance −125 mrad to +100 mrad
Vertical Acceptance ±160 mrad Momentum Acceptance ±5 %( at 25 msr)
M/q resolution ∼0.6 % Maximum rigidity Bρ 1.6 T-m
Deflection Angle 0◦- 60◦(variable)
Flight Path length 760 cm Linear Translation 40 to 120 cm
Angular rotation 0◦to 60◦
coincident γ-rays are Doppler corrected resulting in an im-proved resolution of the individual states in final nuclei.
Recently a new approach has been attempted in VAMOS to further improve upon its reconstruction results. The re-construction methods and its application to identification of reaction products from experimental data is presented in this paper.
2. Focal plane detector setup for VAMOS
The VAMOS spectrometer has a versatile detection sys-tem suitable for both light fast particles having energy around 2-20 MeV/u ( direct reactions) and heavy slow par-ticles having energy less than 2 MeV/u ( fusion reactions). The focal plane detector system consists of a pair of two di-mensional position sensitive tracking detectors, followed by multi segmented ionization chamber and an array of Silicon detectors measuring the particle coordinates(x,y), energy loss(∆E) and energy(E) respectively. Two kinds of position sensitive detectors are used in VAMOS. For light (Z < 15) ions with high energy (E > 2MeV/u), low-pressure drift chambers are used. The drift chambers have a x and y posi-tion resoluposi-tion of 0.3 and 1 mm (FWHM) respectively. For heavier and slower (E < 2 MeV/u) ions, position sensitive detectors based on secondary electron detection (SED) [5] are used.
Fig. 1 shows a typical focal plane detection setup used in dispersive mode operation. A pair of identical drift cham-bers [6] separated by 1 m measure the horizontal (x) and transverse (y) position of the particles passing through it. The measured x, y coordinates in two planes are used to compute the angle of the trajectory and its projection onto an ”image plane” located between the two detectors. A large area SED detector mounted between the drift cham-bers is used to obtain fast timing and trigger signals. The second drift chamber is followed by a 30 cm deep segmented anode ionization chamber which measures the differential energy loss(∆E) of the particles. An array of silicon de-tectors mounted behind the ion chamber is used to stop the particles, giving residual energy(E) and an additional time measurement. The charge Z identification is achieved by the standard method of combining the differential en-ergy loss and residual enen-ergy from the detectors. The time
Recoils
Drift Chambers
SeD Ionisation Chamber Silicon Wall
Fig. 1. Schematic of VAMOS focal plane detection setup used in Deep inelastic transfer reactions.
of flight (T OF ) is recorded between the beam pulse radio frequency(RF ) and the SED as well as between the SED and silicon. In experiments where low energy heavy recoils are to be detected, the two drift chambers are replaced by a pair of identical SED providing x, y position and time of flight signals.
3. Event Reconstruction in VAMOS
VAMOS is a ”software spectrometer” employing trajec-tory reconstruction technique [7,8] to determine the mo-mentum and scattering angles of detected particles. The reconstruction method used in VAMOS is based on two independent steps: trajectories simulation and reconstruc-tion algorithms.
3.1. Step 1: Trajectories Simulation and Tracking codes
The modeling of ion trajectories in an optical systems is generally realized by two approaches. The first approach relies on a transfer map calculation which relates the initial coordinates to the final coordinates of a trajectory. The cor-responding transfer map may be represented with a Taylor series of given order computed for some predefined optical object (TRANSPORT [9], GIOS [10]). Codes using a dif-ferential algebraic method even allow the computation of the transfer map up to an arbitrary order(COSY INFIN-ITY [11]). The second approach uses multi-particle track-ing codes based on the numerical integration of Newton-Lorenz equation for individual particles in a set of ana-lytical field models (ZGOUBI [12], RAYTRACE [13]). In the case of VAMOS spectrometer, the complexity of the quadrupoles (a pole shim in Q2 induces field corrections up to fifth order) prevent the usage of the standard and prede-fined field model proposed in most of the codes. The precise computation of trajectories can only be done with a very accurate field model. The trajectories in VAMOS are re-constructed using the field maps obtained during the mag-net design(generated with the 3D electromagmag-netic compu-tation code TOSCA [14]) in combination with the ZGOUBI multi-particle tracking code. ZGOUBI offer different
tions for the treatment of field maps including both 2D and 3D lattices of field values. The accurate description of the VAMOS spectrometer in a given mode is simulated by ray-tracing a set of 20000 trajectories covering the full acceptance and storing their initial(δ, xi, θi, yi, φi) and fi-nal coordinates (xf, θf, yf, φf, l). For a given trajectory the parameters x and y corresponds to the two transverse dis-tance from the reference trajectory, θ and φ refers to the inclination angle in horizontal and vertical planes. The pa-rameter δ = (p − p0)/p0defines the fractional momentum deviation from the reference momentum and l, the differ-ence in path length between the given and the referdiffer-ence path. The subscripts ’i’ and ’f ’ here refer to the parameters corresponding to initial and final space respectively. In all calculations, the nominal image plane considered is an arbi-trary plane normal to the reference trajectory and located midway between the two drift chambers. The four param-eters xf, θf, yf, φf are determined on this image plane by projecting the position and angle measurement from two drift chamber detectors.
3.2. Step 2: The reconstruction algorithm
In a spectrometer, generally the determination of mo-mentum(or mass) is directly obtained from the particle position, recorded with a detector in the dispersive focal plane. In a large acceptance spectrometer such as VAMOS, the non-linearity make the extraction more involved. The particle momentum is to be reconstructed from the mea-sured four final coordinates (two position xf, yf and two angles θf, φf) using mathematical transformations. The re-construction algorithm employed in VAMOS uses a numer-ical procedure that calculates a polynomial relationship be-tween the four final coordinates and the quantities to be reconstructed ( δ, l, θi, φi) [15]. For each detected parti-cle, the parameters that are to be be reconstructed are ex-pressed as the following set of polynomial functions:
δ = F1N(xf, θf, yf, φf) θi= F2N(xf, θf, yf, φf) φi= F3N(xf, θf, yf, φf) l = F4N(xf, θf, yf, φf)
(1)
where N is the order of polynomial(7th order in the present case). As an example, the expression for δ is writ-ten as: δ = i+j+k+l=7X i,j,k,l=0 Cijkl xi fθ j fy k fφ l f (2)
where the coefficients Cijkl are related to the transfer map of the spectrometer. These coefficients are determined off-line, from fitting polynomials to the set of trajectories computed by ZGOUBI. Due to the mid plane symmetry in the magnet, the coefficients in Eq. 2 are null for odd values
of k +l and only the remaining relevant coefficients are con-sidered for reconstructing the δ parameter. This method of reconstruction uses a universal set of coefficients to recon-struct all trajectories across the full acceptance window of the spectrometer. It is difficult to get a clear idea, if these polynomials have sufficient precision over the full region of phase space. The merit function χ2 gives only a feeling of the quality of the fit on an average.
In order to reduce the complexity of the problem it is possible to decompose the full acceptance of the spectrom-eter into N smaller bins and use a set of piece-wise lower order polynomials locally. We have tested a different algo-rithm for reconstructing trajectory parameters in VAMOS using a third order polynomial interpolation within a sub-set of trajectories selected close to the region of interest. The method of reconstruction is implemented through the following steps.
a) For each detected particle, the measured data (xm, θm, ym, φm) in the image plane is compared with the set of trajectories from ray-tracing calculation to select an optimum number ( ∼ 125) of nearest trajectories. The cri-teria for selecting the nearest trajectories is based on the minimum squared distance D to the points where D2
= α1(xm−xf)2 +α2(θm−θf)2 +α3(ym−yf)2 +α4(φm−φf)2 . The choice for the number of trajectories and weight fac-tors αi are optimized empirically by determining the best χ2
fit for the reconstructed parameters with least compu-tation time.
b) Only those selected nearest trajectories are used to obtain the coefficients of local third order polynomial func-tions for δ, θi, φi and l independently.
c) The required reconstructed parameters are then ob-tained using Eq. 1.
This method has the advantage of avoiding the global fitting procedure involving several hundreds of coefficients. Coefficients of these piece-wise polynomials can be stored, or can be recomputed for each trajectories on event by event basis.
For a complete identification of the reaction products, the following basic relations between Bρ, measured energy (Etot) and particle characteristics( mass number M , veloc-ity v and atomic charge state q) are used.
M q = Bρ 3.105 × β M = 2Etot 931.5 × β2 (3)
where Etotis total energy in MeV, Bρ in T-m, and β = v/c.
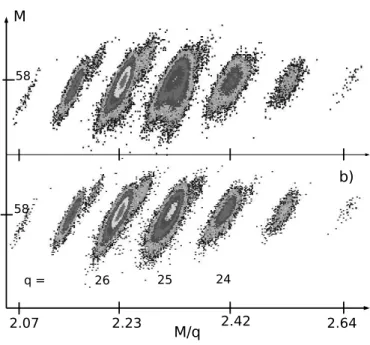
Fig. 2 shows a comparison of the reconstructed m/q spec-trum using the two approaches: a global fitting procedure using 7thorder polynomials (a) and the reconstruction pro-cedure using a local third order polynomials whose coeffi-cients have been adjusted for the nearest trajectories. The data shown here correspond to quasi-elastically scattered target like recoils in the reaction238
U +58
N i at 1.3 GeV energy [16]. Though the second method is computationally
Fig. 2. The M (mass) of the recoils plotted as a function of M q for
different charge states. a) using a 7thorder polynomial function with
set of coefficients obtained using data across the full phase space; b) using a local third order polynomial for a selected set of trajectories. (See text).
more intensive, it yields improved results as seen in Fig. 2. An improvement of the experimental M
q resolution( 8% im-provement in FWHM) could be achieved in the present data. The advantages of the second method are of oper-ational interest, since it is clear that the first method (a) could be improved by selecting the coefficients more care-fully or/and improving the quality of the fit with a bigger set of computed trajectories. However a systematic check-ing of the quality of large order polynomials over the whole acceptance of the spectrometer could be difficult. The sec-ond method, appears to be well adapted in the context of the flexible operation of the spectrometer and can improve the VAMOS resolution when required. Further improve-ments may be obtained by employing alternative methods for the reconstruction as proposed in the literature [17–19]. Apart from determining the particle momentum, the ini-tial angles of the particles are also determined by recon-struction methods. Fig. 3 shows the results of reconstruc-tion applied to determine the initial angles of well defined trajectories using a sieve slit (1 mm thick collimator) placed in front of the magnetic aperture of first quadrupole(Q1) of VAMOS. The slit contained a pattern of pin holes (11 x11) defining a set of well defined trajectories with known angles (37 mrad between holes) in θ, φ. Elastically scattered58N i passing through the slit were detected in the focal plane de-tectors and their final coordinates at the image plane were determined from the drift chamber measurements. For each scattered particle passing through individual sieve-holes,
-150 -100 -50 0 50 100 0 1000 2000 3000 4000 5000 6000 7000 Theta (mrad) Counts
Fig. 3. The reconstructed horizontal angle θ of holes in sieve slit. The slit contained a pattern of pin holes separated by an angle of 37 mrad.
its initial angles were reconstructed from the measured fi-nal positions and angles and compared with the calculated angle of the trajectory. The figure shows the reconstructed angle θ (horizontal plane) for the trajectories through the collimator. The results shows a close agreement between the reconstructed angles and the real angles of the sieve-holes suggesting that the reconstruction method can be ap-plied to determine the scattering angles of the particles to reconstruct the kinematics of the reaction.
4. Experimental Results
In this section we illustrate the application of trajectory reconstruction and identification method using the first ap-proach (using 7th order polynomials) to the identification of nuclei formed in deep inelastic transfer reactions. The experimental setup consisted of the VAMOS spectrometer coupled to the high efficiency γ-detector array EXOGAM. The experimental data shown are taken from Ref [4] us-ing a 238U beam at 1.3 GeV energy bombarding an iso-topically enriched 1 mg/cm2
thick48
Ca target. The result-ing target-like recoils from deep inelastic transfer processes were detected and identified in the VAMOS spectrometer. The spectrometer was rotated at 35◦(around the calculated grazing angle) with respect to the beam direction. VAMOS was operated in the mass dispersive mode with magnetic fields set for mass M = 52 with charge state q = 19+and energy E = 430 MeV optimizing the yield for 52Ca like products. At the image plane the reaction products were characterized by an event by event measurement of the fi-nal coordinates(xf, θf, yf, φf), energy loss ∆E, energy E and time of flight T OF
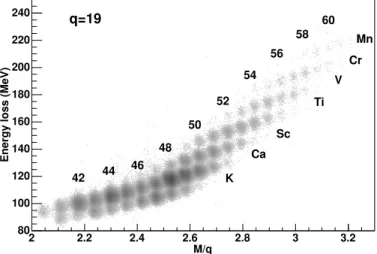
For each detected particle, the magnetic rigidity (Bρ), path length (l) and initial angles (θi, φi) were determined by reconstruction method and reaction products were iden-tified using the values of M, M/q, v and energy loss (∆E) The resulting identification spectra is shown in Fig. 4 which displays the two dimensional image of the energy loss (∆E) plotted as a function mass over charge ’M/q’. As seen in the figure, unambiguous identification of target like
M/q
2 2.2 2.4 2.6 2.8 3 3.2
Energy loss (MeV)
80 100 120 140 160 180 200 220 240 q=19 K Ca Sc Ti V Cr Mn 42 44 46 48 50 52 54 56 58 60
Fig. 4. Identification plot displaying ∆E plotted as a function of M/q, showing an unambiguous identification of the products. The spectrum shown here is generated by gating on the charge state q = 19. M/q 2.5 2.6 2.7 2.8 2.9 3 3.1 3.2 Counts 0 5 10 15 20 25 30 35 54 55 56 57 58 59 q=19 Z=23 53
Fig. 5. The reconstructed mass spectrum of the Vanadium isotopes.
residues with Z ≥ 19 could be achieved by gating on charge state q =19. The data shown here are selected by a particu-lar silicon detector covering only a small region of the focal plane. By software gates on a particular Z, the correspond-ing mass spectra are generated as shown in Fig. 5 which shows the mass spectrum belonging to Vanadium isotope (Z=23). All these measurements were done with a T OF resolution of ∼ 2 ns mainly limited by the time resolution of the beam pulsing. More details on the experimental re-sults are given in Ref [4].
5. Conclusions
The VAMOS spectrometer is now fully operational at GANIL and uses trajectory reconstruction method for com-plete identification of the reaction products. Two different algorithms have been developed and compared for trajec-tory reconstruction. The method using polynomial inter-polation using a subset of selected trajectories shows im-proved resolution compared to that using a single polyno-mial across the full phase space. Results from recent
ex-periments showed that the reconstruction and identifica-tion procedures used in VAMOS are capable to unambigu-ously identify products. High sensitivity and selectivity of the spectrometer coupled with the EXOGAM detector ar-ray proved successful in identifying and assigning gamma ray transitions in exotic nuclei.
6. Acknowledgment
The authors are thankful to the GANIL team for their excellent support in operating the facility. They would also like to thank various colleagues for help and insightful dis-cussions. This work has been founded by the European Commission under contract 506065 (EURONS/INTAG).
References
[1] H.Savajols and VAMOS collaboration, Nucl. Phys. A 654 (1999) 1027c.
[2] A.C.C. Villari, Nucl. Phys. A 693 (2001) 465. [3] J. Simpson, et al., Heavy Ion Phys. 11 (2000) 159.
[4] M. Rejmund, S. Bhattacharyya, A. Navin, W. Mittig, L. Gaudefroy, M. Gelin, G. Mukherjee, F. Rejmund, P. Roussel-Chomaz and Ch. Theisen, Phys. Rev. C 76 (2007) 021304(R). [5] A. Drouart, C. Mazur, Ph. Bourgeois, E. Bougamont, A.
Gillibert, V. Lapoux, L. Nalpas, E.C. Pollacco and M. Riallot, Nucl. Instr. and Meth., A 579 (2007) 1090.
[6] E.Bougamont, DSM-DAPNIA report No: 6D6810E2100/303, 2002.
[7] H. Blok, E.A.J.M. Offermann, C.W. De Jager and H.De Vries, Nucl. Instr. and Meth. A 262 (1987) 291.
[8] M. Berz, K. Joh, J.A. Nolen, B.M. Sherrill and A.F. Zeller, Phys. Rev. C 47 (1993) 537.
[9] D.C. Carey, K.L. Brown and F.Rothacker, SLAC-R-95-462, Fermilab Publication 1995.
[10] H. Wollnik, J.Brezina and M. Berz, Nucl. Instr. and Meth. A 258 (1987) 408.
[11] M. Berz, NSCL Technical Report MSUCL-1088, Michigan State University, 1998.
[12] F. Meot, Nucl. Instr. and Meth. A427 (1999) 353.
[13] S.B. Kowalski and H.A. Enge, Nucl. Instr. and Meth. A 258 (1987) 407.
[14] TOSCA Static Field Analysis OPERA-3D, Vector Fields, 24 Bankside Kidlington, Oxford, England.
[15] Manuscript in preparation.
[16] P. Sugathan, A. Navin, M. Rejmund, A. Chatterjee, S. Bhattacharyya, M. Caamano, L. Gaudefroy and A. Orbetelli, (to be published)
[17] V.A. Shchepunov, A. Cunsolo, F. Cappuzzello, A. Foti, A. Lazzaro, A.L. Melita, C.Nociforo and J.S. Winfield, Nucl. Instr. and Meth. B 204 (2003) 447.
[18] M. Berz, Advances in imaging and electron, modern maps methods Vol 108, academic press 1999.
![Fig. 1 shows a typical focal plane detection setup used in dispersive mode operation. A pair of identical drift cham-bers [6] separated by 1 m measure the horizontal (x) and transverse (y) position of the particles passing through it.](https://thumb-eu.123doks.com/thumbv2/123doknet/12874209.369522/3.918.57.338.91.294/detection-dispersive-operation-identical-separated-horizontal-transverse-particles.webp)