HAL Id: halshs-02904339
https://halshs.archives-ouvertes.fr/halshs-02904339
Preprint submitted on 22 Jul 2020
HAL is a multi-disciplinary open access
archive for the deposit and dissemination of sci-entific research documents, whether they are pub-lished or not. The documents may come from teaching and research institutions in France or abroad, or from public or private research centers.
L’archive ouverte pluridisciplinaire HAL, est destinée au dépôt et à la diffusion de documents scientifiques de niveau recherche, publiés ou non, émanant des établissements d’enseignement et de recherche français ou étrangers, des laboratoires publics ou privés.
Does later retirement change your healthcare
consumption ? Evidence from France
Elsa Perdrix
To cite this version:
Elsa Perdrix. Does later retirement change your healthcare consumption ? Evidence from France. 2020. �halshs-02904339�
WORKING PAPER N° 2020 – 46
Does later retirement change your healthcare
consumption ? Evidence from France
Elsa Perdrix
JEL Codes: I10, J14, J26
Does later retirement change your healthcare
consumption ?
Evidence from France
∗
Elsa Perdrix
July 20, 2020
Abstract
This paper examines the causal impact of later retirement on doctor visits among the French elderly. This question is of interest since spillover effects may arise if later retirement increases healthcare expenditure. I exploit the 1993 French pension reform in a two-stage least square to deal with the endogeneity of retirement. This reform leads to a progressive increase in claiming age, cohort by cohort from 1934 to 1943. I use a two-part model to disentangle between extensive and intensive mar-gin. I use the administrative data HYGIE to observe both healthcare consumption between 2005 and 2015 and past careers. I find that an increase in retirement by four months decreases significantly the probability to have at least one doctor visit per year by 0.815 percentage point and decreases the number of doctor visits by 1.14% between ages 67 and 75. This effect is driven by the consumption of general-ist doctor visits, and tends to be stronger for the first ages of consumption observed. JEL Codes: I10, J14, J26
Keywords: pension reform, health, healthcare consumption.
∗I gratefully thank Thomas Barney, Antoine Bozio, Matthieu Cassou, Andrew Clark, Léontine
Goldzahl, Anna Hammerschmid, Florence Jusot, Myriam Lescher, Muriel Roger, Nicolas Sirven and all seminar participants from the Longlives project; the IRDES and the CASD for the data; financial support from the ANR-15-MYBL-0001-01 under the JP-demographics call for the project LONGLIVES. This work is supported by a public grant overseen by the French National research Agency (ANR) as part of the “Investissements d’Avenir” program (reference: ANR-10-EQPX-17 - Centre d’Accès Sécurisé aux Données - CASD)
Introduction
The accelerating number of reforms that increase the claiming age in Europe has led to a growing interest regarding the impact of retirement on health. This interest is threefold. First, it is important to ensure that these reforms do not have adverse health effects. Second, there could be several opposing mechanisms at play, which make the overall effect of such reforms uncertain. Lastly, over the last few years, studying the impact of retirement on healthcare use has been seen as a relevant complement to studies focused on health issues. This additional question has two motivations. First, observations on the impact of later retirement on health, combined with results on healthcare use, provide important information from a public policy perspective. For example, findings showing worse health and less healthcare use could be interpreted as an increase in the number of people forgoing medical care. Second, we must account for spillover effects to avoid an overestimation of the financial benefits associated with pension reforms.
The potential mechanisms explaining the effect of the switch from employment to re-tirement on health may differ from those explaining the effect of delayed rere-tirement on
health1 and those mechanisms can vary depending on which dimension of health one
con-siders.2 The impact of delayed retirement on healthcare consumption may affect retirees
through changes in health and health investment, due to the time spent in employment and in retirement. It could also be the result of a change in the expected timing of retirement. Finally, it could be due to a change in inter-temporal income.
This paper explores the causal impact of later retirement on healthcare consumption in France. I focus on doctor visits out of the hospital setting, hospital stays in private hospitals, and expenditure on prescription drugs. I use waves 2005 to 2015 of the admin-istrative data HYGIE, which include information on career and healthcare consumption from the private pension scheme CNAV and the National Health Insurance. Since individ-uals can choose to retire for health reasons, there is a reverse causality issue to consider. I use the 1993 French pension reform as an instrumental variable to address this issue. This reform was the first one to induce later retirement in France, and it did not affect
1For example, the opportunity-cost of time play a role explaining differences at retirement but not
explaining differences among retirees according to their retirement timing.
2For example, the increase in the exposure to a repeated physical task over the career due to a pension
individuals within and between cohorts with the same intensity. However, on average, it led to an increase in claiming age (Aubert, 2009; Benallah and Mette, 2009; Bozio, 2011b) and in elderly’ labour force participation (Bozio, 2011b).
This paper aims at contributing to the literature in several ways. First, it is the first one to focus on the French case. Second, I draw several distinction: between the extensive margin and the intensive margin; between volume and price effects, between several categories of healthcare use. Those distinctions allow for analyses of the potential underlying mechanisms. I find that an exogenous increase in claiming age leads to a small but statistically significant decrease in the probability to have at least one doctor visit a year. Moreover, it decreases the average number of doctor visits per year among consumers. The effect is driven by general practitioner visits. When focusing on sub-samples by age range, I show that the impact at the extensive margin is significant from ages 68 to 76 while, from ages 66 to 70, it is significant at the intensive margin.
These results are consistent with Bíró and Elek (2018). Using a similar econometric method, they find that an increase in claiming age led to a significant decrease in doctor visits among women in Hungary at the extensive margin, but not at the intensive margin. Hagen (2018) also observe a decrease in drug prescriptions but not in inpatient care among female civil servants in Sweden. While Bíró and Elek (2018) do not provide any potential mechanism explaining these results, Hagen (2018) concludes that working is health preserving. Using a different empirical strategy, Shai (2018) focuses on a reform of the Israeli pension system that increased the statutory retirement age from 65 to 67. He finds a slightly significant increase in doctor visits among men between ages of 65 and 69 who retired later due to a reform compared to a control group of men aged 50 to 64 (not retired) and 70 to 74 (retired from age 65). He suggests that later retirement deteriorates health and increases healthcare expenditure. He assumes that this health decline comes from a delayed entrance in retirement, a time where individuals are more likely to engage in healthier behaviours.
This paper is organised as follows: Section 1 presents the literature and theoretical mechanisms. Section 2 presents the French pension reform used as an instrumental vari-able. Section 3 presents the administrative data and the empirical strategy. Finally, Section 4 presents the main results and the potential underlying mechanisms.
1
Literature Review and Underlying Mechanisms
There is a large literature on the impact of the switch from employment to retirement, and on the impact of delayed retirement on various dimensions of health. However, studies that focus on healthcare consumption are scarce and most papers are only interested in the consequences of the switch from employment to retirement on healthcare consumption (11 over 13 papers, see Table 1). The expected overall impact is unclear. The Grossman model (Grossman, 1972) predicts contradictory effects of retirement on healthcare use.
On the one hand, marginal benefits of health investment decrease at retirement.3 On
the other hand, marginal costs also decrease because of a lower opportunity cost of time. Moreover, the budget constraint may vary throughout individuals at retirement through earnings and consumption changes. Lastly, the health stock depreciation may change at
retirement.4
Only two papers documented the impact of a variation in retirement age on healthcare consumption among retirees, as summed up in Table 1. The impact of delayed retirement among retirees on healthcare consumption is not expected to be the same as the impact of the switch from employment to retirement. Marginal benefits of health investment, budget constraints and depreciation of the health stock vary in an inter-temporal frame-work. Moreover, changes in the opportunity cost of time cannot explain the differences in healthcare consumption due to a change in retirement timing among pensioners anymore. Almost all the studies on the impact of the switch from employment to retirement find a decrease in healthcare consumption at retirement. Thus, Coe and Zamarro (2015); Eibich (2015); Bíró and Elek (2018); Shai (2018); Nielsen (2019); Frimmel and Pruckner (2020) and Kuusi et al. (2020) find a decrease in doctor visits in Europe and the USA, in Germany, Hungary, Denmark, Austria and Finland, respectively. Nielsen (2019) finds a statistically significant decrease at the early retirement age threshold but not at the statutory retirement age while Eibich (2015) finds a decease in healthcare consumption at both thresholds. Bíró and Elek (2018); Gorry et al. (2018); Nielsen (2019); Frimmel and Pruckner (2020); Kuusi et al. (2020) also find a decrease in inpatient care and Bíró
3According to Grossman, health benefits are mainly through work productivity.
4Changes in health habits at retirement like physical activities, alcohol and tobacco consumption may
and Elek (2018); Gorry et al. (2018); Kuusi et al. (2020) find a decrease in prescription drugs consumption.
The authors provide several explanations for this decrease. The main mechanism is through an health improvement (Coe and Zamarro, 2015; Eibich, 2015; Shai, 2018; Frimmel and Pruckner, 2020). Thus, Eibich (2015) shows that individuals report a better health at retirement by engaging in healthier habits (smoking less, drinking less alcohol, having a physical activity more often, they also report better sleep and higher sleep duration). Consequently, he attributes the healthcare consumption decrease to an overall
better health, due to healthier behaviours and greater well-being. Besides, Coe and
Zamarro (2015) point out that most of the previous studies find a better self-reported health at retirement. Frimmel and Pruckner (2020) argue that the decrease in healthcare consumption is partly driven by the decrease in psychiatric and orthopaedic hospital care and in psychotropic drugs medication for musculoskeletal disorders. These care are typically associated with healthcare and not with health prevention.
However, other authors consider this mechanism as unlikely. Bíró and Elek (2018) believe that health changes are slow and that the sudden healthcare consumption change at retirement cannot be attributed to a sudden change in health. They offer three other mechanisms. First, individuals in employment have doctor visits for their sick-leave cer-tificate while pensioners do not need it (see also Nielsen (2019)). Second, individuals may be willing to invest more in their health while working. In this line, Frimmel and Pruck-ner (2020) show a decrease in screening participation and preventive care at retirement. Third, the income drop at retirement may decrease healthcare consumption. Nielsen (2019) also considers the opportunity cost of time: it would be higher during retirement because individuals would prefer using time off work to visit a doctor rather than using personal time for the visit.
Only three studies do not find a decrease in healthcare consumption at retirement. Grøtting and Lillebø (2018) find a negative non significant result on hospital stays in Norway but a significant decrease among the lowest education levels. Lucifora and Vigani (2018) uses cross-country differences in retirement age in Europe. Assuming normal dis-tribution of the number of doctor visits, they find an increase in doctor visits in Europe at retirement. Their main explanation for this result is the opportunity-cost of time. To
support this explanation, they show that the founded result is higher for those with long working hours. Zhang et al. (2018) also find an increase in healthcare consumption in Urban China. They consider that the main underlying mechanism is the opportunity cost of time, particularly high in Urban China. This could explain the difference with results found in Europe and the United States.
An other strand of the literature focuses on the impact of a change in retirement age on healthcare consumption. As far as I know, only one study targets the impact of later retirement on healthcare consumption (Hagen, 2018) and another one focus on the impact of earlier retirement (Hallberg et al., 2015). Both these studies use reforms that spurred individuals towards an earlier or later retirement. They find either a non significant or a negative impact on healthcare consumption. Thus, Hagen (2018) uses the Swedish pension reform of local government workers as an instrumental variable. This reform increases the claiming age from 63 to 65 years old. He finds no significant change in inpatient care but a significant decrease in drugs consumption for women between ages of 65 and 69. Hagen (2018) assumes that work is health preserving for the women civil servants, and that it explains the results. Hallberg et al. (2015) use the Swedish early retirement offer at age 55 implemented for military officers (rather than 60 before the reform) as an instrumental variable. They focus on the impact of this exogenous decrease in claiming age on healthcare consumption. They find a significant decrease in inpatient care consumption between ages 56 and 70, and interpret it as a consequence of health improvement linked to earlier retirement.
Thus, the literature and underlying mechanisms concerning the impact of the switch from employment to retirement on health is well documented. However, there is little knowledge regarding the impact of later retirement on healthcare consumption among retirees, and the associated underlying mechanisms (in particular, is health a cause or consequence of healthcare consumption changes due to later retirement). The purpose of this paper is to fill this gap.
T able 1: Literature Review on the Impact of Retiremen t on Healthcare Consumption A uthors (y ear) Coun try Sample Age Metho d Instrumen t Results on Do ctor Hospi Drugs Impact of the switc h from emplo ymen t to re tiremen t Co e and Zamarro (2015) Europ e + USA Men, w ork ers at 50y .o. 50+ RDD SRA & NS -Eibic h (2015) DEU Civil serv an ts & self-emplo y ed 55-70 RDD ERA: 60. SRA: 65 & NS -Bíró and Elek (2018) HUN W omen 54-60 2SLS (TPM) ERA: 57 & & & Bíró and Elek (2018) HUN Men 57-63 2SLS (TPM) ERA: 60 & & & Gorry et al. (2018) USA W ork ers at age 50 50-9 3 2SLS SS threshold NS & & Grøtting and Lilleb ø (2018) NOR -56-79 FRDD SRA: 67 -NS -Lucifora and Vigani (2018) EU -50-69 RDD ERA and SRA % -Shai (2018) ISR Men 40-74 DiD SRA: 65 ⇒ 67 & -Zhang et al. (2018) CHN W or k ers 40-75 RDD SRA: 60 (| ) 50 (~ ) % % -Nielsen (2019) DNK Cohort 1 939, without ERP or DRP 60-70 2SLS SRA: 67 ⇒ 65 NS NS -Nielsen (2019) DNK -55-65 RDD ERA: 60 & & -F rimmel and Pruc kner (2020) A UT Priv ate sector 41-74 FRDD ERA: 60 ⇒ 65 (| ) 55 ⇒ 60 (~ ) & & NS Kuusi et al. (2020) FIN W ork ers b efore ERA 62-67 2SLS SRA: 63 -& & Impact of later retiremen t Hagen (2018) SWE W omen, civil serv an ts 65-69 DiD SRA: 63 ⇒ 65 -NS & This pap er FRA Men, priv ate sector 66-76 2SLS (TPM) SRA % & NS & Impact of earlier retiremen t Hallb erg et al. (2015) SWE Men, military 56-79 2SLS SRA: 60 ⇒ 55 -& -Notes : Results on (1) do ctor vi sits; (2) hospital sta ys; (3) drugs. No particular sampl e restriction is notified with“-” . A bbr e viations : Coun tries abbreviations are 3-letters co des from the United Nation. Column metho d: (F)RDD, (fuzzy) regression discon tin uit y de sign; DiD, difference in difference; 2SLS, tw o-stage least square; TPM, tw o part mo del. Column instrumen t: ERA, early retiremen t age; SRA, statutory retiremen t age. Other columns: NS: non significan t at the 5% lev el; “-” No particular sample restriction, or, for the results’columns: Not applicable; ERP , early retiremen t p ension; DRP , disabilit y retiremen t p ension.
2
The 1993 Pension Reform in the Private Sector
Before the 1993 pension reform, workers from the private sector could claim a pension
from age 60. However if they wanted to benefit from a full pension,5 they had to have
contributed up to at least 150 quarters or to leave at age 65 or after. Individuals may contribute quarters when in employment but also when in sick-leave, maternity-leave, or unemployment. The maximum number of contributed quarters per year is four. Being
out of the labour force6 prevents an individual from validation of quarters. Lastly, there
is no increment (neither before nor after the reform), so no financial incentive arises to claim for pension after reaching the full replacement rate.
In 1993, the first pension reform leading to an increase in career length was imple-mented. This reform only applied to workers from the private sector. Individuals could not have anticipated it because there was no announcement before the reform. Moreover,
the reform was voted and adopted very quickly.7
As a consequence, required contribution length for a full pension has gradually in-creased from 150 to 160 quarters, cohort by cohort, starting with the 1934 cohort. As shown in Table 2, cohort 1934 had to contribute 151 quarters for a full pension, cohort 1935 had to contribute 152 quarters and so on and so forth.
Table 2: Increase in Required Contribution Length in the Private Sector
Birth year Nb of contr. quarters
in quarter in year
1933 and before 150 37 years and 6 months
1934 151 37 years and 9 months
1935 152 38 years
1936 153 38 years and 3 months
... ...
1942 159 39 years and 9 months
1943 and after 160 40 years
Notes: Individuals born in 1933 or before, have to have con-tributed 150 quarters to benefit from a full replacement rate; those born in 1934 have to contribute 151 quarters; and so on.
5The full replacement rate is 0.5. It decreases by a δ factor, equal to 1.25 % per quarter of missing
contributions. See Appendix A and also Bozio et al. (2019); Blake and Garrouste (2019) for more details on this reform.
6i.e. being unemployed and not looking for a job or unemployed for a long period of time.
7The reform was voted in July 1993. The implementing decree was published one month later with
This reform changed the incentive to claim pension at a certain age. This is different from a change in the mandatory claiming age. Thus, individuals affected by the reform can leave at the same age than before the 1993 reform, if they accept a decrease in their pension. In my analysis, I measure the impact on the compliers (those who delayed retirement if affected and do not if not affected) and not on the always-takers and the never-takers.
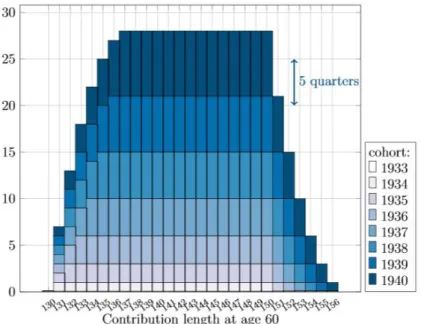
Finally, note that workers are not all affected in the same way. Individuals with very short career would only be granted a full pension from age 65 because they had not contributed enough beforehand. Similarly, individuals with very long career have contributed at age 60 largely more than the required contribution length, so that they can leave at age 60 regardless of the required contribution length, and are not affected by the reform. Figure 1 illustrates this fact for the first cohorts affected by the reform. In this paper, I exploit both variation within cohort (between contribution length at age 60) and between cohort (for a same contribution length at age 60).
Figure 1: Impact of the 1993 Reform on Required Contribution Length
Notes: Scheme from Bozio et al. (2019). It shows the number of added
quarters required to reach the full-rate by cohort and contribution length at age 60 due to the reform. Cohort 1934 who had contributed at age 60 between 130 and 150 quarters need one quarter more in order to qualify for the full-rate. Cohort 1935 who had contributed at age 60 between 131 and 150 quarters need two quarters more to reach the full replacement rate. Those from the same cohort who had contributed 130 and 151 quarters at age 60 have to delay retirement by one quarter.
3
Data and Empirical Strategy
I use the 1993 pension reform as an instrumental variable to estimate the causal impact of later retirement on healthcare consumption. It requires data including both information on contribution length and claiming age; and information on healthcare consumption.
3.1
Data
I use administrative data HYGIE, provided by Irdes,8 which include information from
the private pension scheme (CNAV) and from the National Health Insurance. It includes 1/20em of all individuals born between 1935 and 1989 and who have contributed at least once in the private sector. The data include information on careers (number of contributed quarter, claiming age, pension). All health information are aggregated at the yearly level for every individual between 2005 and 2015. Thus, the healthcare consumption of individuals born in 1935 is observed between the ages of 70 and 80, those born in 1936, between the ages of 69 and 79 etc. (See Table B1).
The number of doctor visits and total expenditure for visits, the number of days
in private hospitals9 and the total associated cost, the total cost of prescription drugs
constitute the healthcare-related parameters. Doctor visits are split between general
practitioners, and specialist practitioners. This includes doctor visits provided out of the hospital. Ambulatory surgeries are excluded. Therefore, doctor visits only include consultation and no acts. More details on the French healthcare system are provided in Appendix A.2.
3.2
Sample Selection
Sample Selection. I selected all men,10 born between 1935 (the oldest I observe) and
1943 (the last cohort affected by the 1993 reform but not by the following pension reforms);
8Institut de recherche et de documentation en économie de la santé.
9Private hospitals provide both schedule care and emergency care. In 2015, 25% of emergencies care
(excluding paediatric emergencies) where in the private sector (Toulemonde, 2017).
10The sample selection on men is due to data constraint. See Appendix B for more information. Note
that the 1993 reform affects mostly men, and thus, it remains of interest to explore the impact of the reform among men only.
who had contributed at least once during their career in the private sector;11 who had
contributed between 131 and 160 quarters at age 60;12 who were alive and retired before
age 67. I observe consumption between the ages of 66 and 76 for individuals born between 1935 and 1943 (See Table B1). As a complementary analysis, I provide results by age range. For this analysis, I select individuals born between 1939 to 1943 and observe their consumption between ages 66 and 68; I select individuals born between 1938 and 1943 and observe their consumption between the ages of 67 and 69 and so on and so forth until the selection of individuals born between 1935 to 1939, for whom I observe their consumption between the ages of 74 and 76 (See Table B2). Note that since the reform has no impact on mortality (Bozio et al., 2019), the selection on individuals alive at different ages does not bias the empirical strategy.
Since the reform only affects individuals who had contributed between 131 and 160 quarters at age 60, the sample is restricted to this population. Small changes in this threshold are not expected to drive the results but large changes may. By including in the panel individuals that were not affected but with very different characteristics than the affected, bias may arise. For example, the inclusion of individuals with very long career (more than 170 quarters at age 60) leads to the inclusion of individuals that were not affected by the reform since they started working around 16 years old (control group) while the treatment group started working between the ages of 23 and 27. Moreover, note that it is not possible to include individuals with either less than 131 quarters or more than 160 quarters since these individuals are not affected by the reform but left at very different claiming ages (the first group left at age 65 and the second at age 60). As a robustness check, I show that the change of this contribution length threshold does not statistically significantly change the results when applying to a small variation of the threshold but changes the results when adding a large range of individuals not affected by the reform but with different characteristics than the treatment group (see Figure C1 of Appendix C.1).
Variables of Interest. I use several measures of healthcare consumption. The first one
is the probability of having at least one doctor visit. Second, for consumers, I take into
11The 1993 reform affects only the private sector.
account the yearly number of doctor visits as well as the expenditure on doctor visits.13 This last expenditure includes both the part that is reimbursed by the insurance and the
out-of-pocket payment.14 All these healthcare use variables are used through logarithm
transformation among the consumers. I distinguish between general practitioners and specialist practitioners. I also factored in the number of dental visits and the total expen-diture on dental visits; the number of days spent in private hospitals and the associated
expenditure;15 the expenditure on prescription drugs, as well as the total expenditure on
all the previously quoted medical care.
Descriptive Statistics. Table 3 provides descriptive statistics regarding the health and
careers of individuals included in this study. In the main sample, 75.7 % of observations have at least one doctor visit a year. Thus, in the main sample, 24.3 % of observations do not consume any doctor visit. It is higher than the 10 % of non-consumers found among the 75 and older in France by Calvet (2012) and Sourty-Le-Guellec (1999) among the French registered at the National Health Insurance. Moreover, 72 % had at least one general practitioner visit during the year, which is, once again, lower that the national statistics (Calvet and Montaut (2013) show that after age 60 only 7 % do not consume any doctor visit). One explanation may be that I focus on men who worked in the private sector, and had contributed between 131 and 160 quarters at age 60, who usually are in
better health than the average French inhabitant.16
In the whole sample, individuals who have or had a chronic condition after age 65 account for 44% of the observations. Among these individuals, 83% had a doctor visit. Moreover, 71% of observations from the main sample are individuals who benefited from a co-payment exemption, meaning that they did not have any out-of-pocket payment for doctor visits. The 29% of observations without this exemption have an out-of-pocket pay-ment for doctor visit around 30% of the total expenditure if they don’t have a
supplemen-13In euros 2016. I use the inflation index from the French national institute of statistics INSEE
https://www.insee.fr/fr/information/2417794.
14Appendix A.2 provides details about the French health insurance system and reimbursement rate.
15The impact of delayed retirement on hospital care in the private sector can be interpreted as the
impact on the whole hospital care only under two additive assumptions. First, delayed retirement does not change the preference between public and private hospitals. Second, the preference between public and private are not exclusives.
16This selection leads to the exclusion of self-employed workers, inactive, handicapped, and a large part
tary health insurance (see Appendix A.2 for more details). Those with this co-payment exemption are most of the time consumers (94%) which is expected since having large expenditure for healthcare in France is one of the reason why an individual can benefit from a co-payment exemption.
I find no significant differences in career characteristics between the main sample and sub-samples of doctor consumers, of individuals with chronic condition and with co-payment exemption. Thus, the selection of consumers does not appear to bias the sample according to career characteristics. The average claiming age is 61.87 years old for the whole sample as well as the subsample of those with at least one doctor visit a year; the average number of added quarter required due to the reform (∆RCL) is 3.518 quarters (resp. 3.417 for consumers); the contribution length at age 60 is 149.5 (resp. 149.8).
Figure 2 shows the point estimate of the impact of the number of added quarter required on number of doctor visits by year of consumption (Figure 2a) and by age (Figure 2b), controlling for age, contribution length at age 60, suffering from a chronic disease, and the living area (reduced-form estimation). It shows that the average level of consumption is higher among the not-affected for almost all year of consumption and at all ages. Moreover, it seems that in average, the more an individual is affected, the lower his healthcare consumption is.
Table 3: Descriptive Statistics
Consumers of Individuals with All GP Specialist Ambulatory
care Co-payment exemption Chronic condition Probabilit y of
General practitioner visit 0.725 1 0.936 0.957 0.906 0.803 (0.447) (0) (0.244) (0.203) (0.292) (0.398) Specialist practitioner visit 0.510 0.660 1 0.674 0.637 0.594
(0.500) (0.474) (0) (0.469) (0.481) (0.491) Doctor visit 0.757 1 1 1 0.944 0.831 (0.429) (0) (0) (0) (0.230) (0.374) Hospital stay 0.120 0.156 0.230 0.158 0.151 0.151 (0.325) (0.363) (0.421) (0.364) (0.358) (0.358) Chronic condition 0.440 0.487 0.512 0.483 0.488 1 (0.496) (0.500) (0.500) (0.500) (0.500) (0) Co-payment exemption 0.710 0.888 0.886 0.885 1 0.788 (0.454) (0.315) (0.318) (0.318) (0) (0.409) Num b er of
General practitioner visits 4.590 6.335 6.491 6.064 5.836 5.779 (5.923) (6.112) (6.413) (6.116) (6.229) (6.774) Specialist practitioner visits 2.458 3.206 4.817 3.248 3.097 3.122
(4.624) (5.077) (5.525) (5.067) (4.934) (5.049) Doctor visits 7.048 9.541 11.31 9.311 8.933 8.901
(8.531) (8.729) (9.237) (8.664) (8.760) (9.497) Hospital stays (in days) 0.433 0.556 0.754 0.554 0.566 0.651
(4.651) (5.040) (5.627) (5.050) (5.396) (6.166)
Exp
enditure
for
General practitioner visits 127.0 174.0 182.9 167.3 163.0 162.3 (142.0) (140.3) (152.6) (141.2) (144.5) (154.8) Specialist practitioner visits 236.0 308.6 434.7 310.3 297.6 316.6
(545.7) (606.3) (701.7) (608.2) (608.3) (682.2) Doctor visits 314.3 420.3 552.7 415.2 399.4 411.1 (474.1) (505.9) (560.0) (505.0) (507.3) (559.0) Prescription drugs 713.2 934.6 1047.6 926.2 922.6 966.6 (1258.6) (1337.7) (1535.2) (1362.4) (1399.2) (1545.6) Hospital stays 291.0 374.5 540.5 378.8 378.6 427.9 (1749.8) (1904.6) (2297.3) (1957.3) (2033.1) (2241.7) Total expenditure 2277.8 2973.0 3630.8 2960.3 2922.9 3041.6 (4200.6) (4501.1) (5211.4) (4569.0) (4708.0) (5121.6) Career Claiming age 61.87 61.73 61.79 61.78 61.83 61.72 (2.113) (2.019) (2.048) (2.043) (2.073) (2.059) Added quarters 3.518 3.411 3.417 3.434 3.547 3.232 (3.073) (3.050) (3.043) (3.051) (3.087) (2.966) Contrib. length at age 60 149.5 149.8 149.8 149.7 149.6 149.6
(8.076) (8.028) (7.997) (8.050) (8.106) (8.129)
N 66,698 48,324 34,040 50,488 47,365 29,323
Notes: “Added quarters” is the number of added quarters required due to the reform. “Contrib. length at age 60” is the contribution length at age 60. Hospital stays include only private hospital stays. Drugs include only prescription drugs.
Sample: Men who had contributed at least once in the private sector and had contributed at age 60 between 131 and 160 quarters, retired before age 67, ages comprised between 66 and 76.
Source: HYGIE 2005 – 2015.
3.3
Empirical Strategy
Using Log-transformation. As reminded by Lumley et al. (2002) the normality
as-sumption is a strong one in the empirical strategy I planned to use. The skewness of healthcare distribution prevents from this assumption (Figure B2a and B2b). This skew-ness is due to both left-censor data and long right-tail distribution. Using a logarithm transformation among the consumers solves the long-right-tail issue (Figure B2c and B2d).
Figure 2: Healthcare Consumption among Individuals Affected and not Affected by the Reform
(a) Average Consumption by Year and Treatment Intensity
-1.00
0.00
1.00
2.00
Average number of doctor visits
2005 2006 2007 2008 2009 2010 2011 2012 2013 2014 2015 year of consumption
1 added quarter Not affected 5 added quarters
10 added quarters
(b) Average Consumption by Age and Treatment Intensity
-1.00
0.00
1.00
2.00
Average number of doctor visits
67 69 71 73 75
Age 1 added quarter Not affected 5 added quarters
10 added quarters
Notes: This graph presents the reduced-form. It is the point estimates of the number of added quarter required on the number of doctor visits, controlling for age, year, contribution length at age 60, department, and having a chronic condition, estimated using OLS regression. It shows the number of doctor visits by year (Figure a) and by age (Figure b) for individuals not affected by the reform (red square) and individuals affected (blue circles). The most dark blue the circle is, the most important the treatment intensity is.
Sample: Men who had contributed at least once in the private sector and had contributed at age 60 between 131 and 160 quarters, retired before age 67, ages comprised between 66 and 76.
Source: HYGIE 2005-2015.
Using Two-part Model. A large proportion of the observed population has zero
con-sumption for a given point of time. Two main models enable us to tackle this issue: sample selection models (eg. Heckman models) and two-part models. As reminded by Madden (2008), there is a huge literature on the choice between these two models (Leung and Yu, 1996; Jones, 2000). I chose a two-part model for two main reasons: first, delayed retirement may affect differently the probability to consume and the level of consumption. From a public policy point of view, this distinction is of great interest, because the poten-tial mechanisms explaining a zero consumption may differ from those explaining a change
in level.17 Moreover, only measuring the overall effect could lead to a wrong
interpreta-tion in terms of public policy.18 The second reason to study both extensive and intensive
17One may argue that foregoing healthcare can only be measured through the probability to consume
and not through the level of consumption.
18Let us imagine that the pension reform leads to both an increase of the share of individuals foregoing
healthcare for financial reason but also deteriorates the health of those who can still afford care. The latter increase their healthcare consumption as a consequence of a worse health. We could at this point conclude that the reform is detrimental to both health and access to the healthcare system. However, without any distinction between extensive and intensive margin, such a conclusion is impossible. Consider this numerical example: a population with 80% of consumers before the reform and each consumer consume 10 euros. It means an average consumption of 8 euros. Due to a reform, the share of consumers decreases
margins is that two-part models allow for logarithm transformation without issue regard-ing logarithm transformation for individuals with zero consumption. Equation 1 is an
ordinary least square regression.19 It gives the impact of claiming age on the probability
to consume care (impact at the extensive margin). Using logarithm transformation in an ordinary least square model, Equation 2 gives the impact of claiming age on the level of consumption (intensive margin) among the consumers.
1HCi,t>0 = β0+ β1Ai,t+ β1Xi,t + v1,t+ εi,t (1)
log(HCi,t|HCi,t>0) = γ0+ γ1Ai,t+ γ2Xi,t+ v2,t+ νi,t (2)
HCi,t is the healthcare consumption of individual i at date t and 1HCi,t>0 its associated
dummy. Ai,t is the claiming age of individual i. It is constant across t. Xi,t is a control
vector for contribution length at age 60, number of contributed quarters for sick-leave,
logarithm of pension, department,20 year of birth. These variables are also time-invariant.
Finally, vt is a wave fixed effect. εi,t and νi,t are error terms, following a normal
distribu-tion, and jointly independent. Thus, these two equations are assumed to be independent.21
Note that there is no individual fixed effect since all independent variables are time in-variant. The main specification includes a weight inversely proportional to the number of observations, to avoid a bias associated with the number of time each individuals is observed. All individuals are alive at age 72 and the only reason I can not observe every individual the same number of time is the re-sampling process. Finally, as an additional result, the regressions are estimated in balanced panels of three ages of observation. All individuals are therefore observed the same number of time, at the same ages. Thus, the absence of individual fixed effect is not an issue.
This model takes into account the skewness of the healthcare consumption distribution, but not the reverse causality issue. I use an instrumental variable (IV) to measure the to 60%, and the consumption per individual increases to 12 euros. The average consumption is 7,20 euros. We wrongly conclude that the reform decreases the healthcare consumption. In reality, it increases the consumption among the consumers but decreases the probability to consume.
19I check that the marginal effect from the probit model provides similar results. See Appendix C.2.
20This control serves as a proxy for local supply of healthcare services and also to control for specificities
of Alsace-Moselle departments, which were used to be a part of Germany from 1871 to 1919, and kept for historical reason a higher National Health Insurance coverage.
causal impact of claiming age on healthcare consumption.
Using Instrumental Variable. The reverse causality issue emerges as soon as the
explanatory variable may be both a cause and a consequence of the variable to explain. In this study, individuals may choose to retire due to their health (Llena-Nozal Ana et al., 2004). As a consequence, individuals who leave later may be in better health than those who leave earlier. To observe the causal impact of later retirement on health, I use the 1993 pension reform as an instrumental variable. This reform is exogenous to the individuals’ health, and leads individuals to delay their retirement. I assume that the reform is independent from the health status (exclusion restriction). This assumption is not testable but highly credible because the reform applies to every worker in the private sector, without health consideration. Secondly, to be relevant, the reform must impact the claiming age (non-zero assumption). I show in the following section that this assumption is verified. Thirdly, I assume total independence with respect to the instrument. This
assumption means, in particular, that there is no anticipation effect nor bypass effect.22 It
is highly credible for the first cohorts affected. Those individuals cannot have anticipated this reform since it is the first one to increase the claiming age in France. On the opposite, the last affected cohort was aware of the reform next to a decade before their retirement. They could then choose to be never-taker and not react to the reform, which is not an issue since I am interested in the compliers. Moreover, they have very low flexibility to change their contribution length. Finally, I assume that individuals react in the same direction to the incentive (ie. there is no defiers, it is the monotonicity assumption).
The combination of a two part model and instrumental variable strategy can be written as following:
First part: impact at the extensive margin.
Ai,t = α0+ α1∆RCLi,t+ α2Xi,t+ v1,t+ εi,t (3)
1HCi,t>0 = β0+ β1Aˆi, t + β1Xi,t+ v2,t + νi,t (4)
Second part: impact at the intensive margin for the consumers.
Ai,t|HCi,t>0 = δ0 + δ1∆RCLi,t+ δ2Xi,t+ v3,t+ ε0i,t (5)
log(HCi,t)|HCi,t>0= γ0+ γ1Aˆi,t+ γ2Xi,t+ v4,t+ νi,t0 (6)
HCi is the healthcare consumption of individual i, 1HCi,t>0 its associated dummy
variable, and log(HCi,t)|HCi,t>0 is the logarithm of healthcare consumption among the
consumers. Ai,t is the claiming age of individual i and ˆAi,t the variation of claiming age
of individual i due to the reform. It is invariant with t. ∆RCLi,t the number of added
quarter due to the reform for individual i given his birth cohort and its contribution
length at age 60 and Xi,t the control vector for contribution length at age 60, number
of contributed quarters for sick-leave, logarithm of pension, department, year of birth.
These variables are also time invariant. vt is wave fixed effect.
The first part measures the impact of an exogenous increase in claiming age on the probability to consume healthcare. The second part measures the impact of an exogenous increase in claiming age among the consumers on the level of healthcare consumption. In
both part, I use a two stage least square estimator.23 Thus, Equation 3 and Equation 5
estimate the effect of an increase in required contribution length on claiming age (1st
stage). If the first stage is relevant, the reform can be used as an instrumental variable (non-zero assumption verified). Then, Equation 4 estimates the impact of an exogenous increase in claiming age on the probability to consume and Equation 6 on the level of
healthcare consumption among consumers (2nd stage).
Note that in many case, it is not possible to disantangle retirement from income effect, since both changes occur at the same time. In this empirical strategy, due to the nature of the reform used as an IV, I can observe the effect of later retirement independently from income effect of retirement. The reform affects the amount of pension of all the retirees with the same intensity. Since I observe the difference between cohort and within cohort for different contribution length, this effect is isolated. Another income effect could happen since those who choose not to delay their retirement when affected see a decrease of
23As a robustness check, I show in Table C2 that the results are very close using alternative models
like count data models, generalized method of moments, generalised least square, and iv-probit in the first part.
their pension. However, the 2SLS estimator measures the impact for the compliers (local average treatment effect, LATE). Thus, there is no issue regarding those who choose not to react to the reform.
4
Results
4.1
Impact of the Reform on Claiming Age
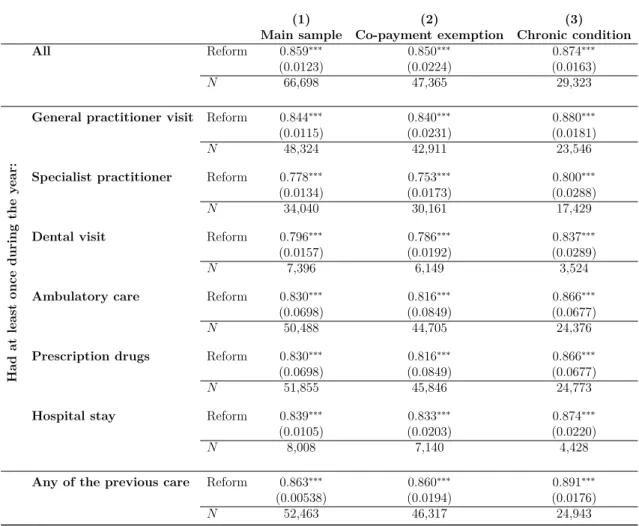
Table 4 shows the impact of one added quarter required to benefit from a full pension on claiming age (in quarter). The results are shown for a large set of samples. Column (1) shows the whole sample and the sub-samples of individuals having at least once a year a general practitioner visit, specialist practitioner visit or other healthcare. Column (2) and (3) present the same results for the sub-samples of individuals who benefit from a co-payment exemption and individuals who have or had a chronic condition after age 65. An added quarter required to get a full pension increases claiming age by 0.859 quarter. This impact is similar in all samples: between 0.778 quarter for the sample of individuals who have at least one specialist doctor visit; and 0.880 in the sample of individuals with a chronic condition and who receive at least one generalist doctor visit during the year. This result is consistent with the existing literature Bozio (2011a) and Bozio et al. (2019). Figure 3 shows that the average claiming age increases by added required quarters, following a linear trend with a leading coefficient very close to one. This result shows that this impact is not only driven by the least or the most affected by the reform. Thus, I conclude that the 1993 reform can serve as an instrumental variable to highlight the causal impact of later retirement on healthcare consumption, and that the variation in intensity can be assumed as linear.
4.2
Impact of Later Retirement on the Probability to Consume
Care
Column (1) of Table 5 shows the causal impact of delaying retirement on the probability to have at least one general practitioner visit, specialist practitioner visit, dental visit, any doctor visit, prescription drugs and stay in private hospitals. An exogenous increase in
Table 4: Impact of the Reform on Claiming Age
(1) (2) (3)
Main sample Co-payment exemption Chronic condition
All Reform 0.859∗∗∗ 0.850∗∗∗ 0.874∗∗∗ (0.0123) (0.0224) (0.0163) N 66,698 47,365 29,323 Had at least once during the y ear:
General practitioner visit Reform 0.844∗∗∗ 0.840∗∗∗ 0.880∗∗∗
(0.0115) (0.0231) (0.0181)
N 48,324 42,911 23,546
Specialist practitioner Reform 0.778∗∗∗ 0.753∗∗∗ 0.800∗∗∗
(0.0134) (0.0173) (0.0288)
N 34,040 30,161 17,429
Dental visit Reform 0.796∗∗∗ 0.786∗∗∗ 0.837∗∗∗
(0.0157) (0.0192) (0.0289)
N 7,396 6,149 3,524
Ambulatory care Reform 0.830∗∗∗ 0.816∗∗∗ 0.866∗∗∗
(0.0698) (0.0849) (0.0677)
N 50,488 44,705 24,376
Prescription drugs Reform 0.830∗∗∗ 0.816∗∗∗ 0.866∗∗∗
(0.0698) (0.0849) (0.0677)
N 51,855 45,846 24,773
Hospital stay Reform 0.839∗∗∗ 0.833∗∗∗ 0.874∗∗∗
(0.0105) (0.0203) (0.0220)
N 8,008 7,140 4,428
Any of the previous care Reform 0.863∗∗∗ 0.860∗∗∗ 0.891∗∗∗
(0.00538) (0.0194) (0.0176)
N 52,463 46,317 24,943
Standard errors in parentheses
∗p < 0.10,∗∗p < 0.05,∗∗∗p < 0.01
Notes: This table shows the impact of the number of added quarters required due to the reform on claiming age. Sample: Main sample is men who had contributed at least once in the private sector and had contributed at age 60 between 131 and 160 quarters, retired before age 67. Column (1): estimation in the main sample. Column (2), estimation in the sub-sample of individuals with a co-payment exemption. Column (3): estimation in the sub-sample of individuals with a chronic condition. The first line is with all individuals following the selection criterion of the column, the second line is among individuals who visit at least once during the year a general practitioner, the third line, a specialist practitioner, and the last line is among individuals who either have at least once a doctor visit (general, specialist or dentist), a stay in private hospital, or a consumption of prescription drugs.
Source: HYGIE 2005-2015.
claiming age by one quarter statistically significantly decreases the probability to have at least one doctor visit by 0.815 percentage point ie. one consumer less over 120 individuals. Moreover, the decrease in the probability to visit a general practitioner visit (−0.828 percentage point) is greater than the decrease in the probability to visit a specialist practitioner (−0.724 percentage point). Probably as a consequence of the decrease in doctor visit, the probability to consume prescription drugs decreases by 0.599 percentage point. However, the probability to visit a dentist and have an hospital stay does not
Figure 3: Impact of the Reform on Claiming Age 0 2 4 6 8 10
Claiming age increase (in quarter)
0 2 4 6 8 10
Number of added quarter due to the reform CI at 95%
Point estimate
Notes: This graph shows the average impact of the number of added quarters an individual experiences due to the reform on the claiming age (1st stage regression). Confidence Intervals at 95 %.
Sample: Men who had contributed at least once in the private sector and had contributed at age 60 between 131 and 160 quarters, retired before age 67.
Source: HYGIE 2005 – 2015.
change significantly.
4.3
Impact of Later Retirement on Healthcare Consumption
Among the consumers, an exogenous increase by one quarter in claiming age statistically significantly decreases the number of doctor visits by 1.14 % (Table 5, Column (2)). One a baseline of 9.30 doctor visits per year, it means a decrease in the number of visits by 0.10 visit per individual, ie. around one visit less for one individual over 10. The overall consumption of doctor (taking into account both the extensive and intensive margin) decreases significantly by 0.9% the number of practitioner visits. Expenditure for doctor visits decreases by 1.64% among consumer but the price per doctor visits does not significantly changes. Thus, the variation in expenditure is driven by the decrease in the number of doctor visits. The overall effect on the expenditure for doctor visits decreases by 4% of annual expenditure.
Table 5: Impact of Later Retirement on Healthcare Consumption
Probability Number of Expenditure for Price for Generalists Claiming age -0.00828∗∗∗ -0.00522∗∗ -0.00370 0.00152
(0.00104) (0.00260) (0.00259) (0.000987)
N 66,698 48,324 48,324 48,324
Specialists Claiming age -0.00724∗∗∗ -0.00797 -0.0177∗∗ -0.00970∗∗∗
(0.00253) (0.00533) (0.00766) (0.00341)
N 66,698 34,040 34,040 34,040
Dentists Claiming age -0.000332 -0.00252 -0.0202∗ -0.0177∗
(0.000889) (0.00525) (0.0120) (0.00984)
N 61,567 7,396 7,396 7,396
Total ambulatory Claiming age -0.00815∗∗∗ -0.0114∗∗∗ -0.0164∗∗∗ -0.00499
(0.00126) (0.00349) (0.00564) (0.00315)
N 66,698 50,488 50,488 50,488
Drugs Claiming age -0.00599∗∗∗ n.a. -0.0138∗∗∗ n.a.
(0.00105) n.a. (0.00290) n.a.
N 66,698 n.a. 51,855 n.a.
Hospital Claiming age -0.000433 -0.00661 -0.00917 -0.00257
(0.00110) (0.00948) (0.00906) (0.00734)
N 66,698 8,008 8,008 8,008
Total Claiming age -0.00516∗∗∗ n.a. -0.0236∗∗∗ -n.a.
(0.000871) n.a. (0.00444) n.a.
N 66,698 n.a. 48,468 n.a.
Standard errors in parentheses
∗p < 0.10,∗∗p < 0.05,∗∗∗p < 0.01
Notes: Retire one quarter later due to the reform leads to a decrease in the probability to have a doctor visit by 0.815 percentage point, and a decrease in the number of doctor visits among the consumers by 1.14%, the expenditure for doctor visits by 1.64% and the expenditure per visit by 0.00499 (but not significantly).
Sample: Men who had contributed at least once in the private sector and had contributed at age 60 between 131 and 160 quarters, retired before age 67.
Source: HYGIE 2005 – 2015.
This effect on doctor visits can be split between the effect on generalist practitioners and specialist practitioner visits. Interestingly, the number of generalist doctor visits sig-nificantly decreases by 0.522% but not the price per generalist practitioner visits. At the reverse, the number of specialist practitioner visits does not varies significantly but the price per visit significantly decreases by 0.97%. A large part of the generalist practitioners in France have an agreement with the National Health Insurance to apply the regulated
price (23e for a standard visit in 2015). At the reverse, a minority of specialist
practi-tioner have such an agreement. It may explain the reason why there is no price effect for generalist practitioners consumption but there is one for specialists. Regarding the decrease in price for specialist, two mechanisms could apply. First, individuals who retire later would choose more often specialist doctors with an agreement (ie. in average, at a given speciality, less expensive). Second, individuals who retire later would visit different
type of specialist practitioners.24
There is no significant impact on the number of dental visits or expenditure for dentist. There is also a negative non significant impact on the number of days in private hospital and on the expenditure for hospital stays. It supports the absence of substitution effect between ambulatory care and hospital care.
The decrease in healthcare consumption is similar in the whole sample and in the sub-sample of individuals having a chronic condition (Table D1). Later retirement decreases the probability to have a doctor visit by 1.45 percentage points and the number of doctor visits by 1.67% among consumers among those having a chronic condition. The decrease is slightly lower in the main sample, meaning that the impact is not massively driven neither by those with a chronic condition nor those without.
Figure 4 shows the point estimate for sub-sample of individuals between ages 66 and 68, 67 and 69 and so on and so forth until a sample of individuals aged between 74 and 76. It shows that the effect is most of the time negative but not always significant. The negative impact at the extensive margin tend to be statistically significant only for the oldest samples while the negative impact at the intensive margin is mainly statistically significant for the youngest samples.
4.4
Underlying Mechanisms
As highlighted by numerous studies, one may think individuals who retire later consume less healthcare because they are in better health. This mechanism could apply for at
least three reasons. First, work could be health preserving (us-it-or-loose it hypothesis);25
second, a longer working life could increase the duration during which individuals had an incentive to invest in health because of the opportunity cost of sick-leave; third, a more progressive retirement through arrangement with the employers could happens due
to the reform26 at the end of the working life for those who were affected by the reform.
This effect would be consistent with the literature on self-reported health. However, this potential “health” mechanism has to be mitigated. Table D3 shows a slightly significant increase by 0.209 percentage point in the probability to have a chronic condition after age
24Each speciality has a different average price.
25Cognitive and physical abilities are preserved when used. Thus, later retirement preserves health.
65 due to later retirement.
The variation in inter-temporal income is not likely to play a major role in this study for at least two reasons. First, all individuals in a given cohort see the amount of their pension affected by the reform the same way. Second, Table D2 of Appendix D shows that, among those with a co-payment exemption, the results are similar (a decrease by 0.740 percentage point in the probability to have a doctor visit, and a decrease by 1.30% in the number of doctor visits). There is no impact on dentist visits and private hospital stays. It suggests that neither the healthcare cost nor the income would explain the observed decrease. Thus, the decrease is probably not associated with an increase in the share of individual foregoing healthcare consumption. The increase seems to be due to a decrease among those with a high level of consumption (See Tables D4 and D5).
Lastly, one may think the decrease is attributable to a decrease in health investment, through a decrease in preventive care for those who retire later. This decrease could be a compensation of an increasing investment during working life or due to the fact individuals affected by the reform are, at the same age, closer to their retirement date (and thus, to their last investment). This result would be consistent with the decrease in preventive care found at retirement by Frimmel and Pruckner (2020). Unfortunately, this hypothesis cannot be tested in this study.
Conclusion
In this paper, I use a two stage least square estimator in a two part model to estimate the causal impact of later retirement on healthcare consumption at extensive and at intensive margins. I focus on a sample of men who worked in the private sector, aged from 66 to 76. I use the first French pension reform that increased claiming age as an instrumental variable. Moreover, this paper is one of the first to focus on the impact of a variation in retirement timing on retirees on their healthcare consumption rather than on the impact of the switch from employment to retirement. I show that a one quarter delayed retirement due to the reform decreases statistically significantly the probability to have at least one doctor visit (extensive margin) and the number of doctor visits among consumers (intensive margin). This result is consistent with previous findings.
Three main potential mechanisms could explain it. First, one may think that the better individual’s health is, the latter he retire. It would be the case if the use-it-or-loose-it hypothesis holds; if individuals invest more in their health when in employment; or if later retirement due to this reform is associated with a better anticipation of retirement life. In this study, I cannot provide evidence of this underlying mechanism since I don’t have health, well-being or life-satisfaction indicators. However, the slightly significant increase in the probability to have a chronic condition after age 65 make this “health mechanism” potentially unlikely or not the only one to play a role. Another mechanism could be an increase in the share of individuals foregoing healthcare among those who delayed retirement. However, I found a similar impact among those with a co-payment exemption, which make this mechanism unlikely. Finally, one may think that individuals who retire later decrease their healthcare investment more often than the others, and thus, consume less preventive care. This mechanism could be a compensation of a longer investment in health (through a longer working life) or by the fact that at each given age, they are closest to their last health investment from their working life.
The decrease in healthcare consumption due to the reform is of double financial gain
for the public finance.27 However, it is impossible to draw a conclusion from a public policy
perspective without any qualitative understanding regarding the underlying mechanism explaining this result. This paper shows the importance for more research in this field. If the decrease in healthcare consumption is associated with a better health, through a confirmation of the use-it-and-loose-it hypothesis, the public policy recommendation would be in favor of a policy that increase the incentive for retirees to have social, physical and cognitives activities. If the health improvement is through the health investment during employment, the public policy advice would be to increase incentives for health investment during retirement. If there is no health variation due to delayed retirement but a decrease in preventive healthcare utilisation, the public policy would increase incentives for health investment during retirement.
Finally, this paper does not pretend to have an external validity. Those results stand only for men from the private sector, with average career length. The extrapolation to women, self-employed or civil servants may be wrong. Moreover, an increase in claiming
age for individuals who retire between age 60 and 65 may have a different impact on health than an increase in claiming age for those who retire between age 65 and 67. Thus, the results should not be extended to other pension reforms that change claiming age at an earlier or later age.
References
Aubert, P. (2009): “Âge de cessation d’emploi et de liquidation d’un droit à la retraite. Le cas de la génération 1938,” Etudes et résultats, 1–6.
Benallah, S. and C. Mette (2009): “Âge moyen de départ en retraite : tendances récentes et évolutions attendues,” Retraite et société, 2, 166–183.
Blake and Garrouste (2019): “Collateral Effects of a Pension Reform in France,”
Annals of Economics and Statistics, 57–86.
Bozio, A. (2011a): “La réforme des retraites de 1993 : l’impact de l’augmentation de la durée d’assurance,” Economie et statistique, 441, 39–53.
——— (2011b): “Mesurer l’impact de l’augmentation de la durée d’assurance: le cas de la réforme des retraites de 1993,” Économie et statistique, 441–442.
Bozio, A., C. Garrouste, and E. Perdrix (2019): “Impact of later retirement on mortality: Evidence from France,” PSE Working Paper, 48.
Bíró, A. and P. Elek (2018): “How does retirement affect healthcare expenditures? Evidence from a change in the retirement age,” Health Economics, 27, 803–818.
Calvet, L. (2012): “Dépenses de santé, hospitalisations et pathologies des personnes âgées de 75 ans ou plus,” Les comptes nationaux de la santé, 55–70.
Calvet, L. and A. Montaut (2013): “Dépenses de soins de ville des personnes âgées dépendantes,” Dossiers Solidarité et Santé, 3–26.
Coe, N. B. and G. Zamarro (2015): “Does Retirement Impact Health Care Utiliza-tion?” SSRN Electronic Journal.
Davie, E. and M. Mazuy (2010): “Fécondité et niveau d’études des femmes en France à partir des enquêtes annuelles de recensement,” Population, 65, 475.
Eibich, P. (2015): “Understanding the effect of retirement on health: Mechanisms and heterogeneity,” Journal of Health Economics, 43, 1–12.
Franc, C., M. Perronnin, and A. Pierre (2007): “Changer de couverture complé-mentaire santé à l’âge de la retraite. Un comportement plus fréquent chez les titulaires de contrats d’entreprise,” Questions d’économie de la santé, 6.
Frimmel, W. and G. J. Pruckner (2020): “Retirement and healthcare utilization,”
Journal of Public Economics, 184, 104146.
Gorry, A., D. Gorry, and S. N. Slavov (2018): “Does retirement improve health and life satisfaction?” Health Economics, 27, 2067–2086.
Grossman, M. (1972): “On the concept of health capital and the demand for health,”
Journal of Political Economy, 80, 223–255.
Grøtting, M. W. and O. S. Lillebø (2018): “Health Effects of Retirement: Evidence from Survey and Register Data.” WP University of Bergen, 10/18, 45.
Hagen, J. (2018): “The effects of increasing the normal retirement age on health care utilization and mortality,” Journal of Population Economics, 31, 193–234.
Hallberg, D., P. Johansson, and M. Josephson (2015): “Is an early retirement offer good for your health? Quasi-experimental evidence from the army,” Journal of
Health Economics, 44, 274–285.
Hansen, L. P. (1982): “Large Sample Properties of Generalized Method of Moments Estimators,” Econometrica, 50, 1029.
Jones, A. M. (2000): “Health econometrics,” in Handbook of Health Economics, Elsevier, vol. 1, 265–344.
Kuusi, T., P. Martikainen, and T. Valkonen (2020): “The influence of old-age retirement on health: Causal evidence from the Finnish register data,” The Journal of
the Economics of Ageing, 100257.
Lapinte, A. and M. Perronnin (2018): “96 % des salariés ont accès à une assurance complémentaire santé d’entreprise en 2017,” Questions d’économie de la santé, 6. Leung, S. F. and S. Yu (1996): “On the choice between sample selection and two-part
Llena-Nozal Ana, Lindeboom Maarten, and Portrait France (2004): “The effect of work on mental health: does occupation matter?” Health Economics, 13, 1045–1062.
Lucifora, C. and D. Vigani (2018): “Health care utilization at retirement: The role of the opportunity cost of time,” Health Economics, 27, 2030–2050.
Lumley, T., P. Diehr, S. Emerson, and L. Chen (2002): “The Importance of the Normality Assumption in Large Public Health Data Sets,” Annual Review of Public
Health, 23, 151–169.
Madden, D. (2008): “Sample selection versus two-part models revisited: The case of female smoking and drinking,” Journal of Health Economics, 27, 300–307.
Nielsen, N. F. (2019): “Sick of retirement?” Journal of Health Economics, 65, 133–152. Shai, O. (2018): “Is retirement good for men’s health? Evidence using a change in the
retirement age in Israel,” Journal of Health Economics, 57, 15–30.
Sourty-Le-Guellec, M.-J. (1999): “Profils de consommateurs de soins: France 1995,”
Questions d’économie de la santé, 1–4.
Toulemonde, F. (2017): “La médecine d’urgence,” in Les établissements de santé, Panoramas de la Drees santé, 127–130.
Zhang, Y., M. Salm, and A. van Soest (2018): “The Effect of Retirement on Healthcare Utilization: Evidence from China,” Journal of Health Economics.
Appendix to
Does Later Retirement Change your Healthcare
Consumption?
A
Institutional Framework
A.1 The 1993 Pension Reform
The pension is computed using the following formula:
P = τ × P C × Wref
with τ the replacement rate; P C, the proratisation coefficient; and Wref the reference
wage. Wref is equal to the best N years of wages.
The replacement rate formula is:
τ = 0.5 − δ × max[0; min(4 × (65 − a); D − d)]
with a, the claiming age; D, the required contribution length to benefit from a full re-placement rate; d the number of quarters contributed; and δ, the minimization coefficient, equal to 1.25 % per missing quarter.
The 1993 reform changes :
• D, The number of quarters required to benefit from a full pension
– For cohorts born before 1934, D equals 150 quarters
– Each cohort born in 1934 and after has one added quarters compared to the
previous cohort
– From cohort 1943, D equals 160 quarters
• N , the number of best years of wages
– N increases by one year every year – N equals 25 years from 2010
• Pensions are indexed on price and not wages. In practice, this indexation applies already from 1987.
Thus, the change on the number of quarters required affects only a little share of indi-viduals in each cohort, because all indiindi-viduals with very short career will leave at age 65 whatever the change in D, and individuals with very long career will leave at age 60 whatever the change in D. The change in N affects each cohort in the same way. The indexation change affects all cohorts in the same way. As a consequence, assuming that all individuals in each cohort are affected in the same way by the change in N and in-dexation, the difference between individuals affected and not affected by the D change within each cohort captures only the effect of this part of the 1993 reform.
A.2 The Health Insurance System in France
In France, there is a public mandatory health insurance for almost all the French. The
reimbursement rate is defined at the national level for each care.28 Moreover,
contribu-tion varies according to the status on the labour market (student, worker, unemployed, retired...).
In average, this mandatory public coverage reimburse 78 % of the healthcare expendi-ture. However, there is heterogeneity in the reimbursement rate. In particular, individuals suffering from chronic diseases benefit from a 100% reimbursement of their expenditures associated with their chronic disease from the public health insurance to cover.
To cover expenditure which are not reimbursed by the National Health Insurance, in-dividuals can subscribe to a private supplementary health insurance. It can be through an
individual contract or a collective firm contract. Before 2016,29 private sector employees
can benefit from supplementary health insurance through a collective firm contract paid both by employees and employers. The firm has to pay at least 50% of the insurance fees. 51 % of private sector firms offer a collective supplementary insurance in 2015 (Lap-inte and Perronnin, 2018) and 75 % of private sector employees benefit from a collective
28Except in Alsace-Moselle area, where there is a higher coverage rate.