HAL Id: halshs-00778526
https://halshs.archives-ouvertes.fr/halshs-00778526
Submitted on 20 Jan 2013HAL is a multi-disciplinary open access archive for the deposit and dissemination of sci-entific research documents, whether they are pub-lished or not. The documents may come from teaching and research institutions in France or abroad, or from public or private research centers.
L’archive ouverte pluridisciplinaire HAL, est destinée au dépôt et à la diffusion de documents scientifiques de niveau recherche, publiés ou non, émanant des établissements d’enseignement et de recherche français ou étrangers, des laboratoires publics ou privés.
SPATIAL ARCHAEOLOGY USING IMAGE
ANALYSIS AND MATHEMATICAL MORPHOLOGY
Christine Voiron, Emmanuel Doveri, Johanna Fusco
To cite this version:
Christine Voiron, Emmanuel Doveri, Johanna Fusco. SPATIAL ARCHAEOLOGY USING IMAGE ANALYSIS AND MATHEMATICAL MORPHOLOGY. 17 Th. European Colloquium on Quantita-tive and Theoritical Geography, Sep 2011, Athènes, Greece. �halshs-00778526�
SPATIAL ARCHAEOLOGY USING IMAGE ANALYSIS AND
MATHEMATICAL MORPHOLOGY
Christine VOIRON-CANICIO
1, Emmanuel DOVERI
2, Johanna FUSCO
31
Professor of Geography, University of Nice, UMR CNRS ESPACE, 98 Boulevard Edouard Herriot, BP 3209 06204 Nice, France. Email: [email protected].
2
Master student, University of Nice, UMR CNRS ESPACE, 98 Boulevard Edouard Herriot, BP 3209 06204 Nice, France. Email:[email protected].
3
Master student, University of Nice, UMR CNRS ESPACE, 98 Boulevard Edouard Herriot, BP 3209 06204 Nice, France. Email: [email protected].
ABSTRACT
For the last ten years, geographers, archaeologists and historians work together around the analysis of space transformation processes at various time scales, in particular long-term ones. However, the approaches which were developed until then to study the arrangement of archaeological remains and the links they share with their environment, are on one hand most related to statistical and counting methods, and on the other hand often take into account only their functional or symbolical dimension, overshadowing their purely physical aspect. Image analysis by Mathematical Morphology permits to overtake this limit. Two applications of this method are proposed: the first consists in detecting spatial configurations in the arrangement of funerary structures in a Bronze Age necropolis of central Mongolia, in order to point out some particular organisations. The purpose of the second study is to set up an image processing protocol applied to urban maps from different dates, permitting to detect the various architectonic orientations.
KEYWORDS
Spatial Analysis, Image Analysis, Mathematical Morphology, Archaeology, Building alignment 1. INTRODUCTION
Geography and Archaeology have in parallel experienced a huge upheaval in terms of reflexion and methods during the twentieth century, and particularly in the nineties. Archaeologists became progressively aware of the necessity to consider a true spatial dimension in their researches (Djindjian, 1991), and geographers shown the wiliness to associate time to space in a more rigorous and explicit way (Lepetit, 1990). The conjunction of these new perspectives gave birth to a discipline, whose originality is first given by its interdisciplinarity, and named “spatial archaeology” (Van der Leeuw, Fiches, 1989). However, as this discipline is really recent, only a few works can be really considered as such. But all of them claim to adhere to Archaeomedes program (Favory & al., 1998), which certainly constituted the impulse of spatial archaeology.
The ambition of this study is to position itself in the field of this discipline: the objective here is to detect invisible structures from visible shapes, and to link these shapes to the processes which gave them birth (Voiron, 1995), on the basis of archaeological data, to detect structures, underlying spatial organisations of remains arrangement.
Image analysis by Mathematical Morphology is for that purpose an original and interesting method, which permits to introduce a supplementary dimension in spatial archaeology: the remains’ shape one. Indeed, archaeological remains are not taken here for what they do represent, or classified, categorized, conceptualized according to their nature, but taken in a raw way, without stripping them of their proper originality, of their individual shape and variations. Moreover, Mathematical Morphology presents the advantage to be an extremely flexible method, where each image transformation is a step towards a precise aim, defined by the researcher: the results of the study are directly linked to the reasoning built by the operator, and of its interpretations. Moreover, the retrospective geographic study by Mathematical Morphology analysis can be helpful to the archaeologists to better foresee and anticipate the potentially interesting zones to conduct excavations. This method will be here tackled through two works, which take into account two spatial and temporal scales: the first study consists in detecting spatial configurations in the arrangement of funerary structures in a Bronze Age necropolis of central Mongolia. The purpose of the second study is to set
up an image processing protocol applied to urban maps from different dates, permitting to detect the various architectonic orientations.
2. FINDING SPATIAL STRUCTURES IN THE ARRANGEMENT OF FUNERARY MONUMENTS ON A BRONZE AGE NECROPOLIS (CENTRAL MONGOLIA) WITH MATHEMATICAL MORPHOLOGY
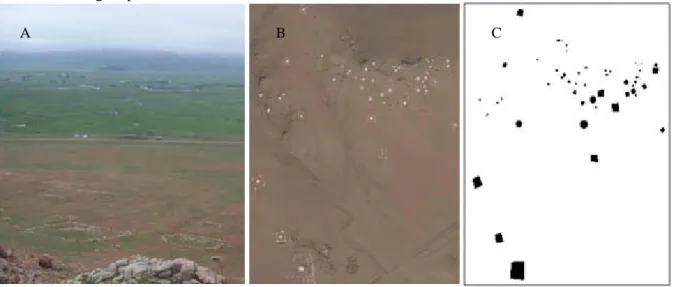
The purpose of this study is to question the relevance of image analysis to resolve an issue belonging to archaeology and spatial analysis at the same time. Its aim is to detect spatial structures of the arrangement of funerary monuments building up the Bronze Age necropolis of Tsatsiin Ereg (figure 1A) in Central Mongolia, by the use of Mathematical Morphology.
Indeed, the sacred and ceremonial dimensions of funerary complexes discovered by archaeologists can lead us to think that they had been arranged in a very particular way, following a certain number of rules which it would be interesting to reveal, by detecting visible or invisible spatial structures, and the spatial links which unite them.
Three binary images have been built in order to realize the treatments under Micromorph software, on the basis of an initial satellite image (figure 1B) showing the localization and the shape of the tombs on a little part of the necropolis. The first image built shows the distribution of the tombs (figure 1C) on Tsatsiin Ereg slope.
Figure 1: From Tsatsiin Ereg tombs picture (A) and satellite image (B) to build a binary image (C)
Two other images were built: two imaginary lines, the first one materialising the summit of Tsatsiin Ereg slope, and the second one separating it on two equal parts from the top to the bottom.
This study’s frame is constituted with four main objectives: the first is to determine if the tombs size and position on the slope is causally linked. Then, the purpose is to see if the tombs are distributed uniformly on the slope, or if some zones contain more tombs than others. The third question was to make appear the distance separating the tombs, according to their localization on the slope, and finally, to determine if these monuments are oriented in a particular way.
Some preliminary treatments have first been realized: their aim was to build first images, which could be taken as a basis of some further manipulations. Even if their interpretation power is limited when you consider them independently, they will reveal all their subtlety simultaneously -this will be the final step of the analysis.
The first step is to realise a granulometry test on the tombs: the purpose of this sieve is to sort out monuments according to their size, by taking them out a certain number of pixels -erosion- and then adding them the same number of pixels –dilation- on the resulting image. The variation of this pitch allowed us to build three classes: the big, medium and small tombs (figure 2A). A second granulometry test is then realised, in order to highlight the voids between the tombs, in other words the distances which separate them, to materialise their arrangement according to their proximity. The process is the opposite of what we did before: here, we first dilated and then eroded the tombs image of a determined pitch (figure 2B).
Figure 2: Size classes of the tombs (A) and space between them (B)
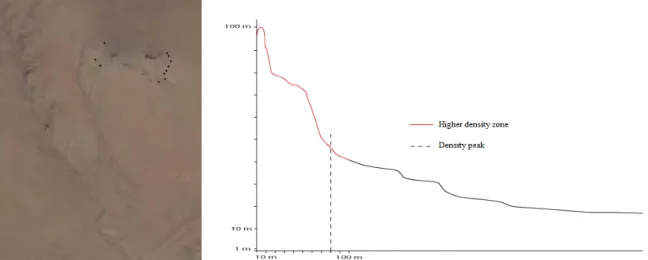
We now attempted to reveal the zone where the tombs are the most numerous, relatively to the summit and the centre of the slope (figure 3), by cutting virtually this one in 20 meters large stripes. The summit image undergoes successive dilations of 7 pixels (equivalent to 20 meters), and each obtained image is superposed with the tombs image. The number of monuments contained on each dilated surface is counted and referenced. The same manipulations are now realised taking into account the image of the centre of the slope instead of the summit one. After these processes, we finally crossed the two obtained images, in order to localize the 400 meters square zone of the slope where the tombs are the most numerous.
Figure 3: 400 m² zone of higher density of tombs, and their link with topography
As a result of all these preliminary manipulations, we can observe that the biggest tombs are actually situated at the extremities of the slope, or even in the plain, and seem to delimit a “sacred space” in opposition with the “living space” of the actual nomad pastoralists. Their size increases gradually from the periphery towards the centre of the slope: this phenomenon could show the wiliness to highlight the most important monuments in terms of size and social hierarchy. It is furthermore possible to detect that the slope zone containing the greatest density of tombs (at 80 meters from the summit) is planer than its superior part - it is directly situated under the granitic tor- but stonier than the plain. This observation can be explained by some obvious practical reasons (less effort to build the tomb and access to first material) but also by the strength of the symbolic dimension of stone in Mongolian beliefs (Ruhlmann, 2009).
The second step of the analysis is to cross the different images obtained, in order to realise more interesting interpretations.
Now, if we superpose the “skeleton” of the tombs (figure 4A), representing their general structure, and the image distinguishing the different size of the tombs, we notice that the arrangement of the tombs on the slope seems to form a pyramid (figure 4B), whose summit would be composed with the biggest
A B
Big Medium Small
tombs, and its base with the smallest and medium monuments, maybe materializing the social hierarchy of the deceased.
Figure 4: Skeleton of the tombs (A) and pyramidal structure of the necropolis (B)
We also notice than the median of this triangle is materialised by the one of the branches of the delta formed by the tombs’ skeleton, which confirms the observation of a central position of the biggest tombs. In addition, the little branches of the skeleton are perfectly parallel to the west part of the triangle, and to the bed of an ancient river. The sacred dimension of rivers in Mongolia (Lavrillier, 2006) could justify this structure, and allows us to emit the hypothesis that this element could have played an important role in the arrangement of the tombs.
Then, if we cross the image representing the 400 meters square zone containing the greatest tombs’ density, and the “skeleton” formed by the smallest tombs (figure 5A), we notice that these two images are perfectly superposing: it means that the tombs contained in this part of the slope are the smallest. This peripheral space could be eventually seen as a zone of less importance: the presence of a great number of tombs could be only the effect of their small size and of the convenience of the field, and as the consequence of the possibility to build many of them in a restricted space, for the benefit of most important zones.
In order to interpret the distance between the tombs, we successively superposed the images comporting the three tomb size classes, with the one showing the sieve of their spacing (figures 5B1,
B2, B3).
Figure 5: A: small tombs and zone of higher density of monuments. B: size of tombs and space between them, B1: big tombs,B2 medium tombs, B3 small tombs
It is actually possible to notice that the space between the tombs seems not directly linked with their size, - each size class presents some tombs at the inside and at the outside of the closest spaces zone - but rather with their position on the slope: the tombs are more spaced in the lain. This observation could be possibility linked with the fact that the monuments we find in the plain are surrounded by small satellite structures – which we could not take into account in this study- whose building asks much available space, inexistent on the slope.
If we consider the orientation of the tombs, which Micromorph software is able to detect, it seems that all these structures are oriented towards the Tamir river –South-West. This observation reinforces the hypothesis about the importance of liquid element, and of the possibility of its role on the necropolis’ building.
A B1
A B
3. ANCIENT URBAN PLANNING RECONSTRUCTION
The second study aims to identify ancient urban planning thanks to recent archaeological diggings and to high definition charts, showing constructions in detail: we think that some of the oldest buildings of that Fortress kept into their walls orientations of past urban planning.
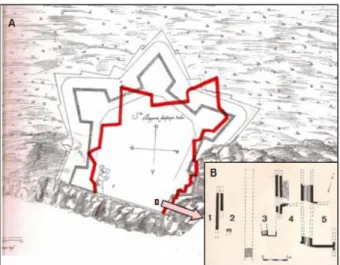
The Fort Royal is located on the highest relief of the Sainte-Marguerite Island, the largest island of the Lérins archipelago (figure 6). Facing Cannes' shores, this ancient State Fortress has been built over the remains of an antique oppidum, of which evidence of existence have been found in 1972 during some emergency excavations (figure 7B).
Figure 6: The fortress, where have been found
remains of an ancient oppidum.
Figure 7A: Attempt to reconstruct the Charles IX fortress
plan according to spanish planning; Figure 7B: Actual findings and one of the supposed directions: vector N1. After G.Vindry's mapping, 1980's
The well preserved traces of dwellings, streets or even sewers presented evidence of planned urbanisation (figure 7B) and archaeologists recognised the grid plan of hippodamian style (Phoca, Valavanis, 1999). Today, thanks to a very good experience of field, we wonder if nowadays buildings into the Fort Royal don't keep into their very orientation, their walls and situation into the limits of the Fort, the trace of previous urban or palatial planning. Common scientific knowledge incline towards the following chronology for the evolution of this site: an indigenous oppidum until the roman period with a change of the orientation of the buildings, opening on a 10 centuries period of darkness until a map drawn under Charles IX, showing a fortress recently up-dated to gun warfare and siege (figure 7A). Today's Fort is the result of Spanish and French constructions very well documented, starting in 1630's during the 30 years long war, but taking advantage of previous constructions obviously never chartered before.
The aim of this study is twofold:
i) Showing that they are still some buildings and walls following ancient plans, pre-roman and roman in order to indicate to archaeologists the possible extension of the ancient sites,
ii) Providing an image processing protocol which enables archaeologists to depict automatically the morphology of these urban plans.
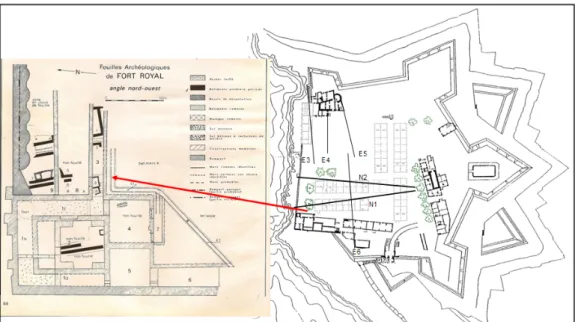
In order to reconstitute the cities plans, archaeologists have used to extend the bits of the ways brought to light by the excavations or detected by remote sensing, by using a ruler and a square. Our method differs by the fact that on one hand, it is based on spatial analysis by image analysis and that on the other hand, it is carried out with various documents: a diggings plan and maps giving the current arrangement of the buildings and more precisely, the walls located within. In figure 8, all the buildings of the Fort have been depicted. Some buildings have been left apart from this study because they are historically well documented: we know who and how they’ve been built. They have been drawn with light grey color in figures 8 and 11.
We can observe two North-South directions corresponding to the alignment of the ruins of the oppidum and the ruins of roman buildings. Directions more or less perpendicular can be observed in
different buildings (figure 8). We isolate 4 directions, more or less at right angle, with the North-South directions.
Figure 8: The relevant building orientations N1, N2, E3, E4, E5, E6 and a focus on the archaeological diggings
done at the North West corner of the Fort.
Those 6 directions vectors actually, have been set on gridded images, in order to make directional dilations using mathematical morphology algorithms (figure 9).
vector N1 dilation of N1 vector E3 dilation of E3
Figure 9: Examples of directional dilations
The result of intersections of two images gives a parallelogram the shape of which is analysed using a qualitative matching (figure 10). From that six vectors (two North/South, and four East/West), by Mathematical Morphology processing, we will try to get parallelograms showing the squareness of their angle, through dilation and intersection. The most square is the parallelogram, the most likely the directions match with an hippodamian grid urban plan, the indigenous one (Oppidum) with N1 and the roman one with N2.
Intersection between: dir. N1and E4 dir. N2and E5 dir. N1 and E5
Figure 10: Qualitative matching of the parallelograms: analysis of the squareness of the angle
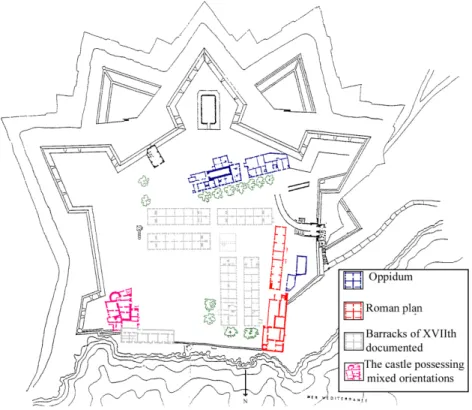
The origins of the direction (the vector from the chart) on the map indicate the buildings and structures having this direction, enabling the spatial analysis of the Fort evolution and establishing a chronology of the successive constructions, or even their evolution and fate (figure 11). The processing of images shows two groups of positive results: N1 with E3 and E4, and N2 with E5, of which final parallelograms are almost perfectly square. According to the original directions found on the map, we determine the building possessing those directions. Apart the barracks of the XVIIth century, three
groups of constructions appear in figure 11: the most southern group of buildings, which seem to belong to the most ancient plan of the oppidum, the North West group of buildings, perfectly square, belonging to the roman period (palatial?), and a vey interesting group of constructions, called “the castle”, where we find all the directions from every period. This castle seems to have been built, rebuilt and extended many times during 2000 years, keeping the directions of past urban plans.
It is important to notice that all these groups of constructions are situated on the margins of the Fort, close to the walls of the Fortress. This would confirm that the Spanish troops destroyed drastically the centre of the Fortress to flatten the ground in order to built barracks that finally the French did.
Figure 11: The chronology of the successive constructions 4. CONCLUSIONS AND DISCUSSION
The two presented studies belong to spatial archaeology. This field, which still remains few widespread, aims to distinguish, on the basis of the spatial and spatio-temporal marks given by archaeological data, networks of chronological relations but also spatial and dynamic structures, and the way these relations vary through space. The detected spatial organisation has to contribute to retrace the functioning of past anthroposystems.
Our studies position themselves into this research frame, but are distinct from the previous works of spatial archaeology for three reasons. They are conducted at the micro scales of an archaeological site and of a little Mediterranean city, while the works realised until then were realised at a small scale, the regions’ one. Our spatial analysis approach favours the morphological aspect of the objects considered. The objective is indeed to detect invisible spatial structures from visible shapes, to embody the detected structures and to link them with the processes which gave them birth. Finally, image analysis, with the help of Mathematical Morphology Algorithms, was not used to realise a remote-sensing analysis but to find spatio-morphological structures (Voiron, 1995).
The two proposed studies take into account types of relations existing between the objects through space. Each one presents particular scientific interests.
With the help of Mathematical Morphology, we could detect some underlying spatial structures of the monuments’ disposition on the Bronze Age necropolis. Some hints about the organisation of the tombs, their position on the slope, and their link with local topography have been revealed for the first time at a similar scale, on a funerary site, and by the use of Mathematical Morphology. Further perspectives can be here envisaged: realising similar treatments on the totality of the necropolis, and on other necropoleis, could be interesting in order to compare the organisation obtained. This would permit to create an exhaustive organisation model of Mongolian Bronze Age necropoleis, with a real
explicative dimension, as the lack of comparison of the present study gives it only a descriptive one. This model would be one of the elements built to understand space perceptions of Mongolian nomadic groups, and its evolutions through time and space.
The study about the Sainte-Marguerite fortress presents two methodological originalities: i) the research was conducted on the basis of current architectural data, and not on archaeological remains, ii) by considering the directions revealed by a little zone of excavations, the approach permits to determine the building groups belonging to the hippodamian plan and to estimate the extent of the oppidum. From the hypothesis of this plan, the obtained results show the membership of some building groups to really ancient plans, from the oldest period of the site. They open interesting historical research perspectives about the existence of an antique city on the Sainte-Marguerite Island. 5. REFERENCES
Favory F., Durand-Dastès F., Fiches J.L., Mathian H., Pumain D., Raynaud C., Sanders L., Van der Leeuw S. (1998) ARCHAEOMEDES, Des oppida aux métropoles, Archéologues et géographes en vallée du Rhône, Paris, Anthropos-Economica, 280 p.
Fiches, J.-L., Van der Leeuw, S. E. (1989) De la structuration et de l’analyse spatiale aux processus historiques, In : "Archéologie et espaces", Actes des Xe rencontres internationales d'archéologie et d'histoire d'Antibes, CRA-CNRS, pp. 503-512.
Djindjian F. (1991) Méthodes pour l’archéologie, Armand Colin, 401 p.
Lepetit B. (1990) Remarques sur la contribution de l’espace à l’analyse historique, in Géopoint 90 Histoire, temps et espace, Avignon, Groupe Dupont, pp. 31-40.
Lavrillier A. (2006) « S’orienter avec les rivières chez les Evenks du Sud-est sibérien : Un système d’orientation spatial, identitaire et rituel », Études mongoles et sibériennes, centrasiatiques et tibétaines, pp. 36-37
Phoca I, Valavanis P. (1999) Architecture and city planning, Kedros, 128 p.
Ruhlmann S. (2009), « L’enterrement chez les Mongols contemporains : le cercueil, la tombe et la yourte miniature du mort », Études mongoles et sibériennes, centrasiatiques et tibétaines, 40
Voiron C. (1995) Analyse spatiale et analyse d’images, Collection Espaces modes d’emploi, Montpellier, GIP RECLUS, 190 p.