HAL Id: hal-00691833
https://hal.archives-ouvertes.fr/hal-00691833
Submitted on 27 Apr 2012
HAL is a multi-disciplinary open access archive for the deposit and dissemination of sci-entific research documents, whether they are pub-lished or not. The documents may come from teaching and research institutions in France or abroad, or from public or private research centers.
L’archive ouverte pluridisciplinaire HAL, est destinée au dépôt et à la diffusion de documents scientifiques de niveau recherche, publiés ou non, émanant des établissements d’enseignement et de recherche français ou étrangers, des laboratoires publics ou privés.
An optimized workflow enactor for data-intensive grid
applications
Tristan Glatard, Johan Montagnat, Xavier Pennec
To cite this version:
Tristan Glatard, Johan Montagnat, Xavier Pennec. An optimized workflow enactor for data-intensive grid applications. 2005, pp.17. �hal-00691833�
LABORATOIRE
INFORMATIQUE, SIGNAUX ET SYSTÈMES DE SOPHIA ANTIPOLIS
UMR 6070
A
N OPTIMIZED WORKFLOW ENACTOR FOR
DATA
-
INTENSIVE GRID APPLICATIONS
Tristan Glatard, Johan Montagnat, Xavier Pennec
Projet
RAINBOW
Rapport de recherche
ISRN I3S/RR–2005-32–FR
O
ctobre 2005
LABORATOIREI3S: Les Algorithmes / Euclide B – 2000 route des Lucioles – B.P. 121 –
06903 Sophia-Antipolis Cedex, France – Tél. (33) 492 942 701 – Télécopie : (33) 492 942 898 http://www.i3s.unice.fr/I3S/FR/
RÉSUMÉ:
Les applications orientées données bénéficient d’un parallélisme de donnée intrinsèque qu’il est nécessaire d’exploiter pour réduire leur temps d’exécution. Ces dernières années, des grilles de données ont été développées pour permettre le traite-ment et l’analyse de volumes de données imposants produits par diverses disciplines scientifiques. Ces infrastructures à grande échelle sont néanmoins soumises à une utilisation intensive et l’efficacité y est d’une extrême importance. Ce papier traite de l’optimisation des gestionnaires de workflow utilisés pour déployer des applications complexes orientées données sur les grilles. Pour ce type d’applications, nous montrons comment mieux exploiter le parallélisme de données que cela n’est fait dans la plu-part des gestionnaires de workflow existant. Nous présentons la conception d’un prototype qui implémente notre solution et nous montrons qu’il fournit une accélération significative en montrant des résultats sur une application réaliste de traitement d’images médicales.
MOTS CLÉS:
Grille, workflow
ABSTRACT:
Data-intensive applications benefit from an intrinsic data parallelism that should be exploited on parallel systems to lower execution time. In the last years, data grids have been developed to handle, process, and analyze the tremendous amount of data produced in many scientific areas. Although very large, these grid infrastructures are under heavy use and efficiency is of utmost importance. This paper deals with the optimization of workflow managers used for deploying complex data-driven applications on grids. In that kind of application, we show how to better exploit data parallelism than currently done in most existing workflow managers. We present the design of a prototype implementing our solution and we show that it provides a significant speed-up w.r.t existing solutions by exemplifying results on a realistic medical imaging application.
KEY WORDS:
An optimized workflow enactor for data-intensive
grid applications
Tristan Glatard, Johan Montagnat, Xavier Pennec
Abstract— Data-intensive applications benefit from an
intrinsic data parallelism that should be exploited on parallel systems to lower execution time. In the last years, data grids have been developed to handle, process, and analyze the tremendous amount of data produced in many scientific areas. Although very large, these grid infrastructures are under heavy use and efficiency is of utmost importance. This paper deals with the optimization of workflow managers used for deploying complex data-driven applications on grids. In that kind of application, we show how to better exploit data parallelism than currently done in most existing workflow managers. We present the design of a prototype implementing our solution and we show that it provides a significant speed-up w.r.t existing solutions by exemplifying results on a realistic medical imaging application.
I. C
This work aims at enacting an efficient and data-driven grid-enabled workflow. We consider complex data-intensive applications for which data grids have been developed and that benefit from a workflow management system to handle the computations involved.
We are especially targeting application workflows including several successive steps of significant duration and made up from generic components. We are moreover focusing on data-intensive appli-cations which are characterized by the iteration of the same workflow on many input data sets. This kind of application can be found in the medical imaging field, where applications processing large image databases through a complete sequence of generic treatments are very common [1].
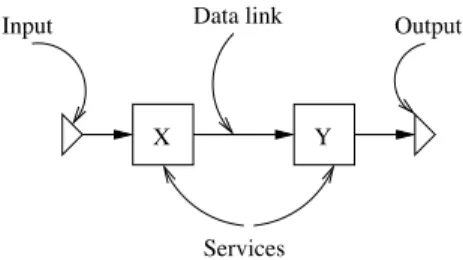
In this paper, we consider that a workflow is a set of services interconnected with data dependency
links. We are referring to the service-based approach
of workflow composition that is briefly described in section II. A service in this sense is a logical processing unit, implemented by a specific data processing algorithm, through which input data are
transformed into output data. Figure 1 presents the graphical notations we use in the rest of the paper. The target infrastructure for this work is a grid of standard personal computers interconnected by a high bandwidth network and managed through a super-batch scheduler such as the EGEE grid infrastructure1. Earlier work has shown that it is possible to operate a Web-Services based workflow processing unit on top of such an infrastructure [2] but that optimal performances for data-intensive applications cannot be obtained without taking into account the data parallelism inherent to this kind of application into the scheduling policy.
We show that current technologies only partially address these requirements and we propose new methods for optimizing the workflow execution under the above assumptions by exploiting the data parallelism. Some performance results on a real data-intensive medical imaging application are shown.
Section II presents related work about workflow management systems in the e-Science field. Sec-tions III and IV detail why and how to exploit parallelism in a workflow in order to optimize its execution on a grid infrastructure. In section V, we present an implementation of an optimized enactor prototype taking into account the points highlighted before. Section VI then presents experiments and our prototype performance results.
II. R
One can basically identify two approaches for workflow composition: the job-based approach and the service-based approach. These two approaches differ by the role of the workflow manager. A complete taxonomy of workflow managers for e-Science is presented in [3].
X Y
Input Data link Output
Services
Fig. 1. Graphical workflow notations used in the paper
A. Job-based approach
In the job-based approach, the workflow manager is responsible for the actual processing of data by programs on physical resources.
The job-based approach is very close to the grid infrastructure: in this approach, the workflow manager itself submits jobs to the grid. Thus, it allows the optimization of variables such as the job submission rate, the dispatch rate and the scheduling rate as detailed in [4].
DAGMan [5] is the emblematic workflow man-ager of the job based approach. A Direct Acyclic Graph (DAG) describes dependencies between Con-dor [6] jobs. A child node is started once all its parents have successfully completed. Among other workflow managers, the Pegasus system [7] is also based on this paradigm. It takes an abstract descrip-tion of a workflow (that can be constructed by using Chimera [8]) and finds the appropriate data and grid resources to execute the workflow. Other systems such as GRID superscalar [9] also identifies tasks from a sequential application including particular primitives in its code and manages their submission to a grid. The P-GRADE environment [10] also allows the creation, execution and monitoring of job-based workflows on various grid platforms.
B. Service-based approach
In the service-based approach, the workflow man-ager is responsible for the transmission of the data to distant services and for the collection of the results. The workflow manager is just aware of the interface of the programs and do not access the actual binary files. Jobs are submitted to the grid by the services. In this approach, the description of a workflow is made from the interface of the programs composing the workflow. This interface describes the inputs
and outputs of a program and informs the workflow manager of how to invoke the services. Among various standards of service interface description, the Web-Services Description Language [11] is nowadays widely used in workflow management systems.
The description of the dependencies between ser-vices is expressed with a language which must be able to describe all the required patterns needed to build the workflow. A complete survey of such workflow patterns is presented in [12]. Many work-flow description languages emerged from the e-Business field during the last few years and led to standardization efforts still in progress [13] [14]. In the e-Science field, initiatives tended to propose less exhaustive but simpler languages on the basis of data dependencies. Examples of such languages are the Simple Concept Unified Flow Language (Scufl) [15] and the Modeling Markup Language (MoML) [16].
Various service-based workflow management sys-tems have been proposed in the e-Science field. Among them, the Kepler system [16][17] targets many application areas from gene promoter iden-tification to mineral classification. It can orchestrate standard Web-Services linked with both data and control dependencies and implements various ex-ecution strategies. The Taverna project [15], from the myGrid e-Science UK project2 targets bioin-formatics applications and is able to enact Web-Services and other components such as Soaplab services [18] and Biomoby ones. It implements high level tools for the workflow description such as the Feta semantic discovery engine [19]. Other work-flow systems such as Triana [20], from the GridLab project3, are decentralized and distribute several control units over different computing resources. This system implements two distribution policies, namely parallel and peer-to-peer. It has been applied to various scientific fields, such as gravitational waves searching [21] and galaxy visualization [20]. Recent work4 aims at deploying this system on the EGEE grid infrastructure.
Finally, at a higher level, describing a
work-2http://mygrid.org.uk 3http://www.gridlab.org 4https://gilda.ct.infn.it/
flow with the service-based approach may require to introduce a domain-specific ontology to facili-tate automatic format conversion and services fit-ting [22]. Such tools are integrated into the Taverna workbench [15]. Closely to our application field, an example of a neuroimaging ontology modeling is presented in [23].
C. Comparison of the two approaches
In the service-based approach, the workflow de-scription stipulates that a particular output of a program is to be linked to a particular input of another one. Thus, the iteration of such workflows on a number of input data sets is straightforward and does not require any rewriting of the workflow. For instance, the Taverna workbench uses so-called iter-ation strategies (described in section V-C) that are convenient to implement data-centric applications. On the contrary, in the job-based approach, data dependencies between programs are not explicitly described. Iterating a single workflow on many data sets thus requires to write specific jobs for each data set. Indeed, one job in the workflow exactly corresponds to one task to be submitted and computed on the grid and it cannot be instantiated with different data sets.
The service-based approach is more independent from the infrastructure than the job-based one be-cause the services themselves are responsible for the submission of jobs to the grid whereas it is the role of the workflow manager in the job-based approach. One of the consequences is that the service-based approach allows different services included in the same workflow to submit jobs on various types of grids. It also permits the composition of applica-tions including legacy code because the workflow manager do not even access the binary that would be executed on the grid. The service-based approach thus offers a lot of flexibility for the benefit of the user by making the sharing and reusing of generic components easier, which particularly suits to the kind of applications we are targeting.
The service-based approach is thus well-adapted to our assumptions described in section I. Never-theless, the service-based approach makes the opti-mization of the computations much more complex as the workflow manager is not in direct contact with the computation infrastructure(s).
2 P 1 P 3 P 0 D D1 D2 Input
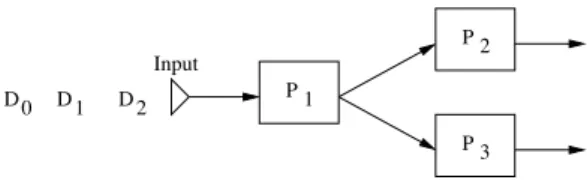
Fig. 2. A simple workflow example
The ultimate goal of this work is to optimize the execution of service-based workflows on the grid. We present here a first solution by exploiting parallelism inherent to the workflow itself, the data to process, and the services to execute.
III. P
A. Intrinsic workflow parallelism
The first trivial way of parallelism in a workflow deals with the intrinsic workflow patterns. It consists in allowing services to be enacted independently from each other when they are not linked by any kind of dependence. For example, if we consider the simple workflow pattern represented on figure 2, the service P2must be able to be enacted independently from the service P3. This kind of parallelism is implemented by the majority of workflow enactors today.
B. Data parallelism – multithreading
When considering data-intensive applications, several input data sets are to be processed according to the same workflow. Benefiting from the large number of resources available in a grid, workflow services can then be instantiated as several comput-ing tasks runncomput-ing on different hardware resources and processing different input data in parallel.
Multithreading denotes that a service is able
to process many data sets simultaneously with a minimal performance loss. This definition implies that multithreading can only be achieved efficiently on a multiprocessor infrastructure such as a grid. Indeed, even if the operating systems nowadays al-low simultaneous processings on a single processor, increasing the number of parallel tasks leads to a strong performance loss in this context.
Enabling multithreading implies, on the one hand, that the services are able to process many parallel connections and, on the other hand, that the work-flow engine is able to submit several simultaneous
queries to a service leading to the dynamic creation of several threads. Moreover, a multithreaded work-flow engine should implement a dedicated data man-agement system. Indeed, in case of a multithreaded execution, a data is able to overtake another one dur-ing the processdur-ing and this could lead to a causality problem, as we explained in [2]. To properly tackle this problem, data provenance has to be monitored during the multithreaded execution. Detailed work on data provenance can be found in [24].
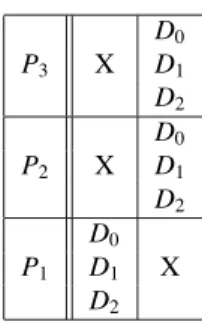
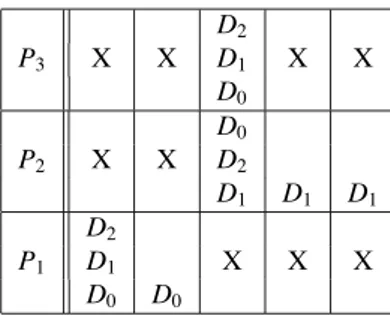
Consider the simple workflow made of 3 services and represented on figure 2. Suppose that we want to execute this workflow on 3 independent input data sets D0, D1 and D2. The multithreaded exe-cution diagram of this workflow is represented on figure 3. On this kind of diagrams, the abscissa axis represents time. When a data set Di appears on a
row corresponding to a service Pj, it means that
Di is being processed by Pj at the current time.
To facilitate legibility, we represented with the Di
notation the piece of data resulting from the pro-cessing of the initial input data set Di all along the
workflow. For example, in the diagram of figure 3, it is implicit that on the P2service row, D0 actually denotes the data resulting from the processing of the input data set D0 by P1. On those diagrams, we moreover made the assumption that the processing time of every data set by every service is constant, thus leading to cells of equal widths. Multithreading occurs when different data sets appear on a single square of the diagram whereas intrinsic workflow parallelism occurs when the same data set appears many times on different cells of the same column. Crosses represent idle cycles.
The Taverna workbench [15], for example, only implements a limited multithreading strategy. The user can specify a fixed number of threads limited
to 10. Such a limitation is clearly too low for a
data-intensive application benefiting of a data grid, and the number cannot be dynamically adjusted by the scheduler. In [2], we presented an asynchronous framework of invocation between Taverna and Web-Services, by splitting the services into a submission and a fetching service. These services are able to cope with this limitation. Nevertheless, it is clear that this problem can only properly be solved at the workflow enactor level.
D0 P3 X D1 D2 D0 P2 X D1 D2 D0 P1 D1 X D2
Fig. 3. Multithreaded execution diagram of the workflow of fi gure 2
C. Service parallelism – pipelining
Input data sets are likely to be independent from each other. This is for example the case when a single workflow is iterated in parallel on many input data sets. Thus, parallelism can also be highlighted at a service level in the workflow.
Pipelining denotes that the processing of two
different data sets by two different services are to-tally independent. A workflow enactor should allow pipelining of sequential tasks, in order to optimize the workflow execution.
Pipelining has been very successfully imple-mented in hardware processors to reduce the time spent during the completion of sequential instruc-tions. This model can be adapted to sequential parts of workflows. Consider again the simple workflow represented on figure 2, to be executed on the 3 independent input data sets D0, D1 and D2. Fig-ure 5 presents a pipelined execution diagram of this workflow whereas figure 4 displays an non pipelined one. We here supposed that a given service can only process a single data set at a given time (multithreading is disabled). On those diagrams, pipelining occurs when different data sets appear on different cells of the same column.
Here again, the Taverna workflow manager does not allow the pipelined execution of a workflow. Efforts have been done to cope with this limitation by developing specific services [25]. Nevertheless, pipelining has to be enabled by the workflow en-actor itself in order to be used with standard Web-Services that provide genericness and are thus par-ticularly adapted to our assumptions.
D. Data synchronization
Nevertheless, in some cases, different data sets need to be synchronized, in order to compute an
P3 X X X D0 D1 D2
P2 X X X D0 D1 D2
P1 D0 D1 D2 X X X
Fig. 4. Non pipelined execution diagram of the workflow of fi gure 2
P3 X D0 D1 D2
P2 X D0 D1 D2
P1 D0 D1 D2 X
Fig. 5. Pipelined execution diagram of the workflow of fi gure 2
operation on more than one data set. In such work-flow areas, a pipelined execution cannot be used and the engine must be aware of such synchronization services. An example of such a case occurs when one need to compute statistics such as the mean of all data. It is the case in workflows such as the Bronze-Standard medical image registration assess-ment application that we describe in section VI and in [2].
Figure 6 displays such a synchronization pattern. The service µ corresponds to a synchronization operation that needs to be executed on the whole data. We figured it with a double square in the diagram.
IV. I
In order to show how pipelining and multithread-ing influence the execution time of a workflow, we determine in this section the workflow execution times for a given execution policy.
A. Definitions and notations
• In the workflow, a path denotes a set of services linking an input to an output.
• The critical path of the workflow denotes the longest path in terms of execution time.
1 P 0 D D1 D2 P2 Input µ P2 X D0 D1 D2 X P1 D0 D1 D2 X X µ X X X X D0,D1,D2
Fig. 6. Example of a data synchronization pattern and its execution diagram
• nw denotes the number of services on the critical path of the workflow.
• nD denotes the number of data sets to be executed by the workflow.
• i denotes the index of the ith service of the
critical path of the workflow (i ∈ !0, nW−1").
Similarly j denotes the index of the jth data set
to be executed by the workflow ( j ∈ !0, nD−
1").
• Ti, j denotes the duration in seconds of the treatment of the data set j by the service i. • σi, j denotes the absolute time in seconds of
the end of the treatment of the data set j by the service i. The execution of the workflow is assumed to begin at t = 0. Thus σ0,0 =T0,0>0. • Σdenotes the total execution time of the
work-flow:
Σ =max
j<nD
(σnW−1, j) (1)
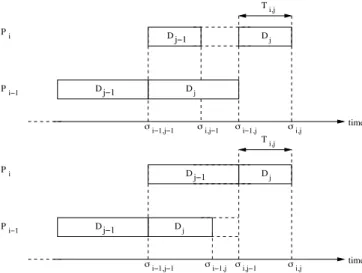
Notations are represented on figure 7.
B. Hypotheses
• The critical path is assumed not to depend on the data set. This hypothesis seems reasonable for most applications but may not hold in some cases as for example the one of workflows including algorithms containing optimization loops whose convergence time is likely to vary in an complex way w.r.t the nature of the input data set.
• Multithreading is assumed not to be limited by infrastructure constraints. We justify this hypothesis considering that our target infras-tructure is a grid, whose computing power is sufficient for our application.
• In this section, workflows are assumed not to contain any synchronization pattern (see section III-D for definition). Workflows con-taining such patterns may be viewed as two subworkflows respectively corresponding to the parts of the initial workflow preceding and succeeding the synchronization pattern (the synchronization pattern itself being included in the succeeding part). Execution times of those two subworkflows can be determined using the following expressions. The execution time of the global workflow will then correspond to
the sum of the execution times of the subwork-flows.
C. Execution times
Under those hypotheses, we can determine the ex-pression of the total execution time of the workflow for every execution policy:
• Case S: Sequential (pipelining and multithread-ing disabled): ΣS =! i<nW ! j<nD Ti, j (2)
• Case M: pipelining disabled and multithreading enabled: ΣM =! i<nW max j<nD " Ti, j # (3) • Case P: pipelining enabled and multithreading
disabled:
ΣP=TnW−1,nD−1+mnW−1,nD−1 (4) with: ∀i # 0 and ∀j # 0,
mi, j=max(Ti−1, j+mi−1, j,Ti, j−1+mi, j−1)
and: m0, j= ! k< j T0,k and mi,0= ! k<i Tk,0
• Case PM: pipelining enabled and multithread-ing enabled: ΣPM =max j<nD ! i<nW Ti, j (5) All the above expressions of the execution times can easily be shown recursively. Here is an example of such a proof for ΣP.
We first can write that, for a pipelined and non-multithreaded execution:
∀i # 0 and ∀ j # 0 :
σi, j= Ti, j+max(σi−1, j, σi, j−1) (6)
Indeed, if multithreading is disabled, data sets are processed one by one and service i has to wait for data set j − 1 being processed by service i before starting processing the data set j. This expression is illustrated by the two configurations displayed on figure 7. D j−1 D j−1 Dj Dj σi,j−1 i,j T i−1
σi−1,j−1 σi−1,j σi,j time i P P D j−1 Dj D j−1 Dj i−1
σi−1,j−1 σi,j time i σi,j−1 σi−1,j i,j T P P
Fig. 7. Two different confi gurations for an execution with pipelining enabled and multithreading disabled
We moreover note that service 0 is never idle until the last data set has been processed and thus:
σ0, j= !
k≤ j
T0,k (7)
Furthermore, D0 is sequentially processed by all services and thus:
σi,0 =
!
k≤i
Tk,0 (8)
We can then use the following lemma, whose proof is deferred to the end of the section:
Lemma IV.1
P(i, j) : σi, j=Ti, j+mi, j
with: ∀i # 0 and ∀ j # 0,
mi, j=max(Ti−1, j+mi−1, j,Ti, j−1+mi, j−1),
and:
m0, j=+k< jT0,k and mi,0 =+k<iTk,0
Moreover, we can deduce from equation 6 that for every non null integer j, σi, j > σi, j−1, which
Thus, according to lemma IV.1 ΣP = TnW−1,nD−1+mnW−1,nD−1
with: ∀i # 0 and ∀j # 0,
mi, j = max(Ti−1, j+mi−1, j,Ti, j−1+mi, j−1),
and: m0, j = ! k< j T0,k and: mi,0 = ! k<i Tk,0 “
Proof of lemma IV.1: The lemma can be shown via a double recurrence, first on i and then on j. Recursively w.r.t i:
• i=0: According to equation 7:
∀j < nD, σ0, j = ! k≤ j T0,k = T0, j+m0, j with m0, j = ! k< j T0,k ∀j < nD, P(0,j) is thus true.
• Suppose Hi: ∀ j < nD P(i,j) true. We are going to show recursively w.r.t j that Hi+1 is true:
– j=0: According to equation 8: σi+1,0 = ! k≤i+1 Tk,0 = Ti+1,0+mi+1,0 with mi+1,0 = ! k<i+1 Tk,0
Hi+1 is thus true for j = 0.
– Suppose Kj: Hi+1 is true for j. We are
going to show that Kj+1 is true.
According to equation 6: σi+1, j+1 = Ti+1, j+1+max(σi, j+1, σi+1, j)
Thus, according to Kj:
σi+1, j+1 = Ti+1, j+1
+max(σi, j+1,Ti+1, j+mi+1, j)
And, according to Hi: σi+1, j+1 = Ti+1, j+1+ max(Ti, j+1+mi, j+1, Ti+1, j+mi+1, j) nD−1 0 P ,..., D0 D
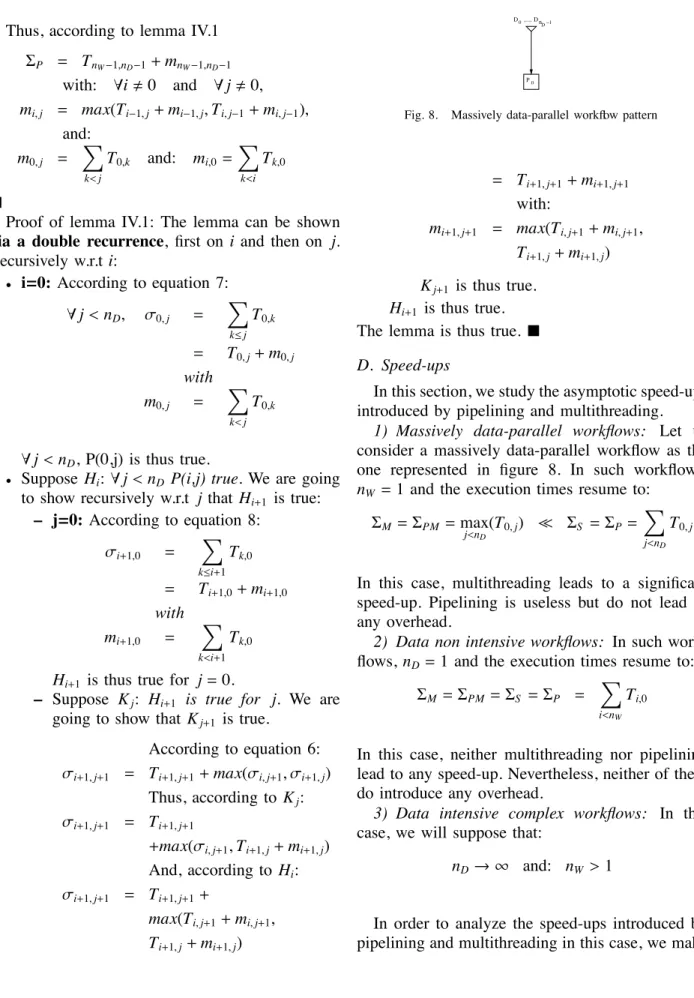
Fig. 8. Massively data-parallel workflow pattern
= Ti+1, j+1+mi+1, j+1
with:
mi+1, j+1 = max(Ti, j+1+mi, j+1,
Ti+1, j+mi+1, j)
Kj+1 is thus true.
Hi+1 is thus true.
The lemma is thus true. “
D. Speed-ups
In this section, we study the asymptotic speed-ups introduced by pipelining and multithreading.
1) Massively data-parallel workflows: Let us
consider a massively data-parallel workflow as the one represented in figure 8. In such workflows,
nW =1 and the execution times resume to:
ΣM = ΣPM =max j<nD (T0, j) $ ΣS = ΣP= ! j<nD T0, j
In this case, multithreading leads to a significant speed-up. Pipelining is useless but do not lead to any overhead.
2) Data non intensive workflows: In such
work-flows, nD=1 and the execution times resume to:
ΣM = ΣPM = ΣS = ΣP = !
i<nW
Ti,0
In this case, neither multithreading nor pipelining lead to any speed-up. Nevertheless, neither of them do introduce any overhead.
3) Data intensive complex workflows: In this
case, we will suppose that:
nD → ∞ and: nW >1
In order to analyze the speed-ups introduced by pipelining and multithreading in this case, we make
the simplifying assumption of constant execution times:
Ti, j=T (9)
In this case, the workflow execution times resume to:
ΣM = ΣPM = nW ×T
ΣS = nD×nW×T
ΣP = (nD+nW −1) × T
Those expressions can be checked on the execution diagrams of section III.
Pipelining do not lead to any speed-up in ad-dition to multithreading. However, we will see in section VI-D that T is hardly constant in production systems and that in this case the conclusion does not hold. Indeed, figures 9 and 10 illustrate on a simple example that pipelining do provide a speed-up even if multithreading is enabled, if the assumption of constant execution times is not done.
If multithreading is disabled, the induced speed-up is:
S = nD×nW
nD+nW −1
In case of data intensive workflows, this speed-up is significant. Indeed:
lim
nD→+∞
S = nW
Moreover, this speed-up is growing with the number of input data sets. Indeed:
dS
dnD
= nW.(nW −1) (nD+nW −1)2
(10) This derivative is always positive but decreases to zero when nD tends towards infinity. This speed-up
is thus smoothly growing with the number of input data sets.
We can conclude from this section that pipelining leads to a significant speed-up for the execution of a data-intensive complex workflow. This kind of workflow is the one targeted by our application. That is why we focus on the implementation of a workflow enactor that enables pipelining in the rest of the paper. D2 P3 X X D1 X X D0 D0 P2 X X D2 D1 D1 D1 D2 P1 D1 X X X D0 D0
Fig. 9. Multithreaded non pipelined execution diagram of the workflow of fi gure 2 with the assumption of variable execution times.
P3 X D1 X D2 D0 P2 X D2 D0 D1 D1 D1 D2 P1 D1 X X D0 D0
Fig. 10. Multithreaded pipelined execution diagram of the workflow of fi gure2 with the assumption of variable execution times. Compar-ing this diagram to the one of fi gure 9, one can see that pipelinCompar-ing do provide a speed-up even if multithreading is enabled if the execution times are not constant.
V. I
We implemented a prototype of a workflow enactor taking into account the 3 kinds of par-allelism we described in section III: intrinsic workflow parallelism, multithreading and pipelin-ing. Our hoMe-made OpTimisEd scUfl enac-toR (MOTEUR) prototype was implemented us-ing Java, in order to make it platform indepen-dent. It is available under CeCILL Public Li-cense (a GPL-compatible open source liLi-cense) at http://www.i3s.unice.fr/˜ glatard.
A. Workflow description language
This prototype is able to enact a workflow of standard Web-Services described with the Simple Concept Unified Flow Language (Scufl) used by the Taverna workbench [15]. This language is currently becoming a standard in the e-Science community.
Apart from describing the data links between the services, this language allows to define so-called coordination constraints. A coordination constraint is a control link which enforce an order of execution between to services even if there is no data depen-dency between them. We used those coordination
constraints to identify services that require data synchronization.
The Scufl language also specifies the number of threads of a service. In our case, this number is dynamically determined during the execution, with respect to the available input data of the service, so that we only consider that a service is multithreaded or not.
B. Input data description
We developed an XML-based language to be able to describe input data sets. This language aims at providing a file format to save and store the input data set in order to be able to re-execute workflows on the same data set. It simply describes each item of the different inputs of the workflow.
C. Enactor model
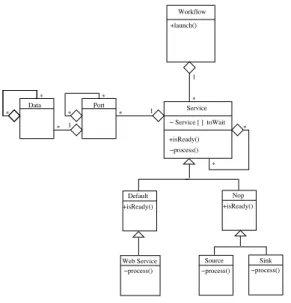
The UML class diagram of the prototype we implemented is represented on figure 14.
a) Data management: Services have input and
output ports. Each port has children ports, so that a service can convey data from its output ports directly to the corresponding children ports, without going via the central workflow entity.
Data also has parents and children data: when a new data is produced by a service, it is appended to each piece of data that was used to produce it. Thus, this provides a basic mechanism to retrieve data provenance of a result at the end of the workflow ex-ecution by going back in the data tree. Handling data provenance is particularly crucial in multithreaded workflows, as we explained in section III-B.
The Scufl language specifies so-called iteration
strategies to handle input data of the services. An
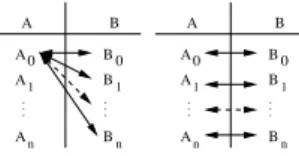
iteration strategy is a composition of two kinds of binary operators, cross product and dot product. Let us consider two inputs A and B of a service P, each of them being instantiated by a fixed number of data sets: A0, A1,. . . , An for input A and B0, B1,. . . , Bm
for input B. If the iteration strategy of this service P is a cross product, then P will process each Ai with
every Bj (i < n and j < m), thus leading to n × m
computations. Conversely, if the iteration strategy of
P is a dot product, then P will process each Ai with
the corresponding Bi, thus leading to n computations
(one must then have n = m and i < n) (cf. figure 11 for details). .. . . . . A B A A A 0 1 n B 0 B1 Bn .. . . . . A B A A A 0 1 n B 0 B1 Bn
Fig. 11. Action of the cross product (left) and dot product (right) operators on the input data
P0 P1 P2 3 2 0 1 , ( ) P1IB,JB ) ( P1IB JA ( , ) P1IAJA ( , ) P1IAJB 0 1 3 2 P0(IA,JA) P0(IA,JB) P0(IB,JB) P0(IB,JA) JA IA 0 0 1 1 IB JB P0(IA,JA) P0(IA,JB)P1(IA,JB) P0(IB,JB)P1(IB,JB) P0(IB,JA)P1(IBJA) P2( P2( P2( P2( 0 1 2 3 ( , ) P1IAJA , , , , , ) ) ) )
Fig. 12. Example illustrating the need for a unique identifi cation of data sets in a multithreaded workflow: services P0and P1 compute
cross products on their input data whereas service P2computes a dot
product. Without any appropriate numbering (represented in dotted
lines cells here), P2 may not process the right dot product because
P0and P1 are multithreaded and produce their result in a different
order. Pi(I, J) denotes the result of the processing of data sets I and
J by service Pi
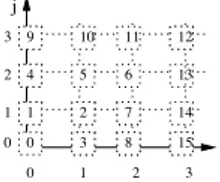
Handling iteration strategies in a multithreaded pipelined workflow is not straightforward because produced data sets have to be uniquely identified. Indeed they are likely to be computed in a different order in every service, which could lead to wrong dot product computations, as figure 12 illustrates. Moreover, due to pipelining, several data sets are processed concurrently and one cannot number all the produced data once computations completed. Thus, we use the following bijective function f to number the data produced bycross products:
f : ! × ! → !
(i, j) (→k2+k + i − j
where k = max(i, j)
This function is injective, which guarantee the uniqueness of the numbering. Here is the proof of
the injectivity of f . We first can note that for every integer n, there is a unique integer kn such as:
k2n≤n < (kn+1)2 (11)
Moreover it is obvious that:
∀(x, y) ∈ !2, k2≤ f (x, y) < (k + 1)2 (12) with k = max(x, y)
Suppose that we have (x0,y0) and (x1,y1) two pairs of integers such as f (x0,y0) = f (x1,y1). We are going to show that (x0,y0) = (x1,y1). Let k0 =
max(x0,y0) and k1 = max(x1,y1). According to
equation 12, we have:
k0≤ f (x0,y0) < (k0+1)2 and
k1 ≤ f (x1,y1) < (k1+1)2
Moreover, according to equation 11, there is a unique integer k such as:
k2≤ f (x
0,y0) = f (x1,y1) < (k + 1)2
Thus, given the uniqueness of k, we have k0=k1=
k. We then have:
(k = x0 OR k = y0) AND (k = x1 OR k = y1) This leads to 4 distinct cases:
1) k = x0 AND k = x1: Thus: k2+k + k − y 0 = k2+k + k − y1 and y0=y1. 2) k = y0 AND k = y1: As well as case 0, x0=x1. 3) k = x0 AND k = y1: Thus: x1+y0=2k
Finally: x1=y0 =k because y0≤k and x1≤
k.
4) k = x1 AND k = y0:
As well as case 3, x0+y1=2k and x0=y1=k because x0≤k and y1 ≤k.
We thus have (x0,y0) = (x1,y1) for each of those cases. “
Actually, this function corresponds to the num-bering of !2 displayed on figure 13. This function is also surjective (and thus bijective) as it can be intuited from figure 13.
0 1 2 3 0 1 2 3 4 5 6 7 8 9 10 11 12 13 15 14 0 1 2 3 i j
Fig. 13. Numbering used to label the data in the workflow. The values of f are displayed in the cells.
b) Services enactment: A workflow contains a
list of services and is responsible for their enactment (process() method on the UML diagram of fig-ure 14), so that the execution control is centralized in a single entity. The workflow queries services to check whether they are ready to be enacted (isReady() method on figure 14). Services answer depending on the data available in their input ports and on the status of the elements of the toWait attribute.
This attribute aims at enabling data synchroniza-tion, as explained in section III-D. In the imple-mented enactment strategy, a service will wait for every service S in the toWait array and recursively for every ancestor of S to be inactive before starting. This implementation of data synchronization is lim-ited but suitable for our application as we will see in section VI. Other kinds of synchronization could of course be defined, to impose services to wait for a particular piece of data produced by its parents, taking into consideration the data-tree described in the previous paragraph. However, this would require to be able to express such synchronization strategies with the Scufl language, which is not the case yet since only a single kind of so-called coordination constraint is available.
Sources and sinks are particular ”Nop” services which do not process anything and just convey data from their single input port to their single output port.
VI. E
A. Application
We made experiments considering a medical imaging rigid registration application. Medical im-age registration consists in searching a transforma-tion (that is to say 6 parameters in the rigid case – 3 rotation angles and 3 translation parameters)
Port Workflow Data Web Service +isReady() −process() * 1 1 * * * * * * 1 * Default Nop Source Sink +launch() +isReady() +isReady()
−process() −process() −process() * Service − Service [ ] toWait
Fig. 14. UML diagram of the prototype we implemented
between two images, so that the first one (the float-ing image) can superimpose on the second one (the reference image) in a common 3D frame. Medical image registration algorithms are a key component of medical imaging workflows.
The application we are working on aims at assess-ing registration results with a statistical approach called the Bronze-Standard [26]. The goal is basi-cally to compute the registration of a maximum of image pairs with a maximum number of registration algorithms so that we obtain a largely overestimated system to relate the geometry of all the images. As a consequence, the mean registration should be more precise and is called a bronze-standard. It implies that we are first able to process registrations of many pairs of images, which is a data-intensive problem. The workflow of our application is represented on figure 15. The two inputs referenceImage and floatingImage correspond to the image sets on which the evaluation is to be processed. The first registration algorithm is crestMatch. Its result is used to initialize the other registra-tion algorithms which are Baladin, Yasmina and PFMatchICP/PFRegister. crestLines is a pre-processing step. Then, the formatConversion and writeResults services are executed locally and aim at recording the results in a suitable for-mat. Finally, the MultiTransfoTest service is responsible for the evaluation of the accuracy of
the registration algorithms, leading to the outputs values of the workflow. This evaluation considers means computed on all the results of the regis-tration services except one that we specify and evaluates the accuracy of the specified method. Thus, the MultiTransfoTest service has to be synchronized: it must be enacted once every of its ancestor is inactive. This is why we figured it with a double square on figure 15.
As detailed in section VI-C, we made experi-ments on two different infrastructures: a local one, made of 4 PCs and the EGEE grid one. Corre-sponding workflows are both identical, except that a getFromEGEEservice has been added on the EGEE workflow, in order to download results from the grid
at the end of the registration procedures. Other steps
in the workflow do not need such a service because data transfers within the grid are handled by the grid middleware itself.
B. Data
Input image pairs are taken from a database of injected T1 brain MRIs from the cancer treatment center ”Centre Antoine Lacassagne” in Nice, France (courtesy of Dr Pierre-Yves Bondiau). All images are 256×256×60 and coded on 16 bits, thus leading to a 7.8 MB size per image (approximately 2.3 MB when compressed).
getFromEGEE formatConversion writeResults getFromEGEE getFromEGEE formatConversion writeResults PFRegister getFromEGEE formatConversion writeResults PFMatchICP MultiTransfoTest MethodToTest referenceImage floatingImage Yasmina Baladin formatConversion writeResults accuracy_rotation accuracy_translation crestMatch crestLines
Fig. 15. Workflow of the application
C. Experimental terms
We made experiments in order to evaluate the rel-evance of our prototype on two different infrastruc-tures. These infrastructures correspond to different parallelism conditions. On each infrastructure, we measured the workflow execution time for various numbers of input data sets.
We first deployed our application on an local
in-frastructure, where a single monoprocessor machine
is dedicated to each registration algorithm. Intrinsic workflow parallelism and pipelining do make sense on this infrastructure, whereas multithreading does not. Indeed, in case of multithreading, multiple instances of a service would be executed on a single physical processor, which would not lead to any execution speed-up.
We also deployed the application on the grid
infrastructure provided by the EGEE European
project. The platform offered is a pool of thousands computing (standard PCs) and storage resources
accessible through the LCG2 middleware5. The re-sources are assembled in computing centers, each of them running its internal batch scheduler. Jobs are submitted from a user interface to a central Resource Broker which distributes them to the available re-sources. Not only intrinsic workflow parallelism and pipelining but also multithreading make sense on such a grid infrastructure. Indeed, every instance of a service will be submitted to the grid and thus executed on a different processor.
In both cases, we compared execution times with and without pipelining. We used our MOTEUR for the pipelined case and for the non pipelined case, we used the Freefluo6 enactor, which is the one included into the Taverna workbench. Because of a limitation of this workbench, the number of threads was limited to 10 with this enactor.
For each of the above infrastructures, we executed our workflow on 3 inputs data sets, corresponding to
5http://lcg-web.cern.ch
the registration of 12, 66 and 126 image pairs from the database described in section VI-B. These inputs data sets correspond respectively to images from 1, 7 and 25 patients on which acquisitions have been done at several time points to monitor the growth of brain tumors. Each of the input image pair was registered with the 4 algorithms, thus respectively leading to 48, 264 and 504 registrations.
D. Results
1) Evaluation of our MOTEUR on the local in-frastructure: Table I displays the comparison
be-tween the execution times obtained with Taverna and our MOTEUR on the local infrastructure w.r.t the number of input data sets. Spdenotes the
speed-up introduced by the pipeline strategy implemented in our prototype. On this infrastructure, our proto-type introduces an average speed-up of 1.74 w.r.t the execution with Taverna. This speed-up is smoothly growing with the number of input data sets, as predicted by equation 10.
Moreover, one can notice on figure 16 that ex-ecution times are a linear function of the size of the input data set on this local infrastructure. This function is a straight line because of the nature of the workflow which iterates the same computations on each data set. It tends towards zero when nD
tends towards zero thanks to the low latency of the local infrastructure.
2) Evaluation of our MOTEUR on the EGEE infrastructure: Table II displays the comparison
between the execution times obtained with Taverna and our MOTEUR on the EGEE infrastructure w.r.t the number of input data sets. On this infrastructure, our MOTEUR introduces an average speed-up of 2.03 w.r.t the execution with Taverna. This speed-up is growing with the number of input data sets.
Section IV-D predicted a speed-up of 1 for our prototype on such a multithreaded environment. This is not the case here. It can be explained by the fact that the hypothesis of constant execution times (cf. equation 9) may not be verified here because of the highly variable nature of the grid environ-ment. Indeed, on a production grid infrastructure such as the EGEE one, the multi-users system is permanently under unpredictable load. Thus, a few jobs are likely to remain blocked for a while on a particular area of the system (such as a waiting
0 10000 20000 30000 40000 50000 60000 70000 80000 0 20 40 60 80 100 120 140 Execution time (s)
Number of input image pairs
Taverna-local MOTEUR-local
Fig. 16. Execution times of MOTEUR vs Taverna on the local
infrastructure
queue), whereas other ones are faster to execute. And even if their proportion remains reasonable, “outlier” jobs can be very late with respect to the faster ones, thus leading to a high variability of execution times among jobs and consequently to a strong delay of the workflow if the execution is not pipelined. Future work [27] will try to model this variability in order to cope with it.
We can also clearly notice on figure 17 that the extrapolation of those curves would not give a zero value for nD=0. This can be explained by the high
latency introduced by the grid. The consequences of this latency can be viewed on figures 18 and 19. We can clearly see on those figures that with Taverna as well as with our MOTEUR, our application is slowed down by the execution on the EGEE grid for low numbers of input data.
More measures remains to be done in order to present statistics concerning execution times on this infrastructure instead of just one experimental result. This is part of our future work.
We can thus conclude from those results that our MOTEUR is particularly suitable for executions of data-intensive applications in grid environments.
VII. C
We designed a complete prototype of an opti-mized workflow enactor that provides significant speed-up for the execution of data-intensive work-flows on a grid infrastructure. The implemented prototype is able to deal with existing standard workflows and services description languages. It benefits from computation parallelization at differ-ent levels (inherdiffer-ent to the workflow, data parallelism
Input Data Execution times (s)
Number of input Number of Pipelining disabled Pipelining enabled SP
image pairs registration (Taverna) (MOTEUR)
12 48 6789s 4160s 1.63 66 264 36217s 20457s 1.77 126 504 71095s 38816s 1.83
TABLE I
E ( )
Input Data Execution times (s)
Image pairs Registrations Pipelining disabled Pipelining enabled SP
number number (Taverna) (MOTEUR)
12 48 9959s 5906s 1.69 66 264 20073s 9922s 2.02 126 504 33662s 14220s 2.37 TABLE II E (EGEE ) 0 5000 10000 15000 20000 25000 30000 35000 0 20 40 60 80 100 120 140 Execution time (s)
Number of input image pairs
Taverna-EGEE MOTEUR-EGEE
Fig. 17. Execution times of MOTEUR vs Taverna on the EGEE
infrastructure 0 10000 20000 30000 40000 50000 60000 70000 80000 0 20 40 60 80 100 120 140 Execution time (s)
Number of input image pairs
Taverna-local Taverna-EGEE
Fig. 18. Execution times of Taverna on EGEE vs on the local infrastructure. One can see that for less than 20 input image pairs, the latency of the EGEE infrastructure slows down the execution.
0 5000 10000 15000 20000 25000 30000 35000 40000 0 20 40 60 80 100 120 140 Execution time (s)
Number of input image pairs
MOTEUR-local MOTEUR-EGEE
Fig. 19. Execution times of MOTEUR on EGEE vs on the local infrastructure. One can see that for less than 20 input image pairs, the latency of the EGEE infrastructure slows down the execution.
and processing parallelism) in order to exploit the resources available on grid infrastructures better than most existing implementations. The modeling of the overall execution times demonstrates that in different scenarios, the workflow manager does never lead to performance drops and that it is particularly efficient for dealing with data-intensive applications. This is confirmed by an experiment on a medical image registration application.
We have plans for further optimizing the work-flow engine. To take into account the limited amount of resources really available we plan to study dy-namic multithreading by adapting the number of
threads of a service to the current status of (i) the target grid infrastructure and (ii) the workflow execution. This would require to be able to monitor the status of the grid and to predict the services execution time on the infrastructure. By doing that, we plan to propose strategies to avoid pipeline draining during the workflow execution.
VIII. A
This work is partially funded by the
French research program “ACI-Masse de
donn´ees” (http://acimd.labri.fr/), AGIR project (http://www.aci-agir.org/). We are grateful to the EGEE European project for providing the grid infrastructure and user assistance.
R
[1] J. Montagnat, V. Breton, and I. Magnin, “Partitionning medical image databases for content-based queries on a grid,” Methods
of Information in Medicine (MIM), vol. 44, no. 2, pp. 154–160,
2005.
[2] T. Glatard, J. Montagnat, and X. Pennec, “Grid-enabled work-flows for data intensive medical applications,” in Computer
Based Medical Systems (CBMS’05), special track on Grids for Biomedicine and Bioinformatics, June 2005.
[3] J. Yu and R. Buyya, “A taxonomy of workflow manage-ment systems for grid computing,” tech. rep., Grid Computing and Distributed Systems Laboratory, University of Melbourne, 2005.
[4] G. Singh, K. Kesselman, and E. Deelman, “Optimizing grid-based workflow execution,” in HPDC’05, 2005.
[5] http://www.cs.wisc.edu/condor/dagman/.
[6] D. Thain, T. Tannenbaum, and M. Livny, “Distributed com-puting in practice: The condor experience,” Concurrency and
Computation: Practice and Experience, 2004.
[7] E. Deelman, J. Blythe, Y. Gil, C. Kesselman, and G. Mehta et al, “Mapping abstract complex workflows onto grid environments,”
Jnl of Grid Comp., vol. 1, no. 1, pp. 9 – 23, 2003.
[8] I. Foster, J. Voeckler, M. Wilde, and Y. Zhao, “Chimera: A virtual data system for representing, querying and automating data derivation,” in Sc. and Stat. DB Managmt, (Edinburgh, Scotland), 2002.
[9] R. M. Badia, J. Labarta, R. Sirvent, J. M. Prez, J. M. Cela, and R. Grima, “Programming grid applications with grid su-perscalar,” Journal of Grid Computing, 2004.
[10] P. Kacsuk, G. Dzsa, J. Kovcs, R. Lovas, N. Podhorszki, Z. Bala-ton, and G. Gombs, “P-grade: A grid programing environment,”
Journal of Grid Computing, vol. 1, no. 2, pp. 171–197, 2004.
[11] W3C, “Web services description language (wsdl) 1.1,” Mar. 2001. http://www.w3.org/TR/wsdl.
[12] W. Van Der Aalst, A. Ter Hofstede, B. Kiepuszewski, and A. Barros, “Workflow patterns,” Distributed and Parallel
Databases, vol. 14, pp. 5–51, July 2003.
[13] B. Systems, IBM, Microsoft, S. AG, and S. Systems, “Business process execution language for web-services – version 1.1,” May 2003. http://www-128.ibm.com/developerworks/library/specifi cation/ws-bpel/.
[14] W3C, “Web-services choreography description language work-ing draft,” Dec. 2004. http://www.w3.org/TR/ws-cdl-10. [15] T. Oinn, M. Addis, J. Ferris, D. Marvin, M. Greenwood,
T. Carver, A. Wipat, and P. Li, “Taverna : A tool for the com-position and enactment of bioinformatics workflows,”
Bioinfor-matics journal, 2004. http://taverna.sourceforge.net/.
[16] B. Ludascher, I. Altintas, C. Berkley, D. Higgins, E. Jaeger-Frank, M. Jones, E. Lee, J. Tao, and Y. Zhao, “Scientifi c workflow management and the kepler system,” Concurrency
and Computation: Practice and Experience, Special Issue on Scientifi c Workflows, to appear, 2005.
[17] I. Altintas, C. Berkley, E. Jaeger, M. Jones, B. Ludaescher, and S. Mock, “Kepler : Towards a grid-enabled system for scientifi c workflows,” in GGF10, Mar. 2004.
[18] M. Senger, P. Rice, and T. Oinn, “Soaplab - a unifi ed sesame door to analysis tool,” in UK e-Science All Hands Meeting (S. J. Cox, ed.), pp. 509–513, Sept. 2003.
[19] P. Lord, P. Alper, C. Wroe, and C. Goble, “Feta: A light-wieght architecture for user oriented semantic service discovery,” in
European Semantic Web Conference, 2005. Accepted for Publication.
[20] I. Taylor, M. Shields, I. Wang, and R. Philp, “Grid enabling applications using triana,” in Grid App. and Pro. Tools, GGF8, (Seattle, USA), June 2003.
[21] D. Churches, M. Shields, I. Taylor, and I. Wand, “A parallel implementation of the inspiral search algorithm using triana,” in Proceedings of the UK e-Science All Hands Meeting, (Not-tingham, UK), Sept. 2003.
[22] D. Hull, R. Stevens, P. Lord, C. Wroe, and C. Goble, “Treating shimantic web syndrome with ontologies,” in First AKT
work-shop on Semantic Web Services (AKT-SWS04), vol. 122, (The
Open University, Milton Keynes, UK), Dec. 2004.
[23] B. Gibaud, M. Dojat, F. Aubry, H. Benali, O. Dameron, S. Kinkingnhun, J. Matsumoto, M. Plgrini-Issac, R. Valabrgue, and C. Barillot, “Towards an Ontology for Sharing Neuroimag-ing Data and ProcessNeuroimag-ing Tools: Experience Learned from the Development of a Demonstrator,” in DiDaMIC’04 Workshop.
Satellite of the MICCAI conference (St-Malo, 26-29 September 2004) (M. Dojat and M. Gibaud, eds.), (Rennes), pp. 15–23,
September 2004.
[24] J. Zhao, C. Goble, R. Stevens, D. Quan, and M. Greenwood, “Using semantic web technologies for representing e-science provenance,” in Third International Semantic Web Conference
(ISWC2004) (S.-V. LNCS, ed.), (Hiroshima, Japan), pp. 92–
106, Nov. 2004.
[25] J. Blower, K. Haines, and E. Llewellin, “Data streaming, workflow and fi rewall-friendly grid services with styx,” in
UK e-Science All Hands Meeting, held in conjunction with Supercomputing, (Seattle, USA), Nov. 2005.
[26] S. Nicolau, X. Pennec, L. Soler, and N. Ayache, “Evaluation of a new 3d/2d registration criterion for liver radio-frequencies guided by augmented reality,” in Intl. Symp. on Surgery Sim.
and Soft Tissue Model., (Juan-les-Pins, France), pp. 270–283,
2003.
[27] T. Glatard, J. Montagnat, and X. Pennec, “Probabilistic and dynamic optimization of job partitioning on a grid infrastruc-ture,” in 14th euromicro conference on Parallel, Distributed and
network-based Processing (PDP’06), (Montbeliard-Sochaux,