Copyright © 2005 Inderscience Enterprises Ltd.
Water desalination price from recent performances:
modelling, simulation and analysis
M. Metaiche*
Architecture department, Bechar University, BP 417 Bechar, Algeria Fax: +213-(0) 49- 81-52-44 E-mail: [email protected]
* Corresponding author
A. Kettab
Research Laboratory of Water Science, National Polytechnic School – Algiers, Algeria E-mail: [email protected]
Abstract: The subject of the present article is the technical simulation of
seawater desalination, by a one stage reverse osmosis system, the objectives of which are the recent valuation of cost price through the use of new membrane and permeator performances, the use of new means of simulation and modelling of desalination parameters, and show the main parameters influencing the cost price.
We have taken as the simulation example the Seawater Desalting centre of Djannet (Boumerdes, Algeria).
The present performances allow water desalting at a price of 0.5 $/m3, which is
an interesting and promising price, corresponding with the very acceptable water product quality, in the order of 269 ppm.
It is important to run the desalting systems by reverse osmosis under high pressure, resulting in further decrease of the desalting cost and the production of good quality water. Aberration in choice of functioning conditions produces high prices and unacceptable quality. However there exists the possibility of decreasing the price by decreasing the requirement on the product quality. The seawater temperature has an effect on the cost price and quality. The installation of big desalting centres, contributes to the decrease in prices. A very important, long and tedious calculation is effected, which is impossible to conduct without programming and informatics tools.
The use of the simulation model has been much efficient in the design of desalination centres that can perform at very improved prices.
Keywords: desalination; reverse osmosis; recent performances; price; quality;
simulation.
Reference to this paper should be made as follows: Metaiche, M. and
Kettab, A. (2005) ‘Water desalination price from recent performances: modelling, simulation and analysis’, Int. J. Nuclear Desalination, Vol. 1, No. 4, pp.456–465.
Biographical notes: el-Mehdi Metaiche is currently pursuing a Doctor’s
degree in ‘modelling, simulation and optimisation of RO desalination systems’ at the National Polytechnic School of Algiers (Algeria). He is also conducting research at the Water Sciences laboratory, and is a teacher at the Hydraulics Department of Bechar University, Algeria. He is the author of some calculation codes in desalination and water domains in general, as well as some of the physical models and teaching mimeographs, His interests are modelling, simulation, numerical computation and computer programming in systems desalination domain.
Ahmed Kettab is a professor and Director of the Water Sciences Research Laboratory at the National Polytechnic School of Algiers (Algeria). He is also an international expert and member of the French Academy of Water, a member of the Water World Council and the coordinator for a Mediterranean group on water in the context of a Mediterranean network of engineering schools and universities (RMEI). He has to his credit more than 300 publications in the specialised recognised journals and various other international communications.
1 Introduction
The water resources shortage is a pointed problem, especially in arid and semi arid regions, where, the resorting to conventional processes remains in most cases, limited and inefficient. The adoption of non-conventional processes, especially desalination, forms an adequate solution in this case.
Among the plural desalination techniques, the reverse osmosis systems take an important place: a world’s capacity for production in increase without stop, a central’s number amount from year to other, the components variety (membranes specially) more varied, the performances always ameliorated and the costs tendency to the fall.
The only factor preventing the wide use of desalination techniques is the price obstacle, which remains high as compared to other means of water supply and mobilisation. This price depends on a number of important parameters, and its value depends on the choice.
The objective of this study is a recent valuation and price analysis, realised upon a simulation model for desalination parameters.
The study is based on the technique simulation, and the modelling of the total costs for desalination through:
• recent performances through the use of membranes and permeators, offered by the industry
• the use of new means of simulation and modelling for systems product (permeator production, MFRC, pressure drop, quality)
• putting in evidence, the main parameters influencing the price and their behaviour • last, this study concerns only the seawater desalting systems by reverse osmosis in
2 Means and methods
The present study is a numerical simulation work.
The mathematical model used for the production parameters’ valuation of desalting system is the one we have elaborated previously in the article “Modélisation Mathématique des Paramètres de Dessalement par Osmose Inverse Mono Etage” (Metaiche and Kettab, 2003), and the one we have partially exposed in the article “ Contribution à la Modélisation du Prix de Revient de l’Eau Dessalée par un Système d’Osmose Inverse Mono Etage” published in the Proceeding of Water International Colloquium (Chlef, Algeria) (Metaiche, Kettab and Bengueddache, 2002). The investment costs valuation is effected according to the Wade model (Wade, 1987). A computer programme is being written, in Pascal language, to automate the computations and simulate the functioning.
To facilitate and confirm the simulation result with the different computations, we have to write an computer programme using the Excel software (worksheet), including 26 columns: seven for introducing the seawater quality, product pressure, total system capacity, the needed conversion, feed pressure, seawater temperature and the permeator production in standard conditions.
The other 19 columns were reserved for the feed-reject medium concentration, the different terms of pressure, the correction factors of pressure and temperature, the membrane flux retention coefficient, the permeator production, the permeator numbers, the power consumption, the product quality, the different costs and cost price finally.
The valuation of the membrane flux retention coefficient MFRC, is effected from the mathematical model that we have elaborated and published in the article “contribution à la modélisation du facteur de correction de flux de rétention de la membrane MFRC de dessalement de l’eau de mer, cas des modules B-10”, which was published in the Desalination Journal (Metaiche, Kettab and Bengueddache, 2003).
For effect of the study of cost price variation: we suggest the conversions varying from 10% to 60% with steps of 0.5%, the feed pressure vary from 800 Psi (5,517 MPa) to 1200 Psi (8, 28 MPa) with steps of 50 Psi.
The quality control, for product water, it effected from the Total Dissolved Solids (TDS), with fixing a limit for product water quality by: TDS ≤ 500 ppm. This limit characterises the good drinking water from shcoeller (Tambo, 1991), the limit of drinking water quality from “US.PHS Standards” Norm (Rodier, 1996), and the desired quality from many researcher (Actes du séminaire international sur la technologie appropriée à la déminéralisation de l’eau potable, 1986; Oussedik, 2000).
We have taken as example for simulation: the Cap Djannet seawater central (Boumerdes, Algeria), of which, the capacity is 1.000.000 gallon/day (≈ 4.000 m3/d), the seawater salt is 37.927 ppm, and seawater medium temperature is 19°C (Papiers internes du SONALGAZ, 1997).
The permeators used, are B-10 Twin: 6880T type, characterised by a standard production of 16.000 gallon/d, and a salt reject rate for 99.55% (Permasep Products Engineering Manual, 1992; Guide général des Produits pour Osmose Inverse, 1994). The unitary price of permeators is 9512 $ (Price-list Permasep B-10 permeators, 1998), and the power price is 0.6 $/KWH (Zubaidi, 1989; Malek, Hawlader and Ho, 1996).
To put the effect scale in clearness, we have tested the systems with different dimensions: 4.000 m3/d, 40.000 m3/d and 400.000 m3/d, for evaluation of: optimal cost price, the product quality, the optimal conversion, and the necessary permeators number.
3 Results and discussions
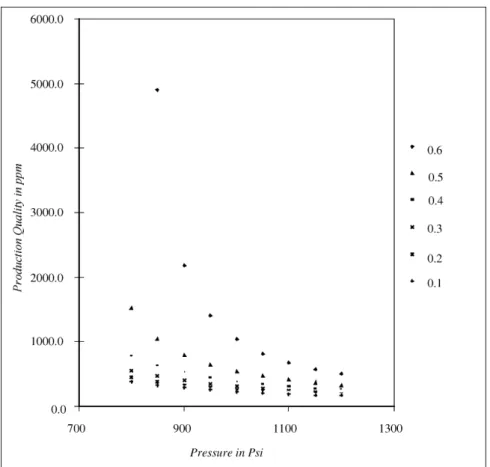
With a constant conversion, the best product water quality is always obtained with a maximum pressure. The feed pressure decrease, provokes the quality decrease (increase of salt concentration for product water), see Figure 1.
Figure 1 Variation of production quality with pressure for different conversions
It is the same for the permeators number to install in desalting system, where the increase of feed pressure, increases the permeator production and decreases the necessary permeators number.
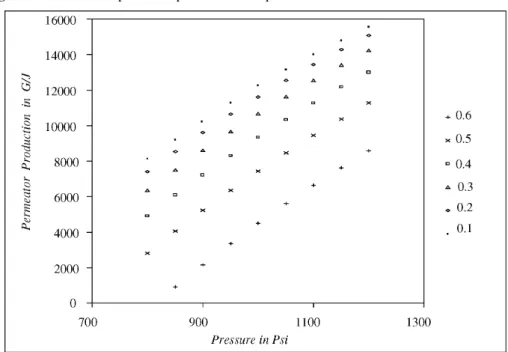
It’s the same too with a constant pressure, the system conversion increase provokes the permeator production increase and afterwards the decrease of permeators number, see Figures 2 and 3.
Figure 2 Variation of permeator production with pressure for different conversions
Figure 3 Variation of permeators number with pressure for different conversions
The system power consumption, decreases obviously with the feed pressure decrease for a constant conversion as showed in Figure 4.
Figure 4 Variation of power consumption with pressure for different conversions
The product water price increase when, decreasing the system feed pressure for a fixed conversion, see Figure 5.
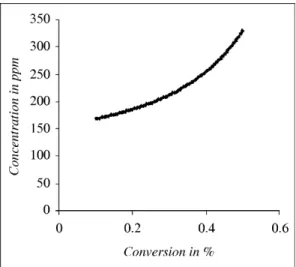
The more optimal desalted water price, is in the order of 0,5044 $/m3, it is obtained running the system with a conversion in the order of 42.5% under a pressure of 1200 Psi (8274 KPa): maximum pressure at which, the permeators can support (B-10 Permasep* Permeators Factors Influencing Performance: Bulletin 2020, 1994; Seawater RO System Design with Permasep* Permeators: Bulletin 2030, 1994). Water product concentration under these conditions is 269,0 ppm (see Figure 6), which widely acceptable, knew that the norm require a concentration lower than 500 ppm (Tambo, 1991; Jean Rodier, 1996; Actes du séminaire international sur la technologie appropriée à la déminéralisation de l’eau potable, 1986, Oussedik, 2000).
Other results to indicate for a given value of function pressure, the increase of system conversion, provoke the decrease of production quality (concentration decrease) and at the same time, the decrease of product quality (tow objectives contradictory senses), see Figures 6 and 7. That we show as for a pressure value of 1200 Psi (8274 KPa), a conversion of 10% produce a water containing 168,4 ppm as salt at a price of 0,73 $/m3, and a conversion of 50% produce a water containing 330,1 ppm for a price of 0,512 $/m3.
Figure 6 Variation of product quality with conversion at P = 1200 Psi
It is important to choose between a low conversion which gives a very high price and a more good quality, or the high conversion which gives a less high price with a less good quality.
The seasonal temperature variation, provokes a significant change in the optimal cost price, which can reach 7.4% between seawater at 25°C and seawater at 5°C, see Figure 8. The corresponding optimal conversion set between 41% and 43%.
Figure 8 Variation of optimal price with seawater temperature
The scale effect is very evident too: the increase of desalting centre capacity, involves a decrease in the cost price. The expansion of central capacity for ten (10) times, involves the decrease of optimal cost price for 22.84%, see Figure 9, obtained with a maximum pressure (1200 Psi) and a conversion for 38.5%, producing water with a quality for 246.5 ppm and require 756 permeators. A capacity expansion for one hundred (100) times, involves a cost price decrease for 35.76%, see Figure 9, obtained under maximum pressure and a conversion for 35%, producing a water at a quality for 230.5 ppm, and requiring 7310 permeators.
4 Conclusions
The current performances existing in membrane and permeators (modules) domain of reverse osmosis (permeability, selectivity, price, resistance…), allow producing the desalting water at a price for 0.5 $/m3, which is an interesting and promising price, corresponding to the very acceptable quality of product water, which is in the order of 269 ppm.
It is important to operate the reverse osmosis systems under the maximum pressure, because the high pressure allow to more decrease the cost of desalination, and permit to produce the water with good quality. The optimal conversions are set between 35% and 45%.
The pressure and conversion choice must be fixed correctly, to obtain the desalting water at a low price, when the aberration on this choice conducts to the high prices and even to not acceptable water quality.
It existing also possibility to more lower the price, by decrease of the requirement on the product quality (because under the optimal conditions: the quality of produced water, represent only 53.8% of authorised limit: 500 ppm). The price lowering in this case to be made either by installation of di stages systems, or using the recycling technique: blend the water at high quality for higher price with the water at lower quality for lower price.
It is primordial to take into consideration the seasonal variation of cost price begeted by seawater temperature variation.
The installation of big centrals, favour by its turn the decrease of desalting costs. A very important, long and dull calculation is effected, when it’s impossible that conduct without the informatique tool and programming.
The use of the simulation model has been very useful and efficient when, the use of this model for design of desalination centrals, can conduct to very improved prices.
References
Actes du séminaire international sur la technologie appropriée à la déminéralisation de l’eau potable (1986) Déminéralisation des eaux saumâtres par électrodialyse, Algiers (Algérie). Du Pont Company (1994) B-10 Permasep* Permeators Factors Influencing Performance: Bulletin
2020.
Guide général des Produits pour Osmose Inverse (1994) Du Pont Company. Jean Rodier (1996) Analyse de l’eau, 8th édition, Dunod Edition, Paris.
Malek, A., Hawlader, M.N.A. and Ho, J.C. (1996) ‘Design and economics of RO seawater desalination’, Desalination, Vol. 105.
Metaiche, M. and Kettab, A. and Bengueddache B. (2003) ‘article accepted by the scientific committee of PERMEA, Slovakia and submitted to Desalination’, Modélisation
Mathématique des Paramètres de Dessalement par Osmose inverse Mono Etagé, Journal.
Metaiche, M., Kettab, A.and Bengueddache, B. (2002) ‘Contribution à la modélisation du prix de revient de l’eau dessalée par un système d’osmose inverse mono Etagé, Actes du colloque
international sur l’eau, Chlef (Algeria), February.
Metaiche, M., Kettab, A.and Bengueddache, B. (2003) ‘Contribution à la modélisation du facteur de correction de flux de rétention de la membrane ‘MFRC’ de dessalement de l’eau de mer : cas des modules B-10’, Desalination Journal, Vol. 156, pp.255–258.
Oussedik, S.M. (2000) ‘déminéralisation de l’eau saumâtre du forage Albien ‘Ain Sahara’ pour l’alimentation en eau potable de la ville de Touggourt’, Desalination, Vol. 137.
Papiers internes du SONALGAZ (1997) Direction de l’Engenering’, Gui de Constantine, Algiers, Algeria.
Permasep Products Engineering Manual (1992) Du Pont Company. Price-list Permasep B-10 permeators (1998) Polysep Industrial Consultants.
Seawater RO System Design with Permasep* Permeators: Bulletin 2030 (1994) Du Pont Company.
Tambo, N. (1991) Water Supply Engineering, Water purification system, Japan International Cooperation Agency, vol. 2.
Wade, N.M. (1987) RO Design Optimization, Desalination, Vol. 64, No. 3.
Zubaidi, A.A.J.Al (1989) ‘Parametric Cost Analysis Study of Seawater Reverse Osmosis Systems Design in Kuwait’, Desalination, Vol. 76.