HAL Id: hal-01054469
https://hal.archives-ouvertes.fr/hal-01054469
Submitted on 21 Mar 2017HAL is a multi-disciplinary open access archive for the deposit and dissemination of sci-entific research documents, whether they are pub-lished or not. The documents may come from teaching and research institutions in France or abroad, or from public or private research centers.
L’archive ouverte pluridisciplinaire HAL, est destinée au dépôt et à la diffusion de documents scientifiques de niveau recherche, publiés ou non, émanant des établissements d’enseignement et de recherche français ou étrangers, des laboratoires publics ou privés.
L. cvs GrenachexSyrah) reveals inconsistencies
betweenmaintenance of daytime leaf water potential and
response of transpiration rate under drought
Aude Coupel-Ledru, Eric Lebon, Angélique Christophe, Agnes Doligez,
Llorenç Cabrera Bosquet, Philippe Péchier, Philippe Hamard, Patrice This,
Thierry Simonneau
To cite this version:
Aude Coupel-Ledru, Eric Lebon, Angélique Christophe, Agnes Doligez, Llorenç Cabrera Bosquet, et al.. Genetic variation in a grapevine progeny (Vitis vinifera L. cvs GrenachexSyrah) reveals in-consistencies betweenmaintenance of daytime leaf water potential and response of transpiration rate under drought. Journal of Experimental Botany, Oxford University Press (OUP), 2014, 65 (21), 14 p. �10.1093/jxb/eru228�. �hal-01054469�
Version preprint
Journal of Experimental Botany doi:10.1093/jxb/eru228
This paper is available online free of all access charges (see http://jxb.oxfordjournals.org/open_access.html for further details)
ReseaRch PaPeR
Genetic variation in a grapevine progeny (Vitis vinifera
L. cvs Grenache×Syrah) reveals inconsistencies between
maintenance of daytime leaf water potential and response of
transpiration rate under drought
Aude Coupel-Ledru1, Éric Lebon1, Angélique Christophe1, Agnès Doligez2, Llorenç Cabrera-Bosquet1,
Philippe Péchier1, Philippe Hamard1, Patrice This2 and Thierry Simonneau1,*
1 INRA Laboratoire d’Ecophysiologie des Plantes sous Stress Environnementaux, Place Viala, F-34060 Montpellier Cedex 1, France 2 INRA UMR AGAP, Place Viala, F-34060 Montpellier Cedex 1, France
*To whom correspondence should be addressed. E-mail: simonnea@supagro.inra.fr Received 12 January 2014; Revised 14 April 2014; Accepted 22 April 2014
Abstract
In the face of water stress, plants evolved with different abilities to limit the decrease in leaf water potential, notably in the daytime (ΨM). So-called isohydric species efficiently maintain high ΨM, whereas anisohydric species cannot
prevent ΨM from dropping as soil water deficit develops. The genetic and physiological origins of these differences
in (an)isohydric behaviours remain to be clarified. This is of particular interest within species such as Vitis vinifera L. where continuous variation in the level of isohydry has been observed among cultivars. With this objective, a 2 year experiment was conducted on the pseudo-F1 progeny from a cross between the two widespread cultivars Syrah and
Grenache using a phenotyping platform coupled to a controlled-environment chamber. Potted plants of all the prog-eny were analysed for ΨM, transpiration rate, and soil-to-leaf hydraulic conductance, under both well-watered and
water deficit conditions. A high genetic variability was found for all the above traits. Four quantitative trait loci (QTLs) were detected for ΨM under water deficit conditions, and 28 other QTLs were detected for the different traits in either
condition. Genetic variation in ΨM maintenance under water deficit weakly correlated with drought-induced reduction
in transpiration rate in the progeny, and QTLs for both traits did not completely co-localize. This indicates that genetic variation in the control of ΨM under water deficit was not due simply to variation in transpiration sensitivity to soil
dry-ing. Possible origins of the diversity in (an)isohydric behaviours in grapevine are discussed on the basis of concurrent variations in soil-to-leaf hydraulic conductance and stomatal control of transpiration.
Key words: Anisohydric, drought, high-throughput phenotyping, hydraulic conductance, isohydric, leaf water potential, QTL,
transpiration rate, Vitis vinifera L.
Introduction
Soil water deficit (WD) represents the main environmental constraint for growth in grapevine (Vitis vinifera L.) and grape
production under Mediterranean conditions (Chaves et al.,
2010). When combined with high evaporative demand, soil
drying may result in a dramatic decrease in water potential in plant tissues. This can lead to catastrophic effects such as
cavitation in the xylem vessels (Zufferey et al., 2011), cessation
of water transport, stomatal closure, and carbon starvation,
which threaten plant survival (McDowell et al., 2008). Plants
have evolved various adaptive processes limiting a dramatic
decrease in leaf water potential in the daytime (ΨM) under
soil drought. As a result, contrasting controls of leaf water potential have been observed across species when submitted to
similar soil WD conditions (Tardieu and Simonneau, 1998).
© The Author 2014. Published by Oxford University Press on behalf of the Society for Experimental Biology.
This is an Open Access article distributed under the terms of the Creative Commons Attribution License (http://creativecommons.org/licenses/by/3.0/), which
at INRA Avignon on June 16, 2014
http://jxb.oxfordjournals.org/
Version preprint
So-called isohydric species, such as maize, efficiently
main-tain high ΨM when the soil dries, whereas anisohydric species,
such as sunflower, cannot prevent ΨM from dropping (Tardieu
et al., 1996). In several species including grapevine (Prieto
et al., 2010), genetically variable efficiency of ΨM maintenance
has been observed. Two widespread cultivars of grapevine, namely Grenache and Syrah, have been consistently described with different responses to soil WD. Grenache was shown to be near-isohydric, compared with Syrah which exhibited more
anisohydric behaviour (Schultz, 2003; Soar et al., 2006).
It has been proposed that the variation between isohydric and anisohydric behaviours mainly results from how stomatal pores at the leaf surface close under WD and control plant
transpiration (Buckley, 2005). With regard to this, stomatal
conductance to water vapour has been shown to decrease for milder soil WD in maize (isohydric) than in sunflower
(aniso-hydric) (Tardieu and Simonneau, 1998). The higher stomatal
sensitivity to WD in isohydric compared with anisohydric species could therefore be the cause of the more efficient
maintenance of ΨM. The drought-induced hormone
absci-sic acid, which triggers stomatal closure, was suspected to
be at the origin of this difference (Tardieu and Davies, 1992;
Borel et al., 1997; Tardieu and Simonneau, 1998). However, the physiological basis of this proposal has never been eluci-dated. Additionally, it has been contested that (an)isohydric behaviour was stable for a given genotype but could vary
sea-sonally (Franks et al., 2007; Chaves, 2010).
Plant hydraulic conductance (i.e. a plant’s capacity to
sup-ply soil water to the leaves) participates in determining ΨM
as it balances the impact of water losses. Variation in plant hydraulic conductance was therefore proposed to contribute,
concurrently with stomatal regulation, to the control of ΨM
under adverse conditions (Franks et al., 2007; Pantin et al.,
2013). Accordingly, ΨM should remain high in those plants
which could maintain high hydraulic conductance under soil drying. Conversely, vulnerability of the xylem pathway to embolism under drought most often causes a decrease in hydraulic conductance as observed in field-grown grapevine (Zufferey et al., 2011), thereby lowering ΨM and resulting in
anisohydric behaviour. This potential role of hydraulic con-ductance is supported by studies where different responses
of hydraulic conductivity in roots (Vandeleur et al., 2009) or
petioles (Schultz, 2003) between grapevine cultivars under
water stress have been related to their contrasted behaviours in terms of being isohydric or anisohydric.
The present study aims at elucidating whether and how vari-ation in (an)isohydric behaviour is genetically controlled. This was addressed using a quantitative trait locus (QTL) mapping
population consisting of the pseudo-F1 progeny obtained
from a reciprocal cross between the two cultivars Syrah and
Grenache. The range of genetic variation in ΨM observed in
the progeny under controlled transpiring conditions was quan-tified with either a well-irrigated regime or moderate soil WD
in pots. The genetic architecture underlying variation in ΨM
within the progeny was then examined by looking for genomic regions associated with the control of this trait using a QTL
approach. The transpiration rate and ΨM were characterized
in parallel in all the progeny, and the genetic architecture of
transpiration response to WD was similarly dissected. The physiological bases of isohydric versus anisohydric behaviours were discussed by matching correlations between traits to co-localizations between underlying QTLs.
Materials and methods
Plant material and treatments in the greenhouse
The plant material consisted of the pseudo-F1 progeny of 186 two-year-old genotypes obtained as the first generation from a reciprocal cross between the grapevine cultivars Syrah and Grenache (Adam-Blondon et al., 2004).
In February 2010, 20 clones of each offspring and the parents were grafted on 110 Richter rootstock (Vitis berlandieri×Vitis rupes-tris) and then cultivated outside with ferti-irrigation in 9 litre (0.19 m diameter, 0.4 m high) individual pots containing a 30:70 (v/v) mixture of a loamy soil and organic compost. Six clones of each offspring and the parents were selected as replicates during a first experiment in 2012 (1128 two-year-old plants). Five other replicates (clones) were studied in 2013 (940 three-year-old plants).
In each year of the experiment, potted plants were transferred for budburst to a first greenhouse and grown there for 1 month. They were individually weighed and irrigated twice a week so as to main-tain soil water content as non-limiting for growth (1.5 g of water per g of dry soil; see Supplementary Fig. S1 available at JXB online). All inflorescences and branches were removed in order to ensure full growth of one leafy axis per plant.
The plants were then transferred into the PhenoArch phenotyping platform located in another greenhouse where water treatments were imposed. Briefly, PhenoArch is based on a LemnaTec automated system (LemnaTec, Wüerselen, Germany) hosted at Montpellier, France (M3P; https://www6.montpellier.inra.fr/m3p/). Within this platform, soil water contents (SWCs) in pots were maintained at target values by daily watering of each pot using watering stations made up of weighing terminals with 1 g accuracy (ST-Ex, Bizerba, Balingen, Germany) and high-precision pump-watering stations (520U, Watson Marlow, Wilmington, MA, USA). For each geno-type (186 offspring plus two parents), well-watered (WW) replicates (three clones in 2012 and two in 2013) were maintained at 1.50 g of water per g of dry substrate. A moderate soil WD was imposed on three other replicates (clones) per genotype in each year, by restrict-ing irrigation until the SWC gradually reached 1.05 g g–1, and this level was maintained thereafter by daily watering for 1–3 d pend-ing hydraulic measurements. Target weights used for daily irriga-tion were calculated for each pot as the sum of the desired amount of water corresponding to target SWC and individual tares which were determined during pot filling (empty pot, dry soil) including individual plant biomasses which were re-estimated twice a week by image analysis (see below). The target SWC for WD treatment was reached on average 7 d after restricting irrigation (Fig. 1) which was not long enough to alter the plant leaf area of WD plants compared with WW plants (see below).
In 2012, mean air temperature and vapour pressure deficit (VPD) in the platform greenhouse were 21.4 °C and 1.38 kPa during the night and 25.6 °C and 2.16 kPa during the day, and the photosyn-thetic photon flux density (PPFD) during the light period averaged 290 μmol m–2 s–1. In 2013, cloudier conditions resulted in lower val-ues, with mean air temperature and VPD of 18.8 °C and 1.01 kPa during the night and 22.4 °C and 1.53 kPa during the day, with an average PPFD of 272 μmol m–2 s–1 during the light period.
Image acquisition and analysis
Plant RGB (1280 × 960) images taken from two horizontal, orthog-onal directions plus one top view were captured every 2 d for all plants during the night-time (3D Scanalyzer, LemnaTec, GmbH, Wüerselen, Germany). Images were analysed to separate plant
at INRA Avignon on June 16, 2014
http://jxb.oxfordjournals.org/
Version preprint
regions from background and used for estimating the whole plant leaf area (LA) and fresh biomass (BPlant) for each plant. Calibration curves were constructed using multiple linear regression models based on processed images taken in three directions against meas-urements of LA and BPlant. The LA calibration curve was obtained with all the individually scanned leaves of 50 plants of different genotypes and sizes in 2012 and 2013. Calibration curves for BPlant were obtained by weighing all progeny plants in 2012 and 625 in 2013 at harvest. Root mean square error of prediction (RMSE) was 0.031 m2 for LA and 10.7 g for BPlant (Supplementary Fig. S2 at JXB online).
Experimental design
The experimental design consisted of parallel blocks in the phe-notyping platform, and one clone of each genotype was randomly positioned within each block. Plant development was followed twice a week by counting the number of unfolded leaves. To eliminate uncontrolled plant size effects on water relations (Ambrose et al., 2009), hydraulic traits were measured at a similar mean develop-mental stage for the total progeny except for two replicates of WW plants in 2012 which were measured at slightly earlier stages there-fore resulting in smaller plants (LA=0.148 ± 0.046 m2 as a mean for these two replicates over the progeny) compared with all other repli-cates and treatments for which mean plant sizes (±SEs) were similar (LA=0.212 ± 0.065 m2 for WD plants in 2012; LA=0.242 ± 0.092 m2 for WW in 2013; and LA=0.238 ± 0.067 m2 for WD in 2013). Measurements of water relations in a controlled-environment chamber
Water potential and transpiration rate were measured under con-trolled transpiring conditions while plants were taken off the plat-form and placed in a controlled-environment chamber. Plant density in the chamber was reduced by one-third in 2013 compared with 2012 in order to facilitate sampling of exposed leaves. Plants were first submitted to a dark period with similar timing to that in the greenhouse (for ~12 h). Lights were then switched on for a mini-mum of 3 h before water potential measurements were performed.
Air temperature and relative humidity (RH) were measured every 30 s (HMP35A probe, Oy, Helsinki, Finland) and the temperature was set to an average of 27 °C during the day (20 °C during the night). VPD was controlled by manipulating RH and was main-tained at 2 ± 0.2 kPa during the light period. Light was provided in the chamber by a bank of sodium lamps that maintained the PPFD at ~480 μmol m–2 s–1 at the level where leaves were sampled.
Before being placed in the chamber, pots were bagged to prevent evaporation from the soil. Each pot was then weighed with 0.1 g accuracy (Sartorius balance, IB 34 EDEP, Gottingen, Germany) at the beginning of the light period and after a minimum of 6 h under constant light, temperature, and VPD conditions. Weight losses over the 6 h period were used to calculate average daytime transpiration rates on a whole plant (Tr) and a leaf area basis (TrS=Tr/LA, here-after called the specific transpiration rate). Weight losses and LA were corrected by the weight and surface area of the leaf that was sampled for water potential measurement.
For each plant, SWC (g water g–1 dry soil) was calculated using the weight (Wttotal) measured just before entering the controlled-environment chamber, corrected by the estimated plant biomass (Bplant), as:
SWC=
(
Wttotal–Bplant–Wtpot–Wtdry soil)
/Wtdry soilwith Wtpot the weight of the empty pot and Wtdry soil the weight of dry soil determined when plants were potted (2250 g on average). Error in the SWC was reduced to <0.8% (errors were ±10.7 g for Bplant and ±1 g for Wtdry soil, Wtpot, and Wttotal, resulting in <0.1% error for the denominator and <0.7% error for the numerator).
The soil water potential (Ψsoil) was then calculated for each plant using a calibration curve (Van Genuchten et al., 1980) previously established between SWC and Ψsoil using pre-dawn leaf water poten-tial determined under non-transpiring conditions on fully irrigated plants as a proxy for Ψsoil (Supplementary Fig. S3 at JXB online):
Ψsoil α sat SWC SWC = − −− − n n 11 n 1 10
with SWCsat=2, n=1.468, and α=0.258. Using this calibration curve, soil water potential could be estimated from SWC with an RMSE of 0.06 MPa (Supplementary Fig. S3 at JXB online). Pre-dawn leaf water potential was chosen as a proxy for Ψsoil since it incorpo-rates the influences of root distribution and distributed soil water potential in the pot on how the plant senses soil water availability. Further, calculation of water potential differences between tran-spiring leaves and soil (see below) was based on the same measure-ment technique.
The leaf water potential under transpiring conditions, as indica-tive of minimal daytime values (denoted ΨM), was measured on the plants in the controlled-environment chamber between 3 h and 4 h after lights were switched on, with up to six Scholander pressure chambers (Soil Moisture Equipment Corp., Santa Barbara, CA, USA) which were cross-calibrated using a distributed, pressurized nitrogen source. Measurements were performed on fully expanded, well-irradiated leaves, generally on the eighth phytomer from the apex. The drop in water potential between soil and transpiring leaves was calculated as:
∆ =Ψ
(
Ψsoil–ΨM)
Whole-plant (K) and specific (KS) soil-to-leaf hydraulic conduct-ance were then deduced using the conventional, evaporative flux method (Tsuda and Tyree, 2000) for the whole path from soil to transpiring leaves as:
K Tr= /∆Ψ Fig. 1. Evolution of soil water potential (Ψsoil) for potted grapevine
plantlets cultivated in the greenhouse under both well-watered (WW, black circles) and water deficit (WD, grey circles) treatments (means and SEs for two replicates of the 186 Syrah×Grenache offspring and the two parents studied in 2013). The dashed arrow shows the beginning of water restriction. The black and grey arrows show the day
of measurement of hydraulic traits, when Ψsoil was stabilized under both
scenarios.
at INRA Avignon on June 16, 2014
http://jxb.oxfordjournals.org/
Version preprint
and
KS TrS= /∆Ψ
The stability of the transpiration rate over the 6 h light period was verified in a preliminary experiment to ensure that Tr could be asso-ciated with the leaf water potential measured at any time during this period (Supplementary Fig. S4 at JXB online).
Statistical analyses
All statistical analyses were performed with R packages (R Development Core Team, 2012). Natural logarithm transforma-tion was applied when data distributransforma-tion deviated from normality (Shapiro–Wilk test; Royston, 1995). Single effects of year, water sce-nario, and genotype were first tested on all traits. Effects of water scenario and interaction with genotype were then tested within each year (2012 and 2013) by using the following analysis of variance (ANOVA) model: Pij=μ+Gi+Sj+Gi*Sj+eij, where Pij was the
pheno-typic value of genotype i in scenario j, μ the overall mean, Gi the
effect of genotype i, Sj the effect of scenario j, and eij the residual
error effect. The effect of year and interaction with genotype were tested within each scenario (WW and WD) using the same model, with Sj replaced by the effect of year Yj.
Further analyses were carried out on separate data sets (e.g. WD or WW, 2012 or 2013) to test for undesired effects (spatial position in the platform, date of measurement, and operator for leaf water potential measurement) by using one-way ANOVA models such as: Pi=μ+Xi+ei, with Xi an undesired effect, and ei the corresponding
residual.
For each trait, the Best Linear Unbiased Predictors (BLUPs) of genetic values were then estimated for use in QTL detection. Models selected were those with the lowest Bayesian Information Criterion, among several mixed models (Supplementary Table S1 at JXB online). The tested models always included a random gen-otypic effect, completed or not by fixed effects and interactions reported as significant in previous ANOVAs for each data set (water scenario×year, multiscenarios, multiyears, all years and scenarios). Pearson’s correlation coefficients between years or traits were calcu-lated on BLUPs of the genetic value.
Variance estimates of the selected models were used to estimate the broad-sense heritability (H2) as:
H2 G G R = + σ σ σ 2 2 2 n
where σ2G is the genetic variance, σ2R the residual variance, and n the number of replicates per genotype.
QTL detection
QTL detection was performed on elementary data sets (one water scenario within 1 year) as well as on multiscenario data sets (both scenarios in 1 year) and multiyear data sets (both years for one sce-nario). It was also performed on the whole data set considering the 11 clones of each genotype (six in 2012 and five in 2013) as replicates.
A framework linkage map was constructed using 153 simple sequence repeat (SSR) markers (Huang et al., 2012). QTL detection was performed on BLUPs with MapQTL 4.0 software (Van Ooijen and Maliepaard, 1996) using the consensus map which combined information from the two parents. Interval mapping was performed in combination with multiple QTL model mapping (Jansen, 1993; Jansen and Stam, 1994) as an equivalent of composite interval mapping. QTL significance was determined at the chromosome (PChr) and the genome-wide levels (PG) by calculating thresholds for the logarithm of odds (LOD) score through 1000 permutations (Churchill and Doerge, 1994). QTLs were declared significant when
detected at the whole-genome level (PG<0.05), or putative when only significant at the chromosome level (Pchr<0.05) (Abiola et al., 2003). The confidence interval for each QTL was calculated as the chromo-some region where the LOD score was higher than the maximum LOD score of the QTL minus 1.
Additive and dominance effects for the QTLs were calculated as described by Segura et al. (2007):
AS=1[(µad+µac) (− µbd+µbc)]/4
AG=1[(µac+µbc) (− µad+µbd)]/4
D=1[(µac+µbd) (− µbc+µad)]/4
with AS the additive effect associated with Syrah alleles, AG the addi-tive effect associated with Grenache alleles, D the dominance effect, and μbd, μbc, μac, and μad the phenotypic means corresponding to the
four possible combinations with a and b the alleles of Syrah, and c and d the alleles of Grenache.
Results
Mean effects of water treatments
All plants which were characterized in a controlled-envi-ronment chamber reached the desired soil water poten-tial corresponding to either WW or WD treatment with
high reproducibility between plants (the SE on Ψsoil was
<0.0014 MPa and 0.014 MPa for WW and WD plants,
respec-tively) and years (mean Ψsoil for all WD plants averaged
–0.154 ± 0.014 MPa in 2012 and –0.151 ± 0.005 MPa in 2013). WD treatment resulted in a highly significant decrease of all studied traits, with highly repeatable mean effects on
plants between years (Table 1, Fig. 2). Mean ΨM for all
meas-ured plants was substantially reduced from –0.66 MPa under
WW conditions to –0.94 MPa under WD treatment (Table 1,
Fig. 2). Specific transpiration rate (TrS) and specific hydrau-lic conductance (KS) were slightly but significantly higher in 2013 compared with 2012. In spite of this difference, reduc-tion induced by WD compared with WW condireduc-tions was of similar magnitude between years for mean KS, decreasing down to 43%, and mean TrS, which decreased down to 55% (Table 1, Fig.2).
Genetic variability within the progeny and comparison with parents
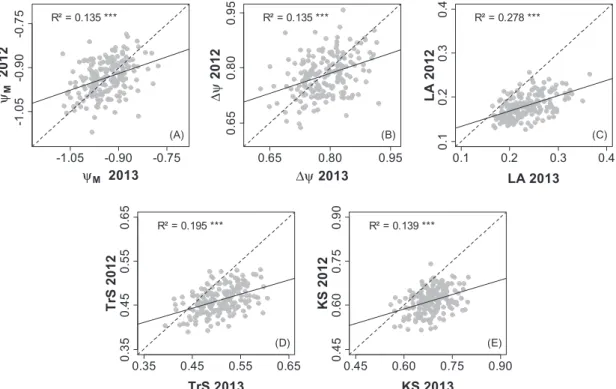
Mean genotypic values (BLUPs) were calculated using three replicates of each genotype submitted to the same treatment in each year (but only two for WW in 2013). Correlations between years were significant for each trait (as exemplified in Fig. 3 for WD) although with relatively low R2 values (0.06–
0.3), suggesting an interaction between genotypes and years. Parents were ranked in agreement with their previously
reported behaviours under WD, with higher ΨM in the
near-isohydric Grenache compared with the near-annear-isohydric
Syrah (Fig. 4A). However, the difference between parents was
rather weak compared with the range of variation observed among offspring.
at INRA Avignon on June 16, 2014
http://jxb.oxfordjournals.org/
Version preprint
ANOVA revealed highly significant effects of the
geno-type on ΨM under WD treatment but not under WW
treat-ment, where mean genotypic values for ΨM were maintained
between –0.78 MPa and –0.6 MPa (not shown). Segregation
of ΨM under WD treatment within the progeny was therefore
indicative of differences in (an)isohydric behaviours. Mean
genotypic value of ΨM under WD ranged from –0.79 MPa
in 2012 (–0.78 MPa in 2013), indicative of the most isohydric behaviour, to –1.12 MPa in 2012 (–1.07 MPa in 2013),
indica-tive of the most anisohydric response (Fig. 4A). Genetic
variability in (an)isohydric behaviours could also be
appreci-ated through the range of variation in the reduction of ΨM
induced by WD (Red_ΨM), going from –0.17 MPa for the
most isohydric offspring to –0.40 MPa for the most
anisohy-dric one (Fig. 4D). However, Red_ΨM was obtained as the
mean of only two values (one in each year; see the Materials
and methods), while mean genotypic ΨM was calculated
using three replicates in each year and was therefore preferred for assessing (an)isohydric behaviours.
A large and transgressive variability among offspring was also observed for both specific transpiration rate and specific
hydraulic conductance (Fig. 4B, C). Mean, genotypic
val-ues under WD conditions ranged from 0.24 mmol m–2 s–1 to
0.76 mmol m–2 s–1 for TrS and from 0.28 mmol m–2 s–1 MPa–1
to 1 mmol m–2 s–1 MPa–1 for KS.
The response of the transpiration rate to WD was ana-lysed by calculating for each genotype the reduction ratio of the specific transpiration rate induced by WD relative to WW conditions (denoted Red_TrS). Mean Red_TrS for 2012 and 2013 indicated that TrS was maintained at 66% of TrS observed under WW conditions in Grenache whereas it
decreased to 53% in Syrah (Fig. 4E). This surprisingly
disa-greed with most studies describing Grenache as more water conservative under drought than Syrah. However, in spite of severe down-regulation of transpiration under WD in Syrah,
TrS remained quite high (e.g. 0.56 mmol m–2 s–1 in
2012) com-pared with Grenache which was less affected by WD but
exhibited a limited transpiration rate (0.50 mmol m–2 s–1 in
2012; Fig 4B). Reduction of the transpiration rate under WD
also exhibited a wide range of variation among offspring far
beyond the values reported for the parents (Fig. 4E), with a
significant genotypic effect (Table 1). Interestingly, the genetic
variability observed for the reduction of hydraulic
conduct-ance induced by the WD (Red_KS; Fig. 4F) was of similar
magnitude to Red_TrS, with also higher reduction in Syrah (lower Red_KS) than in Grenache.
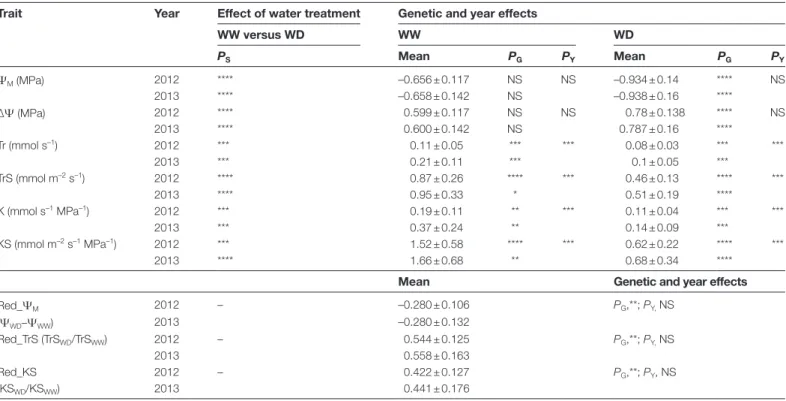
Table 1. Effects of treatment (WW, well-watered; WD, water deficit), genotype, and year on the main hydraulic traits measured in two years on the Syrah×Grenache mapping population (two parents+186 offspring) in a controlled-environment chamber
Trait Year Effect of water treatment Genetic and year effects
WW versus WD WW WD PS Mean PG PY Mean PG PY ΨM (MPa) 2012 **** –0.656 ± 0.117 NS NS –0.934 ± 0.14 **** NS 2013 **** –0.658 ± 0.142 NS –0.938 ± 0.16 **** ∆Ψ (MPa) 2012 **** 0.599 ± 0.117 NS NS 0.78 ± 0.138 **** NS 2013 **** 0.600 ± 0.142 NS 0.787 ± 0.16 **** Tr (mmol s–1) 2012 *** 0.11 ± 0.05 *** *** 0.08 ± 0.03 *** *** 2013 *** 0.21 ± 0.11 *** 0.1 ± 0.05 *** TrS (mmol m–2 s–1) 2012 **** 0.87 ± 0.26 **** *** 0.46 ± 0.13 **** *** 2013 **** 0.95 ± 0.33 * 0.51 ± 0.19 **** K (mmol s–1 MPa–1) 2012 *** 0.19 ± 0.11 ** *** 0.11 ± 0.04 *** *** 2013 *** 0.37 ± 0.24 ** 0.14 ± 0.09 *** KS (mmol m–2 s–1 MPa–1) 2012 *** 1.52 ± 0.58 **** *** 0.62 ± 0.22 **** *** 2013 **** 1.66 ± 0.68 ** 0.68 ± 0.34 ****
Mean Genetic and year effects
Red_ΨM 2012 – –0.280 ± 0.106 PG,**; PY, NS (ΨWD–ΨWW) 2013 –0.280 ± 0.132 Red_TrS (TrSWD/TrSWW) 2012 – 0.544 ± 0.125 PG,**; PY, NS 2013 0.558 ± 0.163 Red_KS 2012 – 0.422 ± 0.127 PG,**; PY, NS (KSWD/KSWW) 2013 0.441 ± 0.176
Means ±SD of 188 genotypic values determined on three clones of each genotype in each conditions, except WW in 2013 where two clones were measured.
Measured or derived traits were: ΨM, daytime leaf water potential; ∆Ψ, difference between soil water potential and ΨM; Tr, whole-plant
transpiration rate; TrS, specific transpiration rate (on a per unit leaf area basis); K, whole-plant hydraulic conductance; KS, specific hydraulic
conductance; Red_ΨM, decrease in genotypic ΨM from WW to WD conditions (a single value for each genotype in each year); Red_TrS and
Red_KS, the reduction ratio of TrS and KS, respectively. induced by WD relative to WW treatment (a single value for each genotype in each year).
The significance of water treatment (PS), genotype (PG), and year (PY) effects is indicated as follows: *P≤0.08; **P≤0.05; ***P≤0.01; ****P≤ 0.001;
NS, non-significant.
at INRA Avignon on June 16, 2014
http://jxb.oxfordjournals.org/
Version preprint
Correlations between traits (genotypic values) within the progeny
Relationships (Pearson’s correlation) between genotypic values (BLUPs) for all hydraulic-related traits were
ana-lysed in each year (Fig. 5). A significant effect of the
geno-type on LA was detected, indicating differences in vigour
among offspring (Table 1). When normalized by plant leaf
area, specific transpiration rate (TrS) measured under WD, as well as the reduction ratio Red_TrS, negatively
corre-lated with LA (Fig. 5). This indicated a trend for the most
vigorous genotypes to present the strongest reduction in transpiration rate and the lowest specific transpiration rate under WD.
It was examined whether genetic variation in ΨM
cor-related with genetic variation in transpiration rate under
WD. Results were very similar in both years (Fig. 5).
Correlation was weakly significant between mean
geno-typic values of ΨM and TrS and more significant between
ΨM and the reduction ratio of specific transpiration (Red_
TrS) calculated for each genotype. These correlations were positive, indicating that overall, genotypes with strongly
reduced TrS under WD (low Red_TrS) were those with the lowest (most negative) leaf water potential. A loose, but significant, negative correlation was also observed between
ΨM under soil WD and LA, suggesting that more
vigor-ous genotypes exhibited lower leaf water potential under WD in spite of stronger reduction in specific transpiration as indicated by the negative correlation between LA and
Red_TrS (Fig. 5).
Mixed models and heritability
The broad-sense heritability (H2) of hydraulic traits ranged
from 0 to 0.66 under the WW scenario and increased for
each trait under the WD scenario up to 0.43–0.68 (Table 2).
This indicated that soil drying amplified the genetic variabil-ity in hydraulic responses. For each trait, values calculated for both years were consistent. The whole-plant leaf area
showed the highest H2 for both years. Analysis of the whole
set of data combining the two years increased H2 values
for all traits (Table 2), suggesting a higher power for QTL
detection.
QTL analysis
QTL analysis of combined data for both years was carried out for each soil water condition. Twenty-two significant QTLs
(PG<0.05) were detected by multiyear analysis (indicated as
‘1213’ in Table 3 and Fig. 6) of all hydraulics-related traits,
although with some redundancy when QTLs were detected for those traits which were derived from others by
calcula-tion (such as for ∆Ψ or Red_ΨM as compared with ΨM). One
to four significant QTLs (PG<0.05) were identified per trait,
each accounting for 9–20% of total variance. The QTLs were located on eight chromosomes, but many co-localized on four linkage groups (LGs) (four on LG01, five on LG10, three on LG17, and four on LG18).
Four significant QTLs were detected for ΨM under WD
on LG1 (two QTLs), LG10, and LG18, and one of them
co-localized on LG18 with the QTL detected for Red_ΨM, both
traits being indicative of (an)isohydric behaviour. One sig-nificant QTL was also detected for TrS under WD on LG17. No significant QTL was detected for the reduction of specific transpiration rate (Red_TrS) induced by the WD relative to the WW scenario.
Single-year and single-water treatment analyses revealed
32 significant QTLs (PG<0.05). On average, 1–5 significant
QTLs were detected per trait, accounting for 8–20% of the total variance. Only one significant QTL was stable at the genome level in the two years (LA, on LG18). Nevertheless, for about half of the significant QTLs detected in the mul-tiyear analysis, a significant QTL at the same locus was detected at least in one year, combined with a putative QTL
(Pchr<0.05) for the other year (Table 3). These redundant
QTLs between years were not repeated in Fig. 6. In only
two cases, significant QTLs specifically detected in one year under one water scenario were not reported as significant or putative in the multiyear analysis (Tr WW and KS WD in
2012) (Table 3, Fig. 6).
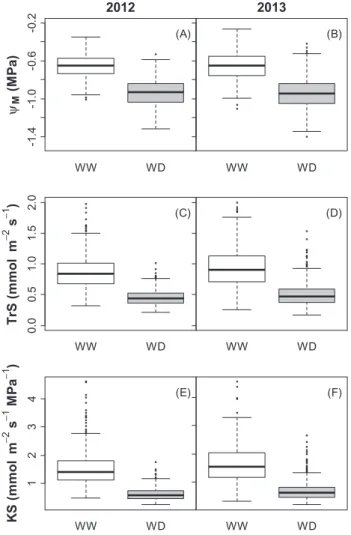
Fig. 2. Boxplots of hydraulic traits measured on each plant of the
Syrah×Grenache mapping population in 2012 (A, C, E) and 2013 (B, D, F), under well-watered (WW, white boxes) and water deficit (WD, grey boxes) treatments. See Table 1 for abbreviations (n=564 in all conditions except WW in 2012, where n=376).
at INRA Avignon on June 16, 2014
http://jxb.oxfordjournals.org/
Version preprint
Fig. 3. Comparison between 2012 and 2013 for mean genotypic values of hydraulics-related traits estimated under water deficit conditions for each
offspring of the Syrah×Grenache mapping population. See Table 1 for abbreviations (ΨM in MPa, ∆Ψ in MPa, TrS in mmol m–2 s–1, KS in mmol m–2
s–1 MPa–1, LA in m2). n=188 for each year and each trait. Pearson’s determination coefficients are given, with *** indicating high statistical significance
(P≤10–9). Regression lines are represented in black and bisecting lines in grey.
Fig. 4. Distributions of mean genotypic values (Best Linear Unbiased Predictions; BLUPs) for hydraulic traits measured on the Syrah×Grenache mapping
population. See Table 1 for abbreviations. For ΨM (A), TrS (B), and KS (C), distributions obtained under the water deficit treatment are presented for 2012
(black lines) and 2013 (grey lines) for the n=188 genotypes. For Red_ΨM (D), Red_TrS (E), and Red_KS (F), only one mean per genotype was obtained in
each year, and the black line represents the distribution of the BLUP extracted from the single means of the two years of the experiment. Values for the parents are indicated with black arrows (only for 2012 in A, B, and C for the sake of clarity).
at INRA Avignon on June 16, 2014
http://jxb.oxfordjournals.org/
Version preprint
Co-localizations of QTLs and clusters of interest
The different QTL analyses resulted in identification of genomic regions of particular interest, on LG01, LG02,
LG10, LG17, and LG18 (Fig 6). The multiyear QTLs detected
for ΨM tightly co-localized with QTLs for ∆Ψ (LG01, LG10,
and LG18), suggesting that both traits carried similar infor-mation. This is consistent with the similar control of soil water potential which was imposed on all genotypes so that
combining Ψsoil with ΨM in the calculation of ∆Ψ did not
introduce any substantial change in genetic architecture of these traits. A similar conclusion was obtained when
analys-ing the difference in ΨM between WW and WD conditions
(Red_ΨM) since genetic variation was not detected under
WW conditions in the multiyear analysis (Table 2). Regarding
WD conditions, only one co-localization between QTLs of
ΨM and specific transpiration rate (TrS) was detected on
LG10. In contrast, more co-localizations were found between QTLs of soil-to-leaf hydraulic conductance (KS) and TrS on LG01, and LG17. This could be due to the way in which KS was derived from TrS. However, some specific QTLs were also detected for KS and TrS which did not co-localize.
Finally, to examine possible genetic links between plant size and hydraulic traits, QTL detection was also performed on LA. Although this trait varied slightly among replicates with the date of measurement and between years (with larger
plants in 2013 compared with 2012, Fig. 3), QTLs were
detected, suggesting that genetic differences were conserved across lots of plants (blocks and years). Two QTLs were
detected in the main clusters of LG17 and LG18 (Fig. 6),
where they co-localized with QTLs for specific transpiration
rate or specific hydraulic conductance (Fig. 6).
Fig. 5. Binary relationships and Pearson’s correlation coefficients between hydraulic traits measured under the water deficit scenario on the
Syrah×Grenache mapping population. Upper right: biplots between variables measured in 2013 (grey dots). Lower left: biplots between variables
measured in 2012 (black dots). See Table 1 for abbreviations. ΨM in MPa, Red_ΨM in MPa, TrS in mmol m–2 s–1, Red_TrS dimensionless, LA in m2.
n=188 for each biplot. Pearson’s correlation coefficients are indicated with their statistical significance as follows: *P≤0.01; **P≤0.001.
at INRA Avignon on June 16, 2014
http://jxb.oxfordjournals.org/
Version preprint
Regarding the significant QTLs, the major effects weregen-erally additive, originating from Shiraz (AS) and/or Grenache
alleles (AG) and rarely associated with the dominance effect
(D). The main QTL found for LA originated from both
par-ents (Table 3).
Discussion
Phenotyping platforms facilitate the detection of genetic determinism of water relations
This is the first study where measurements of leaf water potential have been performed together with determination of the transpiration rate on all progeny from a cross. This work showed the benefit of using a phenotyping platform. By strictly controlling the individual soil water status through the daily weighing of pots, water shortage could be imposed on woody plants with good reproducibility between genotypes and years whatever the evaporative conditions and plant development. The platform also gave access to dynamic esti-mates of leaf area in a non-invasive way, which was essential in the determination of specific transpiration rates.
Furthermore, accurate control of atmospheric conditions in a growth chamber made it possible to characterize water relations of all the progeny for genetic analysis. Broad-sense heritability was quite high and consistent between years for
most traits. For the first time, the genetic architecture of leaf water potential was analysed in transpiring plants under WD, and 32 QTLs involved in the control of water relations were detected. This offered a unique context to dissect the genetic origin of leaf water homeostasis and to shed new light on possible mechanisms causing differences between iso- and anisohydric behaviours.
A genetic origin for (an)isohydric behaviours
Overall, the WD which was imposed in the present study on
potted grapevine plantlets significantly decreased ΨM
com-pared with WW conditions, but with a substantial range of variability within the progeny. As a major outcome, this
var-iability in ΨM under WD appeared to be largely determined
by the genotype. Genetic variability in ΨM under WW
con-ditions was not detected. Therefore, genetic variability in
ΨM under WD was indicative of the differences between
more isohydric (high ΨM under WD) and more
anisohy-dric (low ΨM under WD) behaviours. The wide range of
genetic variation observed in the progeny compared with the parents suggested that several heterozygous QTLs were borne by the parental lines and segregated within the prog-eny. These conditions were favourable for the detection of QTLs governing the complex genetic determinism of the studied traits.
It should be noted that ΨM primarily depends on both
soil WD and evaporative conditions, which were chosen as moderate in this study. The WD treatment corresponded to
a moderate decrease in Ψsoil (–0.15 MPa for all the progeny)
compared with non-irrigated field conditions where pre-dawn
leaf water potential (a proxy for Ψsoil) frequently decreases
down to –0.6 MPa (Prieto et al., 2010). Evaporative
condi-tions in the controlled environment chamber were also cho-sen as intermediate by setting the VPD close to 2 kPa which has been shown to trigger intermediate stomatal responses in
several species (Sinclair et al., 2008; Gholipoor et al., 2013;
Ocheltree et al., 2013), whereas a higher VPD induces severe
stomatal closure (Monteith, 1995). In the experiments carried
out here, the VPD was high enough to induce a genetically
variable reduction in transpiration rate (Fig.2, Table 1) and
thus, possibly, in ΨM, but not too excessive to avoid severe
limitations in the transpiration rate, which could have hin-dered the detection of genetic variation.
Genetic control of ΨM under stabilized evaporative and
soil WD conditions was confirmed by the detection of sev-eral underlying QTLs on the consensus map. Four QTLs
for ΨM under WD were detected in the multiyear analysis,
each one explaining at least 11% of total variability. QTLs
detected for ΨM under WD were most often highly
signifi-cant in one year and putative in the other year. Difference between parental cultivars was modest and was dramatically transgressed within the progeny. This result is consistent with
previous studies (Prieto et al., 2010; Pou et al., 2012), showing
that the (an)isohydric reputations of Grenache and Syrah can be considered as overstated as compared with other cultivars. This also indicates possible genetic gains as regards leaf water homeostasis under drought.
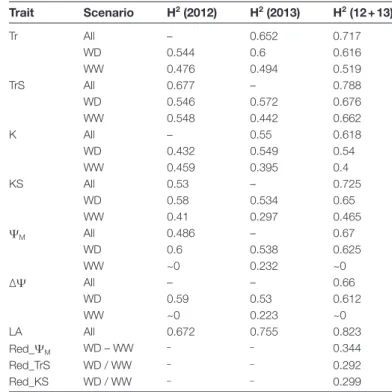
Table 2. Broad sense heritability (H2) of the main hydraulic traits
(abbreviations as in Table 1) and leaf area (LA) measured on the Syrah×Grenache mapping population under the well-watered (WW) or water deficit (WD) scenario
Trait Scenario H2 (2012) H2 (2013) H2 (12 + 13) Tr All – 0.652 0.717 WD 0.544 0.6 0.616 WW 0.476 0.494 0.519 TrS All 0.677 – 0.788 WD 0.546 0.572 0.676 WW 0.548 0.442 0.662 K All – 0.55 0.618 WD 0.432 0.549 0.54 WW 0.459 0.395 0.4 KS All 0.53 – 0.725 WD 0.58 0.534 0.65 WW 0.41 0.297 0.465 ΨM All 0.486 – 0.67 WD 0.6 0.538 0.625 WW ~0 0.232 ~0 ∆Ψ All – – 0.66 WD 0.59 0.53 0.612 WW ~0 0.223 ~0 LA All 0.672 0.755 0.823 Red_ΨM WD – WW – – 0.344 Red_TrS WD / WW – – 0.292 Red_KS WD / WW – – 0.299 Heritability was calculated from genotypic and residual variances obtained by fitting mixed linear models, respectively, for the WW and WD scenarios, and for the multiscenario data sets (‘all’) when genotype×scenario interaction was significant.
at INRA Avignon on June 16, 2014
http://jxb.oxfordjournals.org/
Version preprint
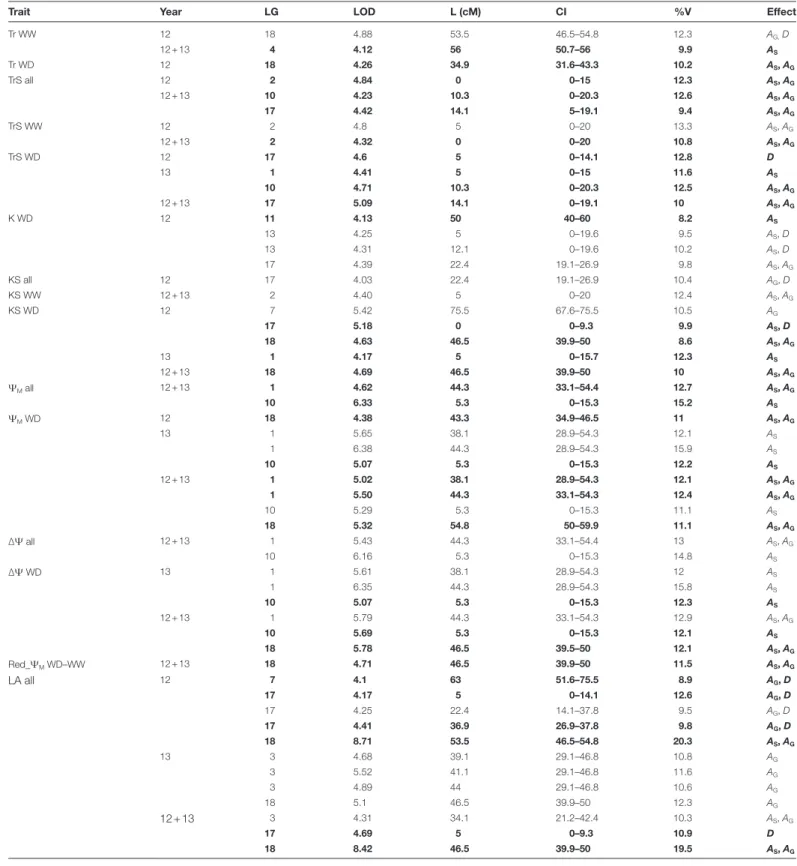
Table 3. Significant quantitative trait loci (QTLs) detected on the consensus map of the Syrah×Grenache mapping population for the hydraulics-related traits (abbreviations as in Table 1) and leaf area (LA)
Results of multiyear (‘12 + 13’) and single-year (‘12’ and ‘13’) analyses are presented for well-watered (WW) and water deficit (WD) scenarios, and for the multiscenario data sets (‘all’)
Trait Year LG LOD L (cM) CI %V Effect
Tr WW 12 18 4.88 53.5 46.5–54.8 12.3 AG, D 12 + 13 4 4.12 56 50.7–56 9.9 AS Tr WD 12 18 4.26 34.9 31.6–43.3 10.2 AS, AG TrS all 12 2 4.84 0 0–15 12.3 AS, AG 12 + 13 10 4.23 10.3 0–20.3 12.6 AS, AG 17 4.42 14.1 5–19.1 9.4 AS, AG TrS WW 12 2 4.8 5 0–20 13.3 AS, AG 12 + 13 2 4.32 0 0–20 10.8 AS, AG TrS WD 12 17 4.6 5 0–14.1 12.8 D 13 1 4.41 5 0–15 11.6 AS 10 4.71 10.3 0–20.3 12.5 AS, AG 12 + 13 17 5.09 14.1 0–19.1 10 AS, AG K WD 12 11 4.13 50 40–60 8.2 AS 13 4.25 5 0–19.6 9.5 AS, D 13 4.31 12.1 0–19.6 10.2 AS, D 17 4.39 22.4 19.1–26.9 9.8 AS, AG KS all 12 17 4.03 22.4 19.1–26.9 10.4 AG, D KS WW 12 + 13 2 4.40 5 0–20 12.4 AS, AG KS WD 12 7 5.42 75.5 67.6–75.5 10.5 AG 17 5.18 0 0–9.3 9.9 AS, D 18 4.63 46.5 39.9–50 8.6 AS, AG 13 1 4.17 5 0–15.7 12.3 AS 12 + 13 18 4.69 46.5 39.9–50 10 AS, AG ΨM all 12 + 13 1 4.62 44.3 33.1–54.4 12.7 AS, AG 10 6.33 5.3 0–15.3 15.2 AS ΨM WD 12 18 4.38 43.3 34.9–46.5 11 AS, AG 13 1 5.65 38.1 28.9–54.3 12.1 AS 1 6.38 44.3 28.9–54.3 15.9 AS 10 5.07 5.3 0–15.3 12.2 AS 12 + 13 1 5.02 38.1 28.9–54.3 12.1 AS, AG 1 5.50 44.3 33.1–54.3 12.4 AS, AG 10 5.29 5.3 0–15.3 11.1 AS 18 5.32 54.8 50–59.9 11.1 AS, AG ∆Ψ all 12 + 13 1 5.43 44.3 33.1–54.4 13 AS, AG 10 6.16 5.3 0–15.3 14.8 AS ∆Ψ WD 13 1 5.61 38.1 28.9–54.3 12 AS 1 6.35 44.3 28.9–54.3 15.8 AS 10 5.07 5.3 0–15.3 12.3 AS 12 + 13 1 5.79 44.3 33.1–54.3 12.9 AS, AG 10 5.69 5.3 0–15.3 12.1 AS 18 5.78 46.5 39.5–50 12.1 AS, AG Red_ΨM WD–WW 12 + 13 18 4.71 46.5 39.9–50 11.5 AS, AG LA all 12 7 4.1 63 51.6–75.5 8.9 AG, D 17 4.17 5 0–14.1 12.6 AG, D 17 4.25 22.4 14.1–37.8 9.5 AG, D 17 4.41 36.9 26.9–37.8 9.8 AG, D 18 8.71 53.5 46.5–54.8 20.3 AS, AG 13 3 4.68 39.1 29.1–46.8 10.8 AG 3 5.52 41.1 29.1–46.8 11.6 AG 3 4.89 44 29.1–46.8 10.6 AG 18 5.1 46.5 39.9–50 12.3 AG 12 + 13 3 4.31 34.1 21.2–42.4 10.3 AS, AG 17 4.69 5 0–9.3 10.9 D 18 8.42 46.5 39.9–50 19.5 AS, AG
LG, linkage group; L, location of the QTL peak on the LG in cM; CI, confidence interval; %V, percentage of variance explained by the QTL; AS and AG, the additive
effects associated with Syrah and Grenache alleles, respectively; D, the global dominance effect.
The column entitled ‘effect’ indicates major effects of the considered locus involved in phenotype variation, satisfying the following condition: (|As| or |Ag| or |D|)/ (|As|+|Ag|+|D|) >0.30.
QTLs in bold were significant in the mentioned year but also putative in the other year or in the multiyear analysis (see Supplementary Table S2 at JXB online for details).
at INRA Avignon on June 16, 2014
http://jxb.oxfordjournals.org/
Version preprint
Fig. 6. Localization of the most significant quantitative trait loci (QTLs) involved in the genetic determinism of the hydraulic-related traits in a
Syrah×Grenache mapping population. Central marks on the vertical bars indicate the position L on each linkage group (LG01–LG18) of the consensus map where the maximum LOD score was observed (bold mark for multiyear QTLs and thin mark for 1-year QTLs). Vertical bars are for the LOD–1 confidence intervals around L. QTL names indicate the trait and the conditions (water treatment and years) retained for QTL analysis. QTLs were detected
for: ΨM, daytime leaf water potential; Tr and TrS whole-plant and specific transpiration rates, respectively; K and KS, whole-plant and specific hydraulic
conductances, respectively; LA, whole-plant leaf area. QTLs represented here are mainly those detected on the multiyear data set (indicated as ‘1213’ in the QTL name). When a QTL was also detected in one specific year as highly significant, the corresponding year is underlined in the QTL name. Highly significant QTLs detected in 1-year but not in multiyear analysis are also represented and identified with the corresponding year ‘12’ or ‘13’ in the QTL name. The middle part of the QTL name indicates either ‘WD’, ‘WW’, or ‘all’ when a QTL was detected respectively using water deficit, well-watered, or all water treatment data sets. (This figure is available in colour at JXB online.)
at INRA Avignon on June 16, 2014
http://jxb.oxfordjournals.org/
Version preprint
Transpiration rate under water deficit is genetically controlled but is not tightly correlated with variation in (an)isohydry
The transpiration rate was reduced by about a half by the mild WD conditions applied in the present study. Given that measurements were carried out in a strictly controlled environment, any change in transpiration rate could be ascribed to a change in stomatal conductance provided that the transpiration rate was expressed on a leaf area basis (i.e. by calculating the specific rate TrS). However, it should be noted that stomatal conductance may not be the only factor influencing transpiration and possibly involved in the transpiration response to WD. First, cuticular conduct-ance should be considered. However, it was unlikely that the cuticle changed during the 7 days of soil drying pre-ceding measurements. Similarly, boundary layer conduct-ance in the controlled-environment chamber was mostly conserved between WW and WD conditions. In spite of strict control of atmospheric conditions in the chamber, TrS was slightly but significantly higher in 2013 compared with 2012 (regardless of water regime). This could be explained by the lower plant density in the growth chamber that was imposed in 2013 to facilitate leaf sampling. The reduction of plant density by about one-third in 2013 may have slightly increased the boundary layer conductance and probably resulted in more leaves exposed to direct light
(which were selected for ΨM measurements in all cases).
However, evaporative conditions were similar for WW and WD plants within each year. Eventually, within each year, only variations in leaf temperature induced by the reduc-tion in transpirareduc-tion rate under WD may have slightly dis-torted the relationship between specific transpiration rate and stomatal conductance. Stomatal closure in response to soil WD was therefore the primary cause of reduction in Trs induced by WD. A wide range of variation was found in the progeny, with slight reduction in transpiration rate for some genotypes (Red_TrS=0.78) down to stronger reduc-tion for others (Red_TrS=0.42). A similar range of genetic variation in transpiration rate under WD was observed in
scions grafted on a rootstock progeny (Marguerit et al.,
2012).
Variation in drought-induced stomatal closure, as approxi-mated here by the reduction in transpiration rate, is thought to be at the origin of the contrasted behaviours between iso-
and anisohydric plants (Buckley, 2005). This proposal, which
has never been examined on a wide genetic scale, is challenged in this study by the absence of tight correlation under WD
between ΨM (or Red_ΨM) and speficic transpiration rate (or
Red_TrS) within the progeny (Fig. 5). Even more puzzling,
the corresponding correlations, although loose, were posi-tive. This was not expected if a strong reduction in TrS (low Red_TrS and low TrS) associated with stomatal closure were
to play a role in the maintenance of high ΨM.
In other words, the way in which ΨM was decreased more
or less severely by soil drying cannot be considered as simply determined by the range of variation in transpiration rate that was observed within the progeny. This is corroborated by the
present results on QTL detection. Only one co-localization
was found between a QTL detected for ΨM and specific
tran-spiration rate (LG10), whereas other QTLs were specifically
detected for ΨM on LG01 and LG18. This suggests, again,
that the genetic controls of ΨM and stomatal regulation only
partly share common determinisms and may also rely on independent mechanisms. It should be noted that heritabil-ity for reduction in transpiration rates (Red_TrS) was quite low in this study. Red_TrS was calculated as one single value for each genotype in each year and could not be determined with replications on individual plants which were exclusively characterized under either WW or WD treatment. This could explain why no QTL was detected for this trait. QTLs detected for specific transpiration were not systematically sig-nificant over the two years, as was the case in similar studies (Marguerit et al., 2012). The most likely explanation is the high number of QTLs which are expected to control the tran-spiration rate in agreement with the large amount of genes
identified as controlling stomatal differentiation (Barton,
2007) and functioning (Ward et al., 2009). In such
condi-tions, individual QTLs have weak effects and their detection becomes tricky.
Besides the role of stomata, it makes sense to question the contribution of hydraulic conductance in the control of
leaf water homeostasis (Cochard et al., 2002) since hydraulic
conductance (from soil to leaves as considered in this study)
determines the value of ΨM for a given value of
transpira-tion rate and also because changes in hydraulic conductance
may influence the stomatal control of transpiration (Pantin
et al., 2013). Within the Syrah×Grenache progeny, under
WD, specific hydraulic conductance showed a high heritabil-ity and many QTLs were detected. Interestingly, although
the calculation of KS was based on ΨM and therefore partly
shared the same source of variation, only one QTL for KS
co-localized with one of the QTLs detected for ΨM under
WD (LG18). This suggests that, as for transpiration rate, genetic variability in hydraulic conductance may participate in the control of (an)isohydric behaviours but cannot fully account for them.
Over the whole grapevine progeny, WD reduced soil-to-leaf hydraulic conductance by about a half, but with contrasted responses within the progeny. This raises questions on the physiological origin of this genetic variability. Measurements in field conditions have already revealed rapid and severe impacts of soil drying on soil-to-leaf hydraulic conductance in
grapevine cultivars, specifically in the daytime (Zufferey et al.,
2011). In the conditions used here, soil drying developed in
~1 week before measurements so that plant architecture (ves-sel diameter or leaf venation) was not greatly modified com-pared with WW plants during this short, terminal period of differential treatment. Moreover, WD treatment caused only a moderate decrease in water potential which was unlikely to have induced substantial cavitation in the xylem pathway. Therefore, the observed reduction in specific hydraulic con-ductance more probaly resulted from rapid changes in water transport capacity such as those already revealed in grape-vine with the modification of aquaporin expression in roots (Vandeleur et al., 2009) or leaves (Pou et al., 2013).
at INRA Avignon on June 16, 2014
http://jxb.oxfordjournals.org/
Version preprint
The soil-to-root pathway which represents a major
resist-ance to water flow (Tramontini et al., 2013, in grapevine) is
very sensitive to changes in soil water content (van Genuchten
et al., 1980), and could have also contributed to the reduction
in hydraulic conductance and to genetic variation within the progeny in the present study. However, the same rootstock (110R) was used for all offspring. Genetic differences origi-nating in leaves rather than roots are more consistent with a variation in scions as involved in this study and with current knowledge on the effects of drought-induced signals such as abscisic acid on aquaporin activity in the sheaths of leaf
veins (Shatil-Cohen et al., 2011). Specifically, changes in some
aquaporin activity in leaves induced by water stress have been
correlated with changes in leaf hydraulic conductance (Pou
et al., 2013). However, it should also be envisaged that genetic variation of the scion was possibly accompanied by differ-ences in rootstock development and root water transport activity, which merits further studies.
Conclusions
The genetic analysis of water relations in the Syrah×Grenache progeny revealed that reduction in the transpiration rate induced by soil drying was not the only factor to be consid-ered for the maintenance of leaf water potential in the daytime. Determinism of (an)isohydry should be sought in deviations from the balance between water supply capacity (hydraulic conductance) and stomatal control of transpiration. From a physiological point of view, this suggestion is consistent with the proposal that diversity in (an)isohydric behaviours origi-nates in mechanisms uncoupling stomata from direct hydraulic
control (Tardieu and Simonneau, 1998). From a genetic point
of view, variability in (an)isohydric behaviour most probably rests on QTLs detected for the specific transpiration rate but not for specific hydraulic conductance (such as on LG10) and vice versa (LG13 and LG18). The present study also revealed
some genetic determinism of ΨM variation under WD that
appeared to be independent on both specific transpiration rate and specific hydraulic conductance (LG01). Recombining or selecting allelic variations in these QTLs appears to be a promising way to build cultivars with varying (an)isohydric behaviours.
Supplementary data
Supplementary data are available at JXB online.
Figure S1. Mean shoot growth response of the main axis of cv. Grenache plants to soil water content.
Figure S2. Comparison between measured and predicted plant biomass and leaf area.
Figure S3. Relationship between soil water content (SWC)
and soil water potential (Ψsoil).
Figure S4. Evolution of hourly transpiration rate during a 6 h period after switching on the lights in a controlled-envi-ronment chamber and relationship between the transpiration rate calculated over the whole 6 h light period and the 2 h period when leaf water potential was determined.
Table S1. Mixed models selected for the extraction of BLUPs of genetic values.
Table S2. Putative quantitative trait loci (QTLs) (PChr<0.05)
detected on the consensus map of the Syrah×Grenache prog-eny for the hydraulics-related traits and leaf area measured in the Phenotyping Platform PhenoArch.
Acknowledgements
Claudine Morel, Suppawadee Sittichai, Victorien Taudou, Cédric Ouvray, and Mathieu Moreno took an active part in measurements of the water relations and Antonin Grau in platform management. Denis Vile provided useful help in the estimation of individual leaf areas. This work was sup-ported by the French program ANR-09-GENM-024-002. AC-L received a PhD grant from the French Government.
References
Abiola O, Angel JM, Avner P, et al. 2003. The nature and identification
of quantitative trait loci: a community’s view. Nature Reviews Genetics 4,
911–916.
Adam-Blondon AF, Roux C, Claux D, Butterlin G, Merdinoglu D, This P. 2004. Mapping 245 SSR markers on the Vitis vinifera genome: a tool for
grape genetics. Theoretical and Applied Genetics 109, 1017–1027.
Ambrose AR, Sillett SC, Dawsont E. 2009. Effects of tree height on
branch hydraulics, leaf structure and gas exchange in California redwoods.
Plant, Cell and Environment 32, 743–757.
Barton MK. 2007. Making holes in leaves: promoting cell state transitions
in stomatal development. The Plant Cell 19, 1140–1143.
Borel C, Simonneau T, This D, Tardieu F. 1997. Controls of stomatal
conductance and ABA concentration in the xylem sap of barley lines of
contrasting genetic origins. Australian Journal of Plant Physiology 24,
607–615.
Buckley TN. 2005. The control of stomata by water balance. New Phytologist 168, 275–292.
Chaves M, Zarrouk O, Francisco R, Costa JM, Santos T, Regalado AP, Rodrigues ML, Lopes CM. 2010. Grapevine under deficit irrigation:
hints from physiological and molecular data. Annals of Botany 105,
661–676.
Churchill GA, Doerge RW. 1994. Empirical threshold values for
quantitative trait mapping. Genetics 138, 963–971.
Cochard H, Coll L, Roux XL, Ameglio T. 2002. Unraveling the effects
of plant hydraulics on stomatal closure during water stress in walnut. Plant
Physiology 128, 282–290.
Franks PJ, Drake PL, Froend R. 2007. Anisohydric but
isohydrodynamic: seasonally constant plant water potential gradient explained by a stomatal control mechanism incorporating variable plant
hydraulic conductance. Plant, Cell and Environment 30, 19–30.
Gholipoor M, Choudhary S, Sinclair TR, Messina CD, Cooper M. 2013. Transpiration response of maize hybrids to atmospheric
vapour pressure deficit. Journal of Agronomy and Crop Science 199,
155–160.
Huang YF, Doligez A, Fournier-Level A, et al. 2012. Dissecting genetic
architecture of grape proanthocyanidin composition through quantitative
trait locus mapping. BMC Plant Biology 12, 1–19.
Jansen RC. 1993. Interval mapping of multiple quantitative trait loci. Genetics 135, 205–211.
Jansen RC, Stam P. 1994. High resolution of quantitative traits into
multiple loci via interval mapping. Genetics 163, 1447–1455.
Marguerit E, Brendel O, Lebon E, Van Leeuwen C, Ollat N. 2012.
Rootstock control of scion transpiration and its acclimation to water deficit
are controlled by different genes. New Phytologist 194, 416–429.
McDowell N, Pockman WT, Allen CD, et al. 2008. Mechanisms of plant
survival and mortality during drought: why do some plants survive while
others succumb to drought? New Phytologist 178, 719–739.
Monteith JL. 1995. A reinterpretation of stomatal responses to humidity. Plant, Cell and Environment 18, 357–364.
at INRA Avignon on June 16, 2014
http://jxb.oxfordjournals.org/
Version preprint
Ocheltree TW, Nippert JB, Prasad PV. 2013. Stomatal responses to
changes in vapor pressure deficit reflect tissue-specific differences in
hydraulic conductance. Plant, Cell and Environment 37, 132–139.
Pantin F, Monnet F, Jannaud D, Costa JM, Renaud J, Muller B, Simonneau T, Genty B. 2013. The dual effect of abscisic acid on
stomata. New Phytologist 197, 65–72.
Pou A, Medrano H, Tomas M, Martorell S, Ribas-Carbo M, Flexas J.
2012. Anisohydric behaviour in grapevines results in better performance under moderate water stress and recovery than isohydric behaviour. Plant
and Soil 359, 335–349.
Pou A, Medrano H, Flexas J, Tyerman SD. 2013. A putative role
for TIP and PIP aquaporins in dynamics of leaf hydraulic and stomatal conductances in grapevine under water stress and re-watering. Plant, Cell
and Environment 36, 828–843.
Prieto J, Lebon E, Ojeda H. 2010. Stomatal behavior of different
grapevine cvs in response to soil water status and air water vapor pressure
deficit. Journal International des Sciences de la Vigne et du Vin 44, 9–20.
R Development Core Team. 2012. R: a language and environment for statistical computing . R Foundation for Statistical Computing, Vienna, Austria. Royston P. 1995. Remark AS R94: a remark on Algorithm AS 181: the W
test for normality. Applied Statistics 44, 547–551.
Schultz HR. 2003. Differences in hydraulic architecture account for
near-isohydric and anisohydric behavior of two field-grown Vitis vinifera
L. cultivars during drought. Plant, Cell and Environment 26, 1393–1405.
Segura V, Denance C, Durel CE, Costes E. 2007. Wide range QTL
analysis for complex architectural traits in a 1-year-old apple progeny.
Genome 50, 159–171.
Shatil-Cohen A, Attia Z, Moshelion M. 2011. Bundle-sheath cell
regulation of xylem-mesophyll water transport via aquaporins under
drought stress: a target of xylem-borne ABA. The Plant Journal 67, 72–80.
Sinclair TR, Zwieniecki MA, Holbrook NM. 2008. Low leaf hydraulic
conductance associated with drought tolerance in soybean. Physiologia
Plantarum 132, 446–451.
Soar CJ, Speirs J, Maffei SM, Penrose AB, McCarthy MG, Loveys BR. 2006. Grape vine varieties Shiraz and Grenache differ in their stomatal
response to VPD: apparent links with ABA physiology and gene expression
in leaf tissue. Australian Journal of Grape and Wine Research 12, 2–12.
Tardieu F, Davies WJ. 1992. Stomatal response to ABA is a function of
current plant water status. Plant Physiology 98, 540–545.
Tardieu F, Lafarge T, Simonneau T. 1996. Stomatal control by fed
or endogenous xylem ABA in sunflower: interpretation of observed correlations between leaf water potential and stomatal conductance. Plant,
Cell and Environment 19, 75–84.
Tardieu F, Simonneau T. 1998. Variability among species of stomatal
control under fluctuating soil water status and evaporative demand: modelling isohydric and anisohydric behaviours. Journal of Experimental
Botany 49, 419–432.
Tramontini S, van Leeuwen C, Domec J-C, Destrac-Irvine A, Basteau C, Vitali M, Mosbach-Schulz O, Lovisolo C. 2013. Impact
of soil texture and water availability on the hydraulic control of plant and
grape-berry development. Plant and Soil 368, 215–230.
Tsuda M, Tyree MT. 2000. Plant hydraulic conductance measured by the
high pressure flow meter in crop plants. Journal of Experimental Botany
51, 823–828.
Vandeleur R, Mayo G, Shelden M, Gilliham M, Kaiser B, Tyerman S. 2009. The role of plasma membrane intrinsic protein aquaporins in
water transport through roots: diurnal and drought stress responses reveal different strategies between isohydric and anisohydric cultivars of
grapevine. Plant Physiology 149, 445–460.
Van Genuchten MT. 1980. A closed-form equation for predicting the
hydraulic conductivity of unsaturated soils. Soil Science Society of America
Journal 44, 892–898.
Van Ooijen JW, Maliepaard C. 1996. MapQTL™ version 4.0: software for the calculation of QTL positions on genetic maps . Wageningen:
CPRO-DLO.
Ward JM, Fraser P, Schroeder JI. 2009. Plant ion channels: gene
families, physiology, and functional genomics analyses. Annual Review of
Physiology 71, 59–82.
Zufferey V, Cochard H, Ameglio T, Spring JL, Viret O. 2011. Diurnal
cycles of embolism formation and repair in petioles of grapevine (Vitis
vinifera cv. Chasselas). Journal of Experimental Botany 62, 3885–3894.
at INRA Avignon on June 16, 2014
http://jxb.oxfordjournals.org/