HAL Id: hal-02737916
https://hal.inrae.fr/hal-02737916
Submitted on 2 Jun 2020
HAL is a multi-disciplinary open access
archive for the deposit and dissemination of
sci-entific research documents, whether they are
pub-lished or not. The documents may come from
teaching and research institutions in France or
abroad, or from public or private research centers.
L’archive ouverte pluridisciplinaire HAL, est
destinée au dépôt et à la diffusion de documents
scientifiques de niveau recherche, publiés ou non,
émanant des établissements d’enseignement et de
recherche français ou étrangers, des laboratoires
publics ou privés.
for?
Marie Gosme, Anne Panozzo, Dominique Desclaux
To cite this version:
Marie Gosme, Anne Panozzo, Dominique Desclaux. Breeding durum wheat for agroforestry: what
to look for?. 4. European Agroforestry Conference. EURAF 2018, May 2018, Nijmegen,
Nether-lands. European Agroforestry Federation (EURAF), 567 p., 2018, Proceedings of the 4th European
Agroforestry Conference, Agroforestry as Sustainable Land Use. �hal-02737916�
BREEDING DURUM WHEAT FOR AGROFORESTRY:
WHAT TO LOOK FOR?
Gosme M1*, Panozzo A2, Desclaux D2
(1) SYSTEM, INRA, CIRAD, Montpellier SupAgro, CIHEAM, Montpellier, France (2) DIASCOPE, INRA, Mauguio, France
*Corresponding author: [email protected]
Abstract
Current varieties of cereals have been selected for conventional agriculture, in full sun conditions. It might be possible to increase crop yield in agroforestry conditions through plant breeding. A total of 31 genotypes (10 pure lines, 14 populations and 7 genetic resources) of durum wheat were tested over three years in two Mediterranean sites in both agroforestry and full sun control. As was expected, yield was reduced in most cases (except in 2015), but the reduction ranged from 8% to 80% depending on the genotypes. In the tested conditions, genetically diverse cultivars (populations) were not better adapted to agroforestry conditions than pure lines. Although no variety performed consistently well in agroforestry throughout all sites and years, the responses of genotypes to the presence of trees were diverse, indicating that selection for agroforestry might be possible. Future breeding programs should focus on improving durum wheat fertility in the shade.
Keywords: alley cropping; Triticum durum; shade tolerance; screening
Introduction
Agroforestry, i.e. a land use that combines agriculture and forestry, including the agricultural use of trees (van Noordwijk et al. 2016), provides diverse ecosystem services (Torralba et al. 2016) and as such attracts more and more attention from scientists and some pioneering farmers. However, when considering only crop yield, agroforestry usually results in a decrease compared to the pure crop because of the competition for resources between the crop and the trees (Cannell et al. 1996; Jose et al. 2004). However, as the current varieties of durum wheat were selected for conventional agriculture (Wolfe et al. 2008), it is possible that there is room for improving the performance of the crop in agroforestry conditions through plant breeding. Furthermore, it is often claimed that genetic diversity improves the resistance of crops to biotic and abiotic stresses (Reiss and Drinkwater 2017), so we wanted to test if population varieties were more adapted to agroforestry than pure line varieties. The aim of this work was thus to assess the performance of several varieties of durum wheat (elite pure lines, populations and genetic resources) in different agroforestry conditions as well as in full sun conditions, in order to (i) test the hypothesis that genetically diverse varieties are less negatively impacted by agroforestry conditions than pure lines, (ii) characterize desirable traits of the crop for cultivation in agroforestry systems and (iii) identify interesting varieties to be used as parents in future plant breeding programs for agroforestry.
Materials and methods
The experiment was conducted in two sites over three years (2014-2015, 2015-2016 and 2016-2017, subsequently only the year of harvest is indicated). The first site was located at INRA Melgueil experimental station, South-East of Montpellier in France, which is managed
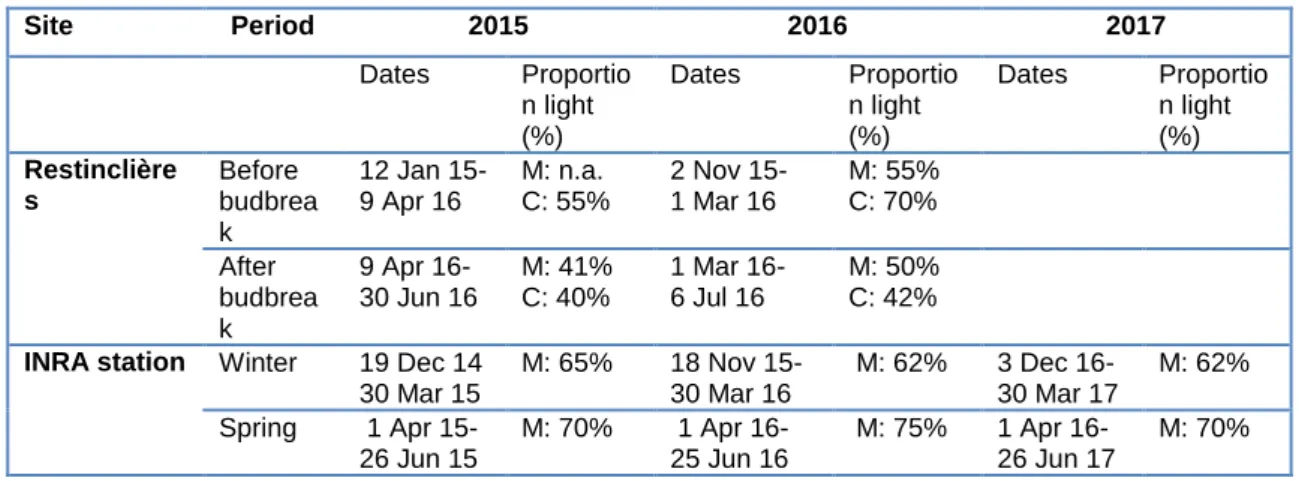
Table 1: Proportion of light (sum over the period) available to the crops in agroforestry in comparison with the full sun condition at different periods and different sites. M: measured with light sensors, C: calculated through analysis of hemispherical photographs.
Site Period 2015 2016 2017 Dates Proportio n light (%) Dates Proportio n light (%) Dates Proportio n light (%) Restinclière s Before budbrea k 12 Jan 15- 9 Apr 16 M: n.a. C: 55% 2 Nov 15- 1 Mar 16 M: 55% C: 70% After budbrea k 9 Apr 16- 30 Jun 16 M: 41% C: 40% 1 Mar 16- 6 Jul 16 M: 50% C: 42%
INRA station Winter 19 Dec 14 30 Mar 15 M: 65% 18 Nov 15- 30 Mar 16 M: 62% 3 Dec 16- 30 Mar 17 M: 62% Spring 1 Apr 15- 26 Jun 15 M: 70% 1 Apr 16- 25 Jun 16 M: 75% 1 Apr 16- 26 Jun 17 M: 70%
The plots used for the experiment contained different tree species, creating different shade intensity and dynamics (Table 1), depending on tree size and type (evergreen/deciduous). In Restinclières, the agroforestry plot in 2015 contained poplars planted in 1999 with 13 m between tree rows and 6 m between trees along the row. In 2016, it contained ash trees planted in 1995 in a 13m x 4m pattern. At INRA, the agroforestry plot contained olive trees planted in 2003 in a 6m x 5m pattern. A total of 31 durum wheat genotypes (10 elite pure lines (PL), 14 populations (POP) and 7 genetic resources (GR), chosen for their phenotypic variability) were tested over the three years, with two replicate microplots in each condition at INRA and 3 replicates in Restinclières. In each microplot, the yield and yield components (plants/m², tillers/plant, spikes/tiller, grains/spike and thousand kernel weight) were measured. Relative yield and yield components were computed as the ratio of the value in agroforestry (averaged for the 2 or 3 microplots of the genotype in a given site-year) on the value in full sun (averaged in the same manner). Data were analysed first with mixed models using package lme4 of R statistical language, considering the genotype as random effect, to test the effect of the conditions (AF, FS), for each site and year separately (INRA 2015-2016-2017, Restinclières 2015 and 2016) on each of the yield components. The two modalities were then compared using Tukey contrasts using package multcomp of R statistical language. The effect of the type of cultivar on the relative components of yield was tested with two-way anovas (conditions, type, and double interactions). In order to study the possibility to predict the suitability for cultivation in agroforestry conditions of a cultivar, we fitted a Partial Least Squares Regression with the components of yield in agroforestry, full sun and as relative values as predictor variables and the yield in agroforestry and the relative yield as response variables. In order to compare varieties in terms of adaptation to cultivation in agroforestry conditions, we computed the average, for each variety, of the yield in full sun expressed as a percentage of the mean yield of the site-year in full sun and the average, for each variety, of the yield in agroforestry conditions expressed as percentage of the yield in full sun conditions.
Results
Due to floods in autumn 2014, wheat sowing was delayed until December 2014 at INRA experimental station and January 2015 in Restinclières. In this latter site, the farmer could not treat the experiment with the rest of his wheat plots so no herbicides or fertilizers were applied. Therefore in this site-year, wheat yield was very low (mean over all varieties and conditions = 0.41 tons of grain dry matter per hectare) compared to the other site-years (1.25 in Restinclières in 2016, 2.45, 1.78 and 2.17 tons of grain dry matter per hectare at INRA in 2015, 2016 and 2017 respectively).
Effect of agroforestry on yield components of durum wheat
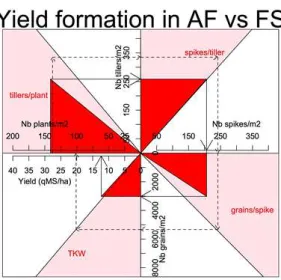
Agroforestry conditions significantly reduced grain yield compared to full sun conditions, except in 2015, were grain yield was higher in agroforestry than full sun (significantly so in Restinclières). Relative yields were (mean ± standard deviation) 1.27±0.44, 0.54±0.28, 0.67±0.37, 1.55±0.96 and 0.29±0.09 at INRA in 2015, 2016, 2017, Restinclières 2015 and 2016 respectively. The yield component that was most negatively impacted by agroforestry was the number of grains per spike (in average -31% in agroforestry compared to full sun) and the number of tillers per plant (-25%) (Figure 1). For these two yield components, the value in agroforestry was always significantly lower than in full sun, except in Restinclières 2015 for the number of tillers/plant and at INRA in 2015 for the number of grains per spike, where the difference was not significant. For the other yield components the effect of agroforestry was less clear (Table 2).
Figure 1: Yield formation in agroforestry (red angles and solid lines) vs full sun (pink angles and dashed lines), average over all sites, years and genotypes.
Table 2: Effect of agroforestry conditions (AF>FS, AF<FS or no significant effect) on yield components in each site-year (I=INRA site, R=Restinclières Estate site, 15-17=years 2015-2017)
component
I15 I16 I17 R15 R16 plants/m2 > - > > - tillers/plant < < < - < spikes/tiller - > < - - grains/spike - < < < < TKW - > - > - Yield - < < > <
Effect of genetic diversity on relative yield components and relative yield
There was no effect of the type of variety (pure line, population or genetic resource) on relative number of plants/m2, tillers/plant nor spikes per tiller. There was a significant effect of the type on the relative TKW only at INRA in 2016 with GR>(PL~POP) and in Restinclières in 2016 (PL>POP); and a significant effect on the relative yield only at INRA in 2017, with POP significantly higher than PL but GR not significantly different from POP nor PL.
Indicators of suitability for cultivation in agroforestry
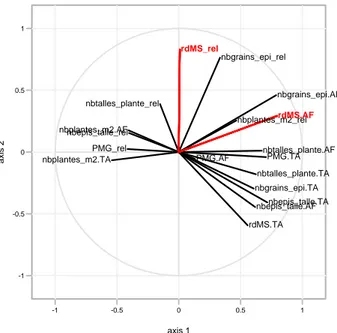
The PLSR results showed that the variables most correlated with yield in agroforestry and relative yield were the number of grains per spike and the relative number of grains per spike, respectively (Figure 2).
Figure 2: Circle of correlations of the predictor variables (in black) and response variables (in red).
Interesting genotypes for further breeding programs
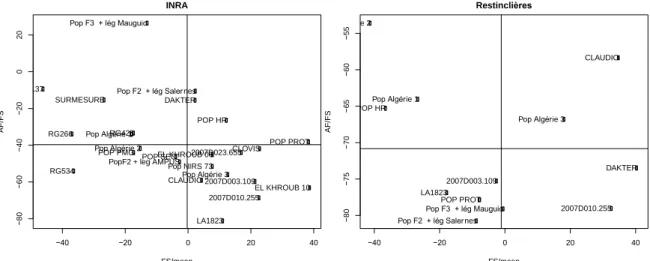
Due to the experimental problems in 2015 (floods in autumn 2014 that delayed sowing), this year was removed from the subsequent analysis. There was a high variability in the sensitivity of cultivars to agroforestry conditions: considering both sites together, the reduction of yield in AF compared to FS ranged from -8.6% to -79.6% depending on the variety. The performance of each cultivar was considered along two axes: yield in full sun (as a percentage of the mean of all varieties in a given site-year) and relative yield (yield in agroforestry as a percentage of yield in full sun) (Figure 3). Interesting varieties for a future breeding program would have both high yield in full sun and low yield reduction in AF. Based on the result from INRA experiment, these would be POP PROT, POP HR, DAKTER and "POP F2 leg Salernes". Unfortunately, except for POP HR, which has a good relative yield (but a low yield in FS) in Restinclières, the varieties that are identified as interesting in Restinclières (Claudio and Pop Algérie 3) are not the same as at INRA. -1 -0.5 0 0.5 1 -1 -0.5 0 0.5 1 axis 1 a x is 2 nbplantes_m2.TA nbtalles_plante.TA nbepis_talle.TA nbgrains_epi.TA PMG.TA rdMS.TA nbplantes_m2.AF nbtalles_plante.AF nbepis_talle.AF nbgrains_epi.AF PMG.AF nbplantes_m2_rel nbtalles_plante_rel nbepis_talle_rel nbgrains_epi_rel PMG_rel rdMS.AF rdMS_rel Circle of Correlations
Figure 3: "Performance" of each variety in terms of yield in full sun (expressed as a percentage of the mean yield of the site-year in full sun) and yield in agroforestry (expressed as a percentage of the yield in full sun conditions of the given variety in the given site-year). Horizontal and vertical lines indicate the overall means, dividing the map into 4 groups: 1: high yield in full sun and low reduction in AF; 2: high yield in full sun and high reduction in AF; 3: low yield in full sun and low reduction in AF; 4: low yields in all conditions. Data from 2015 were removed prior to the analysis.
Morphological measurements seem to indicate that plant height and distance from last leaf to spike might be useful for discriminating between the groups, but further analyses are needed to confirm this result.
Discussion and conclusion
As was expected, yield was reduced in most cases (in 2016 and 2017, 90% of the tested genotypes had a relative yield (AF/FS) lower than 1), however, in 2015, 71% of the genotypes had a relative yield higher than 1, indicating that in some conditions (e.g. late sowing), agroforestry can improve yield. Yield reduction ranged from 8% to 80% depending on the genotype. Contrary to our hypothesis, genetically diverse cultivars (populations) were not better adapted to agroforestry conditions than pure lines: except at INRA in 2017, where populations had a high relative yield, populations did not yield significantly better than pure lines and did not have higher yield components. The number of grains per spike was the component of yield that was most negatively impacted by agroforestry and it seems to be a relevant indicator of suitability of plants for cultivation in agroforestry. This may be due to light reduction, which is known to affect cereal fertility. Future breeding programs should focus on improving wheat fertility in the shade. The variability of the genotypes' responses to the presence of trees indicates that selection for agroforestry might be possible. The two agroforestry designs were totally different: the plants were submitted to heavy and constant shade at INRA site (olive trees are evergreen), whereas in Restinclières, the shade varied over time, which might explain why none of the genotypes tested in this experiment performed consistently well in all sites and years. Further analyses are needed in order to disentangle the effects of agroforestry from the effects of the specific sites and years.
References −40 −20 0 20 40 − 8 0 − 6 0 − 4 0 − 2 0 0 2 0 INRA FS/mean A F /F S 2007D003.109 2007D010.255 2007D023.655 CLAUDIO CLOVIS DAKTER EL KHROUB 06 EL KHROUB 10 LA1823 Pop Algérie 1 Pop Algérie 2 Pop Algérie 3 Pop F2 + lég Salernes Pop F3 + lég Mauguio POP HR Pop NIRS 73 POP PMG POP PROT POP SEC
PopF2 + leg AMPUS RG137 RG266 RG425 RG534 SURMESURE −40 −20 0 20 40 − 8 0 − 7 5 − 7 0 − 6 5 − 6 0 − 5 5 Restinclières FS/mean A F /F S 2007D003.109 2007D010.255 CLAUDIO DAKTER LA1823 Pop Algérie 1 Pop Algérie 2 Pop Algérie 3 Pop F2 + lég Salernes Pop F3 + lég Mauguio POP HR POP PROT
Jose S, Gillespie AR, Pallardy SG (2004) Interspecific interactions in temperate agroforestry. Agrofor Syst 61:237–255. Reiss ER, Drinkwater LE (2017) Cultivar mixtures: a meta-analysis of the effect of intraspecific diversity on crop yield.
Ecol Appl. doi: 10.1002/eap.1629.
Torralba M, Fagerholm N, Burgess PJ, Moreno G, Plieninger T (2016) Do European agroforestry systems enhance biodiversity and ecosystem services? A meta-analysis. Agric Ecosyst Environ 230: 150–161.
van Noordwijk M, Coe R, Sinclair F (2016) Central hypotheses for the third agroforestry paradigm within a common definition. World Agroforestry Centre (ICRAF).
Wolfe MS, Baresel JP, Desclaux D, Goldringer I, Hoad S, Kovacs G, Löschenberger F, Miedaner T, Ostergard H, Lammerts van Bueren ET (2008) Developments in breeding cereals for organic agriculture. Euphytica 163: 323–346.