HAL Id: hal-01983404
https://hal.sorbonne-universite.fr/hal-01983404
Submitted on 16 Jan 2019
HAL is a multi-disciplinary open access archive for the deposit and dissemination of sci-entific research documents, whether they are pub-lished or not. The documents may come from teaching and research institutions in France or abroad, or from public or private research centers.
L’archive ouverte pluridisciplinaire HAL, est destinée au dépôt et à la diffusion de documents scientifiques de niveau recherche, publiés ou non, émanant des établissements d’enseignement et de recherche français ou étrangers, des laboratoires publics ou privés.
Huaiyu Tian, Yun Feng, Bram Vrancken, Bernard Cazelles, Hua Tan, et al.. Transmission dynamics of re-emerging rabies in domestic dogs of rural China. PLoS Pathogens, Public Library of Science, 2018, 14 (12), pp.e1007392. �10.1371/journal.ppat.1007392�. �hal-01983404�
Transmission dynamics of re-emerging rabies
in domestic dogs of rural China
Huaiyu TianID1☯*, Yun Feng2☯, Bram VranckenID3☯, Bernard CazellesID4,5, Hua Tan6, Mandev S. GillID3, Qiqi Yang1, Yidan Li1, Weihong Yang2, Yuzhen Zhang2, Yunzhi Zhang2, Philippe Lemey3, Oliver G. Pybus7, Nils Chr. Stenseth8,9, Hailin Zhang2*,
Simon DellicourID3,10*
1 State Key Laboratory of Remote Sensing Science, College of Global Change and Earth System Science,
Beijing Normal University, Beijing, China, 2 Yunnan Institute of Endemic Diseases Control and Prevention, Yunnan Provincial Key Laboratory for Zoonosis Control and Prevention, Dali, China, 3 KU Leuven, Department of Microbiology and Immunology, Rega Institute, Laboratory of Evolutionary and Computational Virology, Leuven, Belgium, 4 Institut de Biologie de l’E´ cole Normale Supe´rieure UMR 8197, Eco-Evolutionary Mathematics, E´ cole Normale Supe´rieure, France, 5 Unite´ Mixte Internationnale 209, Mathematical and Computational Modeling of Complex Systems, Institut de Recherche pour le De´veloppement et Universite´ Pierre et Marie Curie, Bondy, France, 6 School of Biomedical Informatics, the University of Texas Health Science Center at Houston, Houston, Texas, United States of America, 7 Department of Zoology, University of Oxford, Oxford, United Kingdom, 8 Centre for Ecological and Evolutionary Synthesis (CEES), Department of Biosciences, University of Oslo, Blindern, Oslo, Norway, 9 Ministry of Education Key Laboratory for Earth System Modeling, Department of Earth System Science, Tsinghua University, Beijing, China, 10 Spatial Epidemiology Lab (SpELL), Universite´ Libre de Bruxelles, Bruxelles, Belgium
☯These authors contributed equally to this work.
*tianhuaiyu@gmail.com(HT);zhanghl715@163.com(HZ);simon.dellicour@kuleuven.be(SD)
Abstract
Despite ongoing efforts to control transmission, rabies prevention remains a challenge in many developing countries, especially in rural areas of China where re-emerging rabies is under-reported due to a lack of sustained animal surveillance. By taking advantage of detailed genomic and epidemiological data for the re-emerging rabies outbreak in Yunnan Province, China, collected between 1999 and 2015, we reconstruct the demographic and dispersal history of domestic dog rabies virus (RABV) as well as the dynamics of dog-to-dog and dog-to-human transmission. Phylogeographic analyses reveal a lower diffusion coeffi-cient than previously estimated for dog RABV dissemination in northern Africa. Further-more, epidemiological analyses reveal transmission rates between dogs, as well as between dogs and humans, lower than estimates for Africa. Finally, we show that recon-structed epidemic history of RABV among dogs and the dynamics of rabid dogs are consis-tent with the recorded human rabies cases. This work illustrates the benefits of combining phylogeographic and epidemic modelling approaches for uncovering the spatiotemporal dynamics of zoonotic diseases, with both approaches providing estimates of key epidemio-logical parameters. a1111111111 a1111111111 a1111111111 a1111111111 a1111111111 OPEN ACCESS
Citation: Tian H, Feng Y, Vrancken B, Cazelles B,
Tan H, Gill MS, et al. (2018) Transmission dynamics of re-emerging rabies in domestic dogs of rural China. PLoS Pathog 14(12): e1007392.
https://doi.org/10.1371/journal.ppat.1007392
Editor: Matthias Johannes Schnell, Thomas
Jefferson University, UNITED STATES
Received: June 20, 2018 Accepted: October 8, 2018 Published: December 6, 2018
Copyright:© 2018 Tian et al. This is an open access article distributed under the terms of the
Creative Commons Attribution License, which permits unrestricted use, distribution, and reproduction in any medium, provided the original author and source are credited.
Data Availability Statement: All relevant data are
within the paper and its Supporting Information files. All sequences generated in this study are available in GenBank under accession numbers listed inS1 Table.
Funding: Funding for this study was provided by
the National Natural Science Foundation of China (81673234, 41476161),http://www.nsfc.gov.cn/; the Bijzonder Onderzoeksfonds KU Leuven (BOF) (No. OT/14/115),https://www.kuleuven.be/ onderzoek/ondersteuning/if; the VIROGENESIS project (receiving funding from the European
have implications for rabies prevention and control in Asian countries.
Introduction
Rabies remains a significant threat to public health in the 21st century [1], causing around 60,000 human fatalities worldwide each year [2]. Rabies control in the developing world is cur-rently hindered by a lack of timely and accurate data about rabies cases in both humans and animals [3]. It is thought that the number of human deaths due to rabies virus (RABV) infec-tions is underestimated, and that the dynamics of the virus in dog populainfec-tions is poorly under-stood. These uncertainties inevitably hamper improvements in disease control strategies and the evaluation of control measures.
China is second only to India [4] in terms of the national number of human rabies cases, and in recent years the prevalence of rabies has increased in some areas of China [5]. More than 90% of human rabies cases in China occur in rural regions [6] where the proportion of vaccinated dogs is very low [7]. Additionally, China has a growing population of dogs, cur-rently estimated at 80–200 million animals [6], and the breeding, management, and vaccina-tion of dogs in the country is uncontrolled [8]. A better quantitative understanding of rabies epidemiology in dogs is needed to help predict future vaccine demand in China and other developing countries.
Dogs are the primary reservoir and vector of human rabies throughout most of Africa and Asia [9] and are responsible for more than 99% of human rabies cases [1]. Therefore, under-standing the dispersal dynamics of rabies in dogs is essential for quantifying dog-to-human transmissions and for disease prevention. Previous studies have documented “traveling waves” of rabies among wildlife populations [10–16] and uncovered the genetic signature of spatial expansion in RABV genomes [17–21]. Recent studies [22–24] have attempted to combine epi-demiological and genomic data to study the transmission dynamics of RABV. However, rabies spread in rural areas of China, like Yunnan Province, remains poorly documented despite an increasing incidence of human rabies. Yunnan Province in Southwest China first reported human rabies in 1956 and eliminated the disease by integrated dog management and control measures (including dog registration and the use of dog enclosures, dog vaccination, and cull-ing of rabid/suspected rabid dogs and stray dogs) in the late 1990s. However, a re-emergence of rabies in this province was reported in 1999.
In this study, we combine phylogeographic approaches and mathematical modelling to examine the dispersal dynamics of RABV in Yunnan, a rural province of China. We analyse publicly available and newly-generated RABV gene sequences from domestic dogs, cattle, and humans sampled between 2006 and 2015, together with comprehensive rabies epidemiological data dating back to 1999, when the first re-emerging human rabies case in Yunnan was reported (Fig 1A). Specifically, we aim to use both types of data to reconstruct the demo-graphic and dispersal history of RABV spread in Yunnan, as well as to estimate key
for Science and Technology Youth Talent Lift Project,http://www.cast.org.cn/; European Research Council under the European Union’s Seventh Framework Programme (FP7/2007-2013)/ European Research Council grant agreement number 614725-PATHPHYLODYN and under the European Union’s Horizon 2020 research and innovation programme, grant agreement no. 725422-ReservoirDOCS,https://ec.europa.eu/ programmes/horizon2020/; BV and SD were funded by a postdoctoral fellowship from the Fonds Wetenschappelijk Onderzoek (FWO, Belgium),http://www.fwo.be/(G066215N, G0D5117N and G0B9317N); SD is also supported by the Fonds National de la Recherche Scientifique (FNRS, Belgium). The funders had no role in study design, data collection and analysis, decision to publish, or preparation of the manuscript.
Competing interests: The authors have declared
epidemiological parameters that can be compared to other previously-studied RABV out-breaks. Finally, we use phylogeographic inference to investigate which environmental factors may have impacted the spatial dispersal dynamics of RABV in Yunnan.
Results
Re-emergence of rabies in Yunnan
Analyses of case records date the first documented rabies case in Yunnan Province back to 1956. These data indicate that an epidemic wave of rabies occurred in the 1980s and that, from the mid-1990s onwards, human rabies cases were reported only sporadically in the region. However, starting in 1999, a new RABV epidemic emerged. More than 900 human rabies cases were reported during 1999–2015, with the highest incidence of 0.3 cases per 100,000 peo-ple occurring in 2010 (Fig 1A). Human rabies in Yunnan was first reported in 1999 in the Southeast prefecture of Wenshan, which borders Vietnam and the Chinese province of Guangxi and spread across the province in the next decade [25].
Two RABV lineages dominate the Yunnan epidemic
We first used the discrete diffusion model implemented in BEAST 1.8 to undertake a conti-nental-scale phylogeographic analysis of a broad data set of Asian RABV sequences (S1 Table; see also theMaterials and Methodsfor details). Genetic histories of the RABV N and G genes reveal two individual lineages (YN-A1 and YN-A2,Fig 2) that represent the majority of sam-pled RABV infections in the post-1999 Yunnan epidemic.
We then used a GLM (generalised linear model) implementation, also available in BEAST 1.8, to measure the correlation between viral effective population size and RABV cases counts in Yunnan. This analysis estimated a GLM coefficient of 0.021 for the association between case counts and the trajectory of log effective population size of clade YN-A1 (which is the main RABV clade identified in Yunnan). The credible interval associated with this GLM coefficient estimate excludes zero (95% HPD: [0.005, 0.036]), and therefore indicates a significant associa-tion. The time to most recent common ancestor (tMRCA) estimates of the YN-A2 clade in the N and G gene largely overlap (N gene: 2007.8, 95% HPD: 2006.1–2009.2; G gene: 2008.3, 95% HPD: 2007.0–2009.4). The G gene estimate of the tMRCA of the YN-A1 lineage predates the N gene estimate (N gene: 1999.2, 95% HPD: 1996.6–2008.2; G gene: 1994.7, 95% HPD: 1992.5–1996.6).
Expanding and more localised sub-epidemics
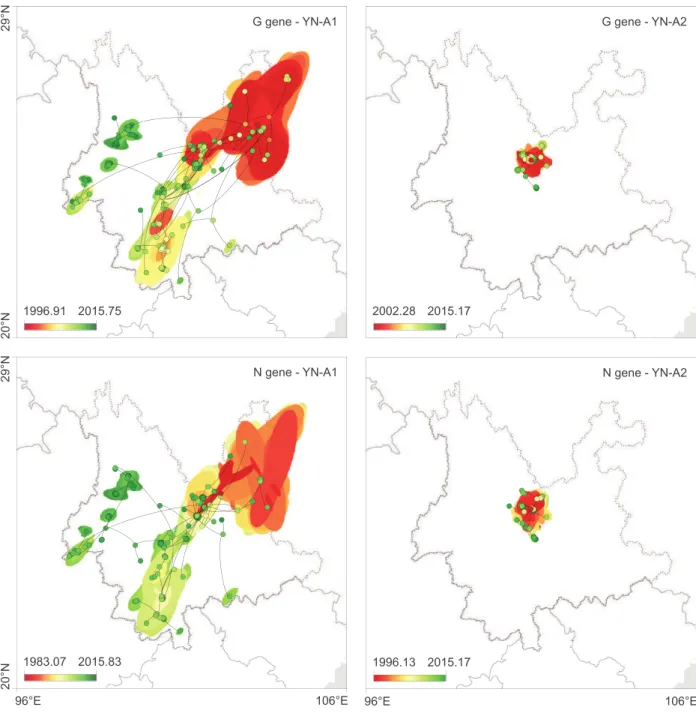
We next performed separate continuous phylogeographic reconstructions [26] for the YN-A1 and YN-A2 clades that were identified above in the discrete phylogeographic analysis. As shown inFig 3, the inferred RABV diffusion histories estimated from the N and G gene align-ments are consistent with each other. The YN-A1 clade underwent a larger spatial expansion and is more widely distributed within dog populations, while the YN-A2 clade appears to be geographically more limited. We compared the amino acid and nucleotide sites that vary between the YN-A1 and YN-A2 clades. There were no amino acid sites changes between these clades, suggesting that the differences in lineage distributions are not associated with pathobio-logical features, but rather over-representation of local area induced by stochastic founder events or by potential sampling bias (seeFig 1B).
Statistics of spatial dispersal estimated from continuous phylogeographic analyses are reported inTable 1. Estimation of diffusion coefficients [27] allows different outbreaks to be directly and quantitatively compared [19]. Specifically, we found that the diffusion coefficient
of RABV in Yunnan (D = 1733 km2/year; 95% HPD = 1082–2928) is on average substantially lower than that previously estimated for RABV among North African dogs (D = 2874 km2/ year; 95% HPD = 1900–5420) [28].
Impact of environmental factors on spatial dispersal dynamics
Several environmental variables were tested as potential factors that could affect RABV lineage dispersal velocity. As detailed in Materials and Methods, we estimated the correlation between phylogenetic branch durations and environmental distances computed on different rasters (S1 Fig). These correlations were then compared to the correlation between branch durations and distance computed on a “null” raster (i.e. an empty raster with no spatial heterogeneity whose
Fig 1. Current wave of rabies in Yunnan Province, China. A. Upper panel: human rabies in Yunnan Province from
1976 to 2015; lower panel: sampling of RABV samples in Yunnan Province. B. Locations of the RABV sequences sampled from dogs, 2006–2015. Circle areas are proportional to the number of gene-specific sequences sampled in each location and coloured according to a given clade (dark green: N gene clade SEA-1, green: N gene clade SEA-2, yellow: N gene clade SEA-3, red: G gene clade Asian-1, orange: G gene clade Asian-2).
cell values are set uniformly to “1”). Finally, the difference between these two correlations was assessed using a randomisation procedure. The rationale of this approach was to investigate which environmental factors can explain dispersal velocity heterogeneity better than simple geographic distances [28–30]. Complete results are reported inS2 Table, andS2 Figreports results for the environmental factors that are most likely to have impacted virus lineage dis-persal velocity. Only the forest coverage variable, tested as a potential conductance factor, was associated with a Bayes factor > 20. Although significant, the correlation is weak: using the “forest coverage” raster to compute environmental distances only increases the correlation with branch durations by 3%, relative to the uniform null raster. This means that forest cover-age (treated as a conductance factor) would be a minor contributor to the observed heteroge-neity in virus lineage dispersal velocity.
In addition to the analyses investigating the impact of environmental factors on dispersal veloc-ity, we also investigated the impact of these factors on the dispersal tendency, i.e. we investigated if
lineage translocation events tended to terminate in particular environmental conditions. Specifi-cally, we compared environmental values at the beginning (oldest node) and end (youngest node) of each branch. Differences between the environmental values at each end of phylogeny branches tested using a randomisation procedure (seeMaterials and Methods). This analysis also indicated
Fig 2. Maximum clade credibility trees of South-East Asian (SEA) RABV based on N and G gene sequences.
Branches are coloured according to their most probable geographic location: Yunnan Province in China (magenta); Hebei, Beijing, Shanxi, Shaanxi, Ningxia, Shandong, Henan, Jiangsu, Anhui, Sichuan, Hubei and Chongqing in North China (green); Hunan, Jiangxi, Guizhou, Fujian, Guangxi, Shanghai and Zhejiang in South China (blue); China Taiwan and the Philippines (Island area-1, in red); Indonesia (Island-2, in yellow); Myanmar, Thailand, Laos, Vietnam and Cambodia in Southeast Asia (purple). The dominant lineages in Yunnan are labelled with YN-A1 and YN-A2, along with the posterior probabilities for their ancestral nodes. The grey arrows mark single Yunnan lineages while the black arrows point to Yunnan clusters.
Fig 3. Spatiotemporal diffusion of Yunnan RABV clades estimated from continuous phylogeographic reconstructions. The plots show
mapped trees and 95% HPD regions based on 100 trees subsampled from the post burn-in posterior distribution of trees. Nodes of the trees are coloured according to a colour scale ranging from red (the time to the most recent common ancestor, TMRCA) to green (most recent sampling time). 95% HPD regions were computed for successive time layers and then superimposed using the same colour scale reflecting time. National and Yunnan Province borders are shown by solid and dashed lines, respectively.
https://doi.org/10.1371/journal.ppat.1007392.g003
Table 1. RABV dispersion statistics estimated from continuous phylogeographic analyses.
Statistic Definition Median value 95% HPD
vbranch mean branch velocity 57.5 km/year [39.2, 85.1]
vweighted weighted dispersal velocity 23.4 km/year [2.4, 32.6]
Doriginal original diffusion coefficient (Pybuset al. 2012) 1733 km2/year [1082, 2928]
Dweighted weighted diffusion coefficient (Trovaoet al. 2015) 1064 km2/year [116, 1638]
a possible effect of the “forest coverage” variable (Table 2): RABV lineages tended to spread towards areas associated with lower forest coverage (BF > 20 when considering forest coverage to be a potential negative driver of dispersal). We also note the relative importance of croplands (pos-itive driver, BF = 17.2) and inaccessibility (negative driver, BF = 12.5) factors, meaning that the virus lineages were also more likely to spread towards croplands and accessible areas.
Dynamic modelling from epidemiological data and dog surveillance
We used mathematical transmission models and data from human and dog surveillance of RABV outbreaks in Yunnan Province to quantify rabies spread in a rural area of China. Dog demogra-phy and human rabies data were collected by the Yunnan Institute of Endemic Disease Control and Prevention. Our model-based simulation of dog-to-human RABV transmission captures the rapid increase in human rabies at the end of the year 2000, reaching a peak around 2010, before rapidly declining from 2011 onwards (Fig 4). Moreover, we find that the simulated density of rabid dogs is highly correlated with reconstruction of viral effective population size through time.
Table 3shows the fitted parameters and values used in the model. Trace plots as well as Gelman and Rubin diagnostic indicate convergence of the MCMC chains [31] (S3 Fig). The estimated car-rying capacity (K) is 13.59 dogs/km2[95% credible interval (CI): 7.80–19.37 dogs/km2]. The dog-to-dog transmission rate (βd) is 6.62/year, [95% CI: 5.60–7.64/year]. The dog-to-human
transmis-sion rate (βdh) is 0.0004/year, [95% CI: 0.0002–0.0006/year]. The average basic reproductive
num-ber (R0) of the most recent wave of infection is estimated at 1.05 during the early stages of the
outbreak. High values for the transmission parameters and initial conditions are positively corre-lated with a high peak of human rabies infections (S4 Table), and the simulations are sensitive to these parameters. Our precise field measures are crucial for reliable model simulations, in particu-lar the dog-to-human transmission rate and dog population size.
Discussion
Human rabies is one of the biggest public health risks facing China. While current rabies sur-veillance mostly reflects the RABV prevalence in humans, very little is known about its preva-lence in dogs. In most of mainland China, diagnosis of dog rabies is currently effectively impossible in rural areas [8], because dogs are not leashed, can move freely and have a low vac-cination coverage [6]. Because of this, rural dog populations are at increased risk of exposure
Table 2. Impact of several environmental factors on RABV lineage dispersal tendency in Yunnan. Each
environ-mental varaiable was once tested as a positive and once as a negative driver of the viral dispersion. Bayes factors (BF)
>3 and >20 can be considered as “positive” and “strong” evidences, respectively [13].
Environmental factor BF when factors are treated as negative drivers
BF when factors are treated as positive drivers
Inaccessibility 12.5 0.1
Annual mean temperature 0.9 1.1
Annual precipitation 1.7 0.6 Croplands 0.1 17.2 Elevation 1.4 0.7 Foot print 0.1 7.1 Forests 21.2 0.0 Grasslands 0.3 3.2
Human pop. density 0.1 8.2
Savannas 1.3 0.8
Urban areas 0.1 6.6
and are crucial to rabies prevention and control efforts as they are the main reservoir for zoo-noses [36]. Analysis of high-resolution epidemiological and genomic data provides an oppor-tunity to explore the dynamics of re-emerging rabies dispersal and RABV transmission.
Continuous phylogeographic analyses yield a lower diffusion coefficient than that previ-ously estimated for dog RABV in northern Africa [19,28]. Previous analysis of the northern
Fig 4. The current wave of human rabies in Yunnan Province from 1999 to 2015. (A) RABV transmission from
dogs to humans. The black points represent observed human rabies cases. The blue line represents the deterministic prediction from the SEI model and the corresponding dotted light blue lines indicate the 95% credible interval endpoints of the model fit. Green lines show the simulation of intervention aimed at dogs with vaccination coverage of 10%, 15%, and 70% of dog population. (B) RABV transmission among dogs. The solid orange line is the posterior mean effective population size from the skygrid analysis inferred from the sequence data, and the surrounding dashed orange lines bound the 95% highest posterior density (HPD) region of that estimate. The solid black line is number of rabid dogs per square kilometre, and the dashed line is the 95% credible intervals. The vertical black line represents the earliest time point of sequence in study area.
https://doi.org/10.1371/journal.ppat.1007392.g004
Table 3. RABV epidemiological parameters estimated from occurrence data.
Parameter Definition Mean value SD�
bd dog birth rate 0.73/year 0.12 Estimated
dd dog death rate 0.26/year 0.12 Estimated
K dog carrying capacity 11.41 dogs/km2 0.83 Estimated
σd 1/σdis the average latent period 13.43/year 1.82 Estimated
αd death rate of rabid dogs 63.96/year 1.96 Estimated
βd dog-to-dog transmission rate 6.62/year 0.52 Estimated
βdh dog-to-human transmission rate 0.0004/year 0.0001 Estimated
S0 initial susceptible dog population size 9.50 dogs/km2 0.96 Estimated
E0 initial exposed dog population size 0.003 dogs/km2 0.003 Estimated
I0 initial infectious dog population size 0.003 dogs/km 2
0.003 Estimated
vd dog vaccination rate 0.07/year [32] - Fixed
e dog vaccination success rate 0.60/year [32] - Fixed
λd dog loss of vaccination immunity rate 1/year [33] - Fixed
λh human loss of vaccination immunity rate 1/year - Fixed
σh 1/σhis the average human incubation period 6/year [34] - Fixed
αh rabid humans mortality rate 1/year - Fixed
bh human birth rate 0.013/year [35] - Fixed
dh human mortality rate 0.006/year [35] - Fixed
�standard deviation
Africa data set also revealed the importance of human-related environmental factors (human population density, accessibility to nearest major cities) as explanatory factors for the heteroge-neity in RABV lineage dispersal velocity in Africa [28]. The higher diffusion coefficient of the northern African RABV data set was thus suspected to be related to human-based connectivity and/or mobility. Consequently, the lower diffusion coefficient estimated for the Yunnan data set could, in turn, indicate that human-related movements are less important contributors to the spatial dissemination of RABV in Yunnan, although we note that this is only one possible interpretation. Here, we also investigated the potential impact of several environmental factors and found a significant but weak effect of forest coverage acting (directly or indirectly) as a fac-tor favouring RABV lineage dispersal velocity in Yunnan. One potential interpretation of this result is that in sparsely populated forest areas a few rapid (and potentially human-related) movements of infected dogs may have occurred. Such lineage dispersal movements could have happened via the road network crossing forest areas. However, even if identified as a signifi-cant conductance factor, the forest coverage in itself is not necessarily the causal factor and could instead be correlated with the true causal factor that is not included in the present analysis.
The potential importance of forest coverage was further indicated by comparing environ-mental conditions at branch termination locations. This analysis mainly revealed that viral lin-eages did not tend to spread towards forest areas. However, this result could also reflect, to some extent, the impact of a potential sampling bias arising if there were a lower sampling probability in less densely human-populated regions, such as forest areas. Furthermore, even under the assumption that viral lineages would be less likely to spread towards forest areas, our analysis based on dispersal velocity revealed that these areas do not act as barriers decreasing lineages dispersal velocity among infected areas.
Our dynamic model provides estimates of epidemiological parameters for dog rabies in Yunnan. The simulated dog population indicated a low level of RABV transmission, different from the oscillations observed in N’Djamena, Africa [11]. We also obtained an estimate of the transmission rate among dogs (βd), and from dogs to humans (βdh); key epidemiological
parameters for assessment of rabies outbreaks and incidence among dogs. The estimate (βd) of
6.62/year was higher than the 4.20/year estimated in N’Djamena, Chad [34], and lower than 14.68/year estimated in Machakos District, Kenya [37,38]. The transmission rate from dogs to humans (βdh) was estimated to be 0.0004/year, which is consistent with our field investigation
of dog bites (0.0004/year) in the study area [39], but much lower than the 0.0107/year esti-mated in N’Djamena [34]. In addition, the estimated carrying capacity (13.59 dogs/km2, 95% CI: 7.80–19.37 dogs/km2) was also lower than 33.6 dogs/km2estimated in N’Djamena, Chad, but was similar to the value estimated in Tamil Nadu, India (12.69 dogs/km2, estimated using livestock census data) [40]. We suspect these may result from socio-economic differences, e.g. human population density [41].
Despite a national rabies control and prevention program that was implemented in China in 1985, which resulted in a drastic reduction in human rabies cases in the 1990s, a new RABV epidemic started in China in 1999 (Fig 1). Phylogeographic reconstructions confirm the East-to-West invasion history of RABV in Yunnan, which was previously suggested by epidemio-logical records [25]. Furthermore, we find a time lag between the peaks of viral effective popu-lation size and the corresponding peaks of rabid dog numbers (Fig 4). This may be due to the substantial proportion of undetected dog rabies infections; epidemiological surveillance of dog rabies in the region is far from exhaustive.
This study illustrates how RABV dispersion dynamics can be analysed by two complemen-tary approaches based on genetic and epidemiological data. Overall, our work further high-lights that domestic dogs play a key role in transmission and expansion of rabies in rural areas
Ethics statement
It was determined by the Yunnan Institute of Endemic Diseases Control and Prevention, that the collection of data from rabies cases was part of continuing public health surveillance of a notifiable infectious disease and was exempt from institutional review board assessment. Experimental procedures were performed in compliance with guidelines established by the Chinese Center For Disease Control And Prevention and have been approved by ethics com-mittee of Yunnan Institute of Endemic Diseases Control and Prevention.
New samples from Yunnan
From 2008 to 2015, we collected 1392 brain tissue samples. These samples were obtained from 252 dogs suspected of having rabies, 1129 apparently healthy domestic dogs, 2 cows, and 9 human patients within 24 hours of death in 14 prefectures and 43 counties of Yunnan Prov-ince (Fig 1B). In addition, 18 saliva samples and 1 cerebrospinal fluid sample were obtained from surviving patients.
All brain specimens were tested using direct immunofluorescence assay (DFA) and RABV nucleoprotein monoclonal antibody (Rabies DFA Reagent; Chemicon, Temecula, CA, USA). Total RNA was extracted from the original brain samples with the Trizol reagent (Invitrogen, USA) according to the manufacturer’s instructions [25]. PCR products were purified by using a QIAquick PCR Purification Kit (QIAGEN, Germany). Complete nucleoprotein gene (N gene; 1 cow, 84 dog and 6 human isolates) and glycoprotein gene (G gene; 2 cow, 110 dog and 8 human isolates) sequences were obtained by using previously described primers [21,42]. Newly generated RABV sequence data were submitted to GenBank (accession numbers KP072009–KP072030, KP202418- KP202448, KT932670-KT932698 and KX096992-KX097 000 for N gene, and JF819597-JF819602, JQ040570-JQ040581, JX276383-JX276404, KP07 2031-KP072052, KP202402-KP202417, KT861554-KT861586 and KX096983–KX096991 for G gene). An overview of the newly sequenced isolates is provided inS1 Table.
Incidence data from the Yunnan RABV epidemic
Human rabies case records (Fig 1A) in Yunnan from 1999 to 2015 were obtained from the Yunnan Center for Disease Control and Prevention (CDC) and the Chinese CDC. In China, human rabies is a class B notifiable infectious disease and all human cases must be reported to the Chinese CDC. Rabies cases were confirmed according to diagnostic criteria (WS281–2008) from the Ministry of Health of the People’s Republic of China.
Discrete phylogeographic analyses
To identify Yunnan-specific RABV circulation, nucleotide sequences of the N and G genes of all available RABV sequences sampled from non-flying mammals in Asia were downloaded from NCBI GenBank and aligned [43] together with our newly generated sequences. The
resulting data sets included 543 N sequences (the entire N gene coding sequence, 1350 nt long) and 491 G sequences (the entire G gene coding sequence, 1575 nt long). RABV clades specific to Yunnan were identified using the discrete trait analysis model implemented in BEAST 1.8 [44,45]. For the molecular clock phylogeographic analyses, we specified a general time-revers-ible GTR+I nucleotide substitution model [46–48], a skygrid coalescent model [49] and a relaxed uncorrelated lognormal (UCLN) molecular clock model across branches [50]. The data sets lack a clear temporal signal [51] (S1 Fig). Therefore, we specified informative prior distributions on the gene-specific mean clock rate parameter. These prior distributions were based on previously published estimated substitution rates [52]: 1.88×10⁻⁴substitutions/site/ year (95% highest posterior density, HPD: [1.37×10⁻⁴, 2.41×10⁻⁴]) for the N gene and 2.13×10⁻⁴substitutions/site/year (95% HPD: [1.56×10⁻⁴, 2.73×10⁻⁴]) for the G gene. The MCMC chain was run for 250 million states and mixing and convergence were inspected using Tracer [http://tree.bio.ed.ac.uk/software/tracer/]. TreeAnnotator 1.8 [44] was used to infer maximum clade credibility (MCC) summary trees.
Testing covariates of viral population size
We used the GLM (generalised linear model) extension of the skygrid coalescent model [53], implemented in BEAST 1.8, to simultaneously infer viral effective population sizes and mea-sure the association between estimated effective population size and cases counts. For this analysis, we focused only on sequences associated with the largest Yunnan clade identified by the discrete phylogeographic analysis (clade YN-A1, see theResultssection). Furthermore, we considered the N and G genes as two independent markers (see Appendix S1 inS1 Textfor the detailed procedure).
Continuous phylogeographic analyses
The history of virus lineage dispersal in Yunnan was recovered from geo-referenced phyloge-nies, which were estimated using the continuous phylogeographic method [26] implemented in BEAST 1.8. A separate continuous phylogeographic analysis was performed for each gene and each Yunnan clade identified by the preliminary discrete phylogeographic analyses; how-ever, the nucleotide substitution and molecular clock models were linked across the clades to avoid over-parameterisation. For these models, we used the same models as described above, together with a relaxed random walk model for inference of the continuous spatial locations. This relaxed random walk model assumed a log-normal probability distribution among phy-logeny branches of diffusion rate scalars. The spatiotemporal information contained in inferred phylogenetic trees was extracted with the R package “seraphim” [29,30]. For the pres-ent study, we extracted spatiotemporal information from a subset of 1,000 trees sampled at regular intervals from the posterior distribution of trees (after burn-in had been removed). This was done for each gene and for each Yunnan clade. After this extraction step, each phy-logeny branch is represented as a distinct movement vector [27]. “seraphim” was also used to estimate statistics of spatial dispersal based on these extracted movement vectors. We esti-mated the mean branch velocity, the weighted dispersal velocity, the diffusion coefficient (as originally defined in Pybuset al. [27]) and the weighted diffusion coefficient (as defined by Trovão et al. [54]). Further details regarding these statistics can be found in the “seraphim” package [30].
Impact of environmental factors on spatial dispersal dynamics
We next sought to investigate the impact of environmental factors on lineage dispersal veloc-ity. These analyses followed a similar structure to those used in previous studies [28,29,55]. All
branch durations and environmentally-scaled distances were quantified as a statisticQ, which
represents the difference between two coefficients of determination (R2): (i) the R2obtained when branch durations are regressed against environmentally-scaled distances, and (ii) the R2 obtained when branch durations are regressed against distances computed on a “null” raster, i.e. a raster with a value of “1” assigned to every cell. An environmental factor was only consid-ered as potentially explanatory if both its distribution of regression coefficients and its associ-ated distribution ofQ values were positive [56]. In a positive distribution of estimatedQ values
(i.e. with at least 90% of positive values), statistical support was then evaluated against a null distribution generated by a randomisation procedure and formalised using a Bayes factor (BF) value [28] (see Appendix S2 inS1 Textfor the full procedure). Due to computational limits, this analysis was based on 100 trees subsampled from each post-burn-in posterior distribution obtained by continuous phylogeographic inference.
Addition to the analyses based on lineage dispersalvelocity, we also used a new analytical
procedure to investigate the impact of several environmental factors on dispersaltendency. In
order words, this procedure aims at testing if virus lineages tend to disperse towards particular environmental conditions. In this framework, environmental conditions are compared between the locations of the two nodes connected by a phylogeny branch. For each branch and environmental factor, we computed the difference in raster cell values between the start (oldest node) location and at the end (youngest node) location. These differences were then averaged within each sampled tree and evaluated against a null distribution generated by the same ran-domisation procedure used for the analyses of the impact on dispersal velocity (see Appendix S3 inS1 Textfor the detailed procedure).
Dynamic modelling based on epidemiological data and dog surveillance
In the dynamic modelling part of this study, we extended the discrete susceptible-exposed-infec-tious (SEI) model for dog rabies [10,11,34]. Our discrete-time model framework was developed by dividing a closed dog population into four rabies classes, susceptible (Sd), exposed (Ed), and
infectious (Id), and vaccinated (Vd). We then extended the model for dog rabies to include
dog-to-human RABV transmission. A similar modelling framework has been applied to quantitatively assess the dynamics of RABV transmission [34].Shis the number of people susceptible to disease,
Phis the annual vaccinated individuals in Yunnan (based on medical records from Chinese
Cen-ter For Disease Control and Prevention),EhandVhrepresents the number of exposed humans
and immunized humans during the time period, respectively.
Sd;tþ1¼Sd;tþbdNd;tþ ldVd;t ddSd;t gNd;tSd;t bdSd;tId;t veSd;t ½1�
Ed;tþ1¼Ed;tþ bdSd;tId;t ddEd;t gNd;tEd;t sEd;t veEd;t ½2�
Vd;tþ1¼Vd;tþveðSd;tþEd;tÞ ddVd;t gNd;tVd;t ldVd;t ½4�
Sh;tþ1¼Sh;tð1 bdhId;tÞ þbhðSh;tþEh;tþVh;tÞ dhSh;tþ lhVh;t Ph;t ½5�
Eh;tþ1¼ bdhSh;tId;t shEh;t dhEh;t ½6�
Ih;tþ1 ¼ shEh;t dhIh;t ahIh;t ½7�
Vh;tþ1¼Vh;tð1 lhÞ þPh;t dhVh;t ½8�
whereNdis the total dog population (Sd+Ed+Id+Vd). Dog population growth is considered to
be density-dependent, with birth (bd) and death (dd) rates. The density-dependent mortality
parameter (γ) is a function of the dog population growth rate per year (bd—dd) and the carrying
capacity density of the dog population in km-2(K) is defined by γ = (bd—dd) /K. Carrying
capac-ity is defined as the maximum number or denscapac-ity of individuals that can be sustainably supported by a given environment. In rural areas of China, many domestic dogs are free-roaming and there has been no population control for most of the time. We can then assume that dog populations (including owned and stray dogs) are regulated through represented by carrying capacity deter-mined by some unknown combination of environmental and human geographic factors.βdand
βdhare the dog-to-dog and dog-to-human transmission rate, respectively.σdis the
latent-to-infec-tious rate per year andα is the rabies-induced mortality. At the beginning (t = 0), the basic repro-ductive number (R0) isσβdS0/((σ+b)(α+b)). Informative prior distributions are assumed for death
rate for rabid dog/human, latent period, incubation period, as well as dog-to-human transmission rate (βdh), which is assessed from our field investigation of dog bites [39]. We assumed dog
vacci-nation rate (v) of 0.07 and dog vaccination success rate (e) of 0.60 in Yunnan by previous
surveil-lance [32].λ is loss of vaccination immunity rate. Culling was simulated assuming the elimination of 1% of the total dog population based on empirical estimation, due to the temporal irregular and changing intensity of potential culling. The susceptible reconstruction provided initial esti-mates of the initial susceptible dog population size,Sd,0, for which we chose a uniform prior of
5–15 dogs/km2, according to our surveillance [32]. Initial numbers forEd,0andId,0were unknown
and fitted in the model with a wide prior 0–1 dogs/km2.
We fitted the dynamic model using the Bayesian state space framework using Metropolis-Hastings Markov chain Monte Carlo algorithms implemented in the MATLAB (vR2009b) toolbox DRAM (Delayed Rejection Adaptive Metropolis) [57,58]. The chain was initiated using published estimates of dog demography and RABV transmission rates [34,38,59–61] with an uninformative prior that varied from 0 to infinity, and then was run for 5 million itera-tions and sampled every 5000th step, after a burn-in of 500,000 iteraitera-tions.
Sensitivity analysis was performed using latin hypercube sampling (LHS) and partial rank correlation coefficient (PRCC) techniques [62]. Two criteria were retained as outputs for the analysis: the intensity of the peak of the human rabies infections and the date of the peak. Uni-form distributions were used for all parameters and the same ranges as for the prior distribu-tions were used. A total of 1,000 parameter sets were sampled with LHS and PRCC was estimated using the MATLAB code provided by Marino et al. [63].
S2 Fig. Potential impact of environmental factors on RABV dispersal velocity in Yunnan.
The results are based on 100 trees sampled from the posterior distribution. “C” and “R” indi-cate if the considered environmental variable was considered as a conductance ("C") or resis-tance factor ("R"), andk is the rescaling parameter used to transform the initial raster.
EstimatedQ distributions and related Bayes factor (BF) supports are reported here only for
those model combinations with >90% of positiveQ values and a BF support > 3 (seeS3 Table
for complete results). BF supports were estimated with the randomisation procedure detailed in Appendix S1 inS1 Text. Following Kass & Raftery (1995) we consider a BF > 3 and BF >20 respectively as a “positive” and “strong” evidences of the statistical significance ofQ, i.e. the
correlation between environmental distances and dispersal durations (see text for further details).
(TIF)
S3 Fig. Trace plots of four chains for each of the parameters. Four chains were initialized at
different values, and they converge to the target distribution quickly. (TIF)
S4 Fig. Plots of the root-to-tip genetic distance against sampling time for N gene and G gene data sets of Yunnan. TempEst was used to obtain exploratory regressions based on the
maximum likelihood trees. (TIF)
S1 Table. List of RABV sequences analysed in this study.
(DOCX)
S2 Table. Impact of several environmental factors on RABV dispersal velocity. The results
are based on 100 trees sampled in each posterior distribution. “C” and “R” indicate if the con-sidered environmental raster was concon-sidered as a conductance ("C") or resistance factor ("R"), andk is the rescaling parameter used to transform the initial raster (see the Appendix S2 inS1 Textfor further details). For regression coefficients andQ values we report both the median
estimate and the 95% HPD interval. The Bayes factor (BF) supports based on the randomisa-tion procedure is only reported whenp(Q > 0) is at least 90%. Following Kass & Raftery
(1995) we consider a Bayes factor (BF) >3 as positive support for a significant correlation between the environmental distances and dispersal durations.
(DOCX)
S3 Table. Source of data for each environmental raster.
(DOCX)
S4 Table. Sensitivity analysis. For model parameters, we used the same range as for the prior
rank correlation coefficients were estimated. (DOCX)
Acknowledgments
We thank three anonymous reviewers for their constructive comments on this manuscript. We are also grateful to Anna Virginia Black Mazzarella for her valuable comments and help. We thank the hundreds of Yunnan Institute of Endemic Diseases Control and Prevention staff and local health workers in Yunnan Province who collected data during 1999–2015.
Author Contributions
Conceptualization: Huaiyu Tian, Hailin Zhang.
Data curation: Huaiyu Tian, Yun Feng, Qiqi Yang, Yidan Li, Weihong Yang, Yuzhen Zhang,
Yunzhi Zhang, Hailin Zhang.
Formal analysis: Huaiyu Tian, Bram Vrancken, Bernard Cazelles, Hua Tan, Mandev S. Gill,
Philippe Lemey, Simon Dellicour.
Funding acquisition: Huaiyu Tian, Bram Vrancken, Philippe Lemey, Oliver G. Pybus, Simon
Dellicour.
Investigation: Huaiyu Tian, Yun Feng, Hailin Zhang.
Methodology: Huaiyu Tian, Bram Vrancken, Oliver G. Pybus, Simon Dellicour. Resources: Hailin Zhang.
Software: Bram Vrancken, Simon Dellicour.
Supervision: Huaiyu Tian, Hailin Zhang, Simon Dellicour. Visualization: Huaiyu Tian, Simon Dellicour.
Writing – original draft: Huaiyu Tian, Bram Vrancken, Philippe Lemey, Oliver G. Pybus,
Nils Chr. Stenseth, Simon Dellicour.
Writing – review & editing: Huaiyu Tian, Bram Vrancken, Philippe Lemey, Oliver G. Pybus,
Simon Dellicour.
References
1. Fooks AR, Banyard AC, Horton DL, Johnson N, McElhinney LM, et al. (2014) Current status of rabies and prospects for elimination. Lancet 384: 1389–1399. https://doi.org/10.1016/S0140-6736(13)62707-5PMID:24828901
2. Hampson K, Cleaveland S, Briggs D (2011) Evaluation of cost-effective strategies for rabies post-expo-sure vaccination in low-income countries. PLoS Negl Trop Dis 5: e982.https://doi.org/10.1371/journal.
pntd.0000982PMID:21408121
3. Knobel DL, Cleaveland S, Coleman PG, Fèvre EM, Meltzer MI, et al. (2005) Re-evaluating the burden of rabies in Africa and Asia. Bull World Health Organ 83: 360–368. PMID:15976877
4. Zhou H, Vong S, Liu K, Li Y, Mu D, et al. (2016) Human rabies in China, 1960–2014: A descriptive epi-demiological study. PLoS Negl Trop Dis 10: e0004874.https://doi.org/10.1371/journal.pntd.0004874
PMID:27500957
5. Ma C, Hao X, Deng H, Wu R, Liu J, et al. (2017) Re-emerging of rabies in Shaanxi Province, China, 2009 to 2015. J Med Virol:https://doi.org/10.1002/jmv.24769PMID:28112421
6. Tang X, Luo M, Zhang S, Fooks AR, Hu R, et al. (2005) Pivotal role of dogs in rabies transmission, China. Emerg Infect Dis 11: 1970–1972.https://doi.org/10.3201/eid1112.050271PMID:16485494
7722.https://doi.org/10.1073/pnas.0609122104PMID:17452645
12. Murray J, Stanley E, Brown D (1986) On the spatial spread of rabies among foxes. Proc R Soc Lond B Biol Sci 229: 111–150. PMID:2880348
13. Childs JE, Curns AT, Dey ME, Real LA, Feinstein L, et al. (2000) Predicting the local dynamics of epizo-otic rabies among raccoons in the United States. Proc Natl Acad Sci USA 97: 13666–13671.https://
doi.org/10.1073/pnas.240326697PMID:11069300
14. Russell CA, Smith DL, Waller LA, Childs JE, Real LA (2004) A priori prediction of disease invasion dynamics in a novel environment. Proc Biol Sci 271: 21–25.https://doi.org/10.1098/rspb.2003.2559
PMID:15002767
15. Smith DL, Lucey B, Waller LA, Childs JE, Real LA (2002) Predicting the spatial dynamics of rabies epi-demics on heterogeneous landscapes. Proc Natl Acad Sci USA 99: 3668–3672.https://doi.org/10.
1073/pnas.042400799PMID:11904426
16. Hampson K, Dushoff J, Cleaveland S, Haydon DT, Kaare M, et al. (2009) Transmission dynamics and prospects for the elimination of canine rabies. PLoS Biol 7: e1000053.
17. Biek R, Henderson JC, Waller LA, Rupprecht CE, Real LA (2007) A high-resolution genetic signature of demographic and spatial expansion in epizootic rabies virus. Proc Natl Acad Sci USA 104: 7993–7998.
https://doi.org/10.1073/pnas.0700741104PMID:17470818
18. Real LA, Henderson JC, Biek R, Snaman J, Jack TL, et al. (2005) Unifying the spatial population dynamics and molecular evolution of epidemic rabies virus. Proc Natl Acad Sci USA 102: 12107– 12111.https://doi.org/10.1073/pnas.0500057102PMID:16103358
19. Talbi C, Lemey P, Suchard MA, Abdelatif E, Elharrak M, et al. (2010) Phylodynamics and human-medi-ated dispersal of a zoonotic virus. PLoS Pathog 6: e1001166.https://doi.org/10.1371/journal.ppat.
1001166PMID:21060816
20. Yao H-W, Yang Y, Liu K, Li X-L, Zuo S-Q, et al. (2015) The spatiotemporal expansion of human rabies and its probable explanation in mainland China, 2004–2013. PLoS Negl Trop Dis 9: e0003502.https:// doi.org/10.1371/journal.pntd.0003502PMID:25692883
21. Tao X, Tang Q, Li H, Mo Z, Zhang H, et al. (2009) Molecular epidemiology of rabies in Southern Peo-ple’s Republic of China. Emerg Infect Dis 15: 1192–1198.https://doi.org/10.3201/eid1508.081551
PMID:19751579
22. Bourhy H, Nakoune´ E, Hall M, Nouvellet P, Lepelletier A, et al. (2016) Revealing the micro-scale signa-ture of endemic zoonotic disease transmission in an African urban setting. PLoS Pathog 12: e1005525.
https://doi.org/10.1371/journal.ppat.1005525PMID:27058957
23. Duke-Sylvester SM, Biek R, Real LA (2013) Molecular evolutionary signatures reveal the role of host ecological dynamics in viral disease emergence and spread. Philos Trans R Soc Lond B Biol Sci 368: 20120194.https://doi.org/10.1098/rstb.2012.0194PMID:23382419
24. Brunker K, Marston DA, Horton DL, Cleaveland S, Fooks AR, et al. (2015) Elucidating the phylody-namics of endemic rabies virus in eastern Africa using whole-genome sequencing. Virus Evol 1: vev011.https://doi.org/10.1093/ve/vev011PMID:27774283
25. Zhang H, Zhang Y, Yang W, Tao X, Li H, et al. (2014) Molecular epidemiology of reemergent rabies in Yunnan Province, southwestern China. Emerg Infect Dis 20: 1433.https://doi.org/10.3201/eid2009.
130440PMID:25144604
26. Lemey P, Rambaut A, Welch JJ, Suchard MA (2010) Phylogeography takes a relaxed random walk in continuous space and time. Mol Biol Evol 27: 1877–1885.https://doi.org/10.1093/molbev/msq067
PMID:20203288
27. Pybus OG, Suchard MA, Lemey P, Bernardin FJ, Rambaut A, et al. (2012) Unifying the spatial epidemi-ology and molecular evolution of emerging epidemics. Proc Natl Acad Sci USA 109: 15066–15071.
28. Dellicour S, Rose R, Faria NR, Vieira LFP, Bourhy H, et al. (2017) Using viral gene sequences to com-pare and explain the heterogeneous spatial dynamics of virus epidemics. Mol Biol Evol:https://doi.org/ 10.1093/molbev/msx1176
29. Dellicour S, Rose R, Pybus OG (2016) Explaining the geographic spread of emerging epidemics: a framework for comparing viral phylogenies and environmental landscape data. BMC bioinformatics 17: 82.https://doi.org/10.1186/s12859-016-0924-xPMID:26864798
30. Dellicour S, Rose R, Faria NR, Lemey P, Pybus OG (2016) SERAPHIM: studying environmental rasters and phylogenetically-informed movements. Bioinformatics 32: 3204–3206.https://doi.org/10.1093/ bioinformatics/btw384PMID:27334476
31. Laneri K, Bhadra A, Ionides EL, Bouma M, Dhiman RC, et al. (2010) Forcing versus feedback: epidemic malaria and monsoon rains in northwest India. PLoS Comput Biol 6: e1000898.https://doi.org/10. 1371/journal.pcbi.1000898PMID:20824122
32. Dong G, Ma K, Zhang W, Yang P (2011) Current situation and control of rabies in Yunnan Province. Modern Journal of Animal Husbandry and Veterinary Medicine: 32–33.
33. Lv Y, Lv S (2012) Some thoughts on rabies disease prevention in Yunnan Province. Yunnan Journal of Animal Science and Veterinary Medicine: 44–45.
34. Zinsstag J, Du¨rr S, Penny M, Mindekem R, Roth F, et al. (2009) Transmission dynamics and economics of rabies control in dogs and humans in an African city. Proc Natl Acad Sci USA 106: 14996–15001.
https://doi.org/10.1073/pnas.0904740106PMID:19706492
35. Statistical Bureau of Yunnan Province (2015) Yunan statistical yearbook. Beijing: China Statistical Press.
36. Zinsstag J, Lechenne M, Laager M, Mindekem R, Oussigue´ re´ A, et al. (2017) Vaccination of dogs in an African city interrupts rabies transmission and reduces human exposure. Sci Transl Med 9: eaaf6984.
https://doi.org/10.1126/scitranslmed.aaf6984PMID:29263230
37. Kitala P, McDermott J, Kyule M, Gathuma J, Perry B, et al. (2001) Dog ecology and demography infor-mation to support the planning of rabies control in Machakos District, Kenya. Acta Trop 78: 217–230. PMID:11311185
38. Kitala P, McDermott J, Kyule M, Gathuma J (2000) Community-based active surveillance for rabies in Machakos District, Kenya. Prev Vet Med 44: 73–85. PMID:10727745
39. Hu Q, Hu H, Zhang Y, Wu X, Yang W, et al. (2016) Analysis of a surveillance system based on aggres-sive dog attack incidents in chuxiong prefecture. J Med Pest Control 32: 1005–1007.
40. Fitzpatrick MC, Shah HA, Pandey A, Bilinski AM, Kakkar M, et al. (2016) One Health approach to cost-effective rabies control in India. Proc Natl Acad Sci USA 113: 14574–14581.https://doi.org/10.1073/
pnas.1604975113PMID:27994161
41. Gwatkin DR, Rutstein S, Johnson K, Suliman E, Wagstaff A, et al. (2007) Socio-economic differences in health, nutrition, and population within developing countries. Washington, DC: World Bank.
42. Yu J, Li H, Tang Q, Rayner S, Han N, et al. (2012) The spatial and temporal dynamics of rabies in China. PLoS Negl Trop Dis 6: e1640.https://doi.org/10.1371/journal.pntd.0001640PMID:22563518
43. Katoh K, Standley DM (2013) MAFFT multiple sequence alignment software version 7: improvements in performance and usability. Mol Biol Evol 30: 772–780.https://doi.org/10.1093/molbev/mst010PMID:
23329690
44. Drummond AJ, Suchard MA, Xie D, Rambaut A (2012) Bayesian phylogenetics with BEAUti and the BEAST 1.7. Mol Biol Evol 29: 1969–1973.https://doi.org/10.1093/molbev/mss075PMID:22367748
45. Lemey P, Rambaut A, Drummond AJ, Suchard MA (2009) Bayesian phylogeography finds its roots. PLoS Comput Biol 5: e1000520.https://doi.org/10.1371/journal.pcbi.1000520PMID:19779555
46. Yang Z (1994) Maximum likelihood phylogenetic estimation from DNA sequences with variable rates over sites: approximate methods. J Mol Evol 39: 306–314. PMID:7932792
47. Tavare´ S (1986) Some probabilistic and statistical problems in the analysis of DNA sequences. In: Miura R. M., editor. Some Mathematical Questions in Biology—DNA Sequence Analysis. Providence, RI: Amer Math Soc. pp. 57–86.
48. Shoemaker J, Fitch W (1989) Evidence from nuclear sequences that invariable sites should be consid-ered when sequence divergence is calculated. Mol Biol Evol 6: 270–289.https://doi.org/10.1093/
oxfordjournals.molbev.a040550PMID:2622335
49. Gill MS, Lemey P, Faria NR, Rambaut A, Shapiro B, et al. (2013) Improving Bayesian population dynamics inference: a coalescent-based model for multiple loci. Mol Biol Evol 30: 713–724.https://doi.
org/10.1093/molbev/mss265PMID:23180580
50. Drummond AJ, Ho SY, Phillips MJ, Rambaut A (2006) Relaxed phylogenetics and dating with confi-dence. PLoS Biol 4: e88.https://doi.org/10.1371/journal.pbio.0040088PMID:16683862
55. Laenen L, Dellicour S, Vergote V, Nauwelaers I, De Coster S, et al. (2016) Spatio-temporal analysis of Nova virus, a divergent hantavirus circulating in the European mole in Belgium. Mol Ecol 25: 5994– 6008.https://doi.org/10.1111/mec.13887PMID:27862516
56. Jacquot M, Nomikou K, Palmarini M, Mertens P, Biek R (2017) Bluetongue virus spread in Europe is a consequence of climatic, landscape and vertebrate host factors as revealed by phylogeographic infer-ence. Proc Biol Sci 284: 20170919.https://doi.org/10.1098/rspb.2017.0919PMID:29021180
57. Chib S, Greenberg E (1995) Understanding the metropolis-hastings algorithm. Am Stat 49: 327–335.
58. Haario H, Laine M, Mira A, Saksman E (2006) DRAM: efficient adaptive MCMC. Stat Comput 16: 339– 354.
59. Cleaveland S, Dye C (1995) Maintenance of a microparasite infecting several host species: rabies in the Serengeti. Parasitology 111: S33–S47. PMID:8632923
60. Kitala P, McDermott J, Coleman P, Dye C (2002) Comparison of vaccination strategies for the control of dog rabies in Machakos District, Kenya. Epidemiol Infect 129: 215–222. PMID:12211590
61. Hua M, Zhang Y, Zhang Z, Liu R, Yang W, et al. (2013) Rabies virus carriage in domestic dogs and dis-tribution of positive dogs in Lufenng, Yunnan. Disease Surveillance 28: 853–856.
62. Blower SM, Dowlatabadi H (1994) Sensitivity and uncertainty analysis of complex models of disease transmission: an HIV model, as an example. International Statistical Review/Revue Internationale de Statistique 62: 229–243.
63. Marino S, Hogue IB, Ray CJ, Kirschner DE (2008) A methodology for performing global uncertainty and sensitivity analysis in systems biology. J Theor Biol 254: 178–196.https://doi.org/10.1016/j.jtbi.2008.


![Table 3 shows the fitted parameters and values used in the model. Trace plots as well as Gelman and Rubin diagnostic indicate convergence of the MCMC chains [31] (S3 Fig)](https://thumb-eu.123doks.com/thumbv2/123doknet/13735701.436754/8.918.299.854.162.400/table-fitted-parameters-values-gelman-diagnostic-indicate-convergence.webp)

