Supporting Information
Four Types of CdTe Magic-Size Clusters
from One Prenucleation Stage Sample at Room Temperature
Chaoran Luan,† Junbin Tang,§ Nelson Rowell,‡ Meng Zhang,§ Wen Huang,II Hongsong Fan,*,† Kui Yu*,†,§,⊥
†Engineering Research Center in Biomaterials, Sichuan University,
Chengdu 610065, Sichuan, P. R. China
§Institute of Atomic and Molecular Physics, Sichuan University,
Chengdu 610065, Sichuan, P. R. China
‡Metrology Research Centre, National Research Council Canada,
Ottawa, Ontario K1A 0R6, Canada
IILaboratory of Ethnopharmacology, West China School of Medicine,
Sichuan University, Chengdu 610065, Sichuan, P. R. China
⊥State Key Laboratory of Polymer Materials Engineering, Sichuan University,
Chengdu 610065, Sichuan, P. R. China
H. F. (email: hsfan@scu.edu.cn) or to K. Y. (email: kuiyu@scu.edu.cn)
Table of Contents
Experimental Methods 3
Table S1 Experimental details for the preparation of the induction period samples used 4
Table S2 Detailed in-situ collection information of the spectra 5
Scheme S1a-1 Optical absorption comparison of one induction period sample in 3.00Tol and in
2.50Tol−0.50OTA 6
Scheme S1a-2 10-30-50-100 µL of one 130 °C/30 min sample in 1.50Tol−1.50OTA 7
Scheme S1a-3 Temporal evolution of absorption of Scheme 1a dispersion 8
Figure S1 Expanded views of Figure 1 9
Figure S1a-1 Temporal evolution of absorption of one sample in 2.50Tol−0.50OTA 10
Figure S1a-2 10-30-50-100 µL of one induction period sample 2.50Tol−0.50OTA 11
Figure S1b-a Temporal evolution of absorption of one sample in 2.60Tol−0.40OTA 13
Figure S1b-b Temporal evolution of absorption of one sample in 2.70Tol−0.30OTA 14
Figure S1b-c Temporal evolution of absorption of one sample in 2.90Tol−0.10OTA 15
Figure S2-1 Temporal evolution of absorption of one sample in 2.925Tol−0.075OTA 16
Figure S2-2 10-30-50-100 µL of a 130 °C/30 min sample in 2.90Tol−0.10OTA 17
Figure S2-3 Temporal evolution of absorption of a 130 °C/30 min sample in 2.775Tol−0.200BTA 18 Figure S2-4 Temporal evolution of absorption of a 130 °C/30 min sample in 2.675Tol−0.300BTA 20 Figure S3-1 Summary of Figure 3 sMSC-448 absorbance 22
Figure S3-2 Sample (130 °C/30 min) in 2.83Tol−0.02ROH 23
Figure S3-3 Summary of Figure S3-2 sMSC-448 absorbance 24
Figure S3-4 Addition of OTA into a methanol-containing dispersion 25
Scheme S1-1 Relatively stable period for sMSC-417 (Figures S1b-a and S1b-b) 26
Scheme S1-2 Relatively stable period for sMSC-448 (Figures 2 and S2-1) 26
Scheme S1-3 Growth of sMSC-448 after disappearance of sMSC-371 and sMSC-417 (Figure S2-2b) 27
EXPERIMENTAL METHODS
Chemicals. Commercial chemicals, including cadmium acetate dihydrate (Cd(OAc)2·2H2O,
99.999%, Alfa Aesar), tellurium powder (Te, 99.999%, Alfa Aesar), tri-n-octylphosphine (TOP, 90.0%, Aldrich), oleylamine (OLA, 98%, Aldrich), octylamine (OTA, 99.0%, Aldrich),
butylamine (BTA, 99.5%, Aldrich), toluene (Tol, 99.5%, Chengdu Kelong Chemical) were used as received.
Syntheses. The Cd precursor, Cd(OAc)2/OLA, was prepared from Cd(OAc)2·2H2O in OLA.
Cd(OAc)2·2H2O (8.63 mmol, 2.35 g) and OLA (32.58 mmol, 15.00 mL) were placed in a
three-neck flask. The mixture was degassed for three times and evacuated at room
temperature for 30 min and at 120 °C for one hour, with a clear and lightly orange solution obtained eventually. After being cooled to room temperature under an N2 atmosphere, the
resulting solution was obtained as the Cd precursor.
The Te precursor, TeTOP, was prepared with a feed molar ratio of 4TOP to 1Te. Te powder (4.40 mmol, 0.56 g) and TOP (17.60 mmol, 6.52 g) were placed in a three-neck flask, which was then degassed for three times and then evacuated for 30 min at room
temperature. Under an N2 atmosphere, the reaction batch was heated to 350 °C rapidly and
held for half an hour to result in a clear and light orange solution. The Te precursor was obtained eventually as a light yellow solution after cooling to room temperature.
For a typical two-step synthetic approach to CdTe MSCs, the Cd precursor (1.54 mL, 0.88 mmol Cd(OAc)2/OLA) and OLA (3.00 mL) were mixed in a three-neck flask at room
temperature, which was then degassed for three times and evacuated for 30 min. The mixture was then heated (to a relatively high temperature such as at 120 °C) under an N2
atmosphere. TOPTe (0.39 mL, 0.22 mmol TOPTe) was initially dispersed in OLA (1.50 mL) in a small vial, and the dispersion was transferred into the three-neck flask under an N2
atmosphere. The present study used the feed molar ratio of 4Cd to 1Te; the feed molar ratio was documented to play a role on the evolution of MSCs.1 The mixture was held at a
temperature (such as 135 °C) for certain periods of time before the samples were extracted from the reaction batch. The extracted samples were characterized directly or stored as stock solutions at -10 °C before evolution, as summarized in detail in Table S1.
(1) Dagtepe, P.; Chikan, V. Effect of Cd/Te Ratio on the Formation of CdTe Magic-Sized Quantum Dots during Aggregation. J. Phys. Chem. A 2008, 112, 9304-9311.
Characterization. The UV-vis absorption spectra were collected via a Hitachi UH4150
spectrometer, in the range from 300 to 600 nm with an interval of 1 nm. Quartz cuvettes (QS from Hellma Analytics) with the light path of 10 mm and the volume of ~3.5 mL were used. Background measurements were performed with solvents such as toluene. Usually, it took about ~1 minute to prepare the dispersions prior to the collection of each spectrum. Table S2 shows more details regarding the in-situ spectra collection experiments.
Table S1. The detailed information for the induction period sample preparation.
Figure Condition Storage Period Storage ratio
Scheme S1a-1,3 135 °C/10 min 0 days
Scheme S1a-2 130 °C/30 min 0 days
Figure 1a 135 °C/10 min 4 days 4 times Tol
Figure 1b 135 °C/10 min 0 days
Figure 2 135 °C/10 min 5 days 4 times Tol
Figure 3, S3-2 130 °C/30 min 4 days 5 times Tol Figures S1a-2, S2-2 130 °C/30 min 0 days
Figure S1a-1 130 °C/30 min 4 days 5 times Tol
Figure S1b-a 135 °C/10 min 17 days 4 times Tol
Figure S1b-b 135 °C/10 min 12 days 4 times Tol
Figure S1b-c 135 °C/10 min 2 days 4 times Tol
Figure S2-1 135 °C/10 min 16 days 4 times Tol
Figure S2-3, S2-4 130 °C/30 min 1 days 5 times Tol
Table S2. Detailed information (min) for in-situ collection of optical absorption spectra.
Collection intervals 1 min 2 min 3 min 5 min 10 min 15 min 20 min 40 min 60 min
Scheme S1a-2 0-40 40-60 Scheme S1a-3 0-60 Figure 1a 0-60 Figure 1b 0-120 Figure 2 0-240 Figure 3a 3-5 0-3 5-10 10-20 20-60 Figure 3b, S3-2a, b, c 0-2 2-5 5-20 20-60 Figure S1a-2, S2-2 0-40 40-60 Figure S1a-1 0-2 2-5 5-70 70-80 Figure S1b-a, b 0-480 Figure S1b-c 0-60 Figure S2-1 0-120 120-480 Figure S2-3 1-10 10-20 20-40 Figure S2-4 1-7 7-10 10-80 80-100 100-220 Figure S3-2d 0-5 5-20 20-60 S5
Scheme S1a-1. Two optical absorption spectra collected for the induction period sample (which was used for Scheme 1c) in 3.00 mL of Tol (grey trace) and in a mixture of 2.50 mL Tol and 0.50 mL OTA (blue trace). Evidently, the induction period sample in Tol is transparent in optical absorption at the wavelengths longer than 371 nm. In the Tol and OTA mixture, the induction period sample displays a sharp absorption peaking at ~ 371 nm, suggesting the presence of sMSC-371.
Scheme S1a-2. In situ optical absorption spectroscopy exploring the evolution of sMSC-371 from one IP sample (130 °C/30 min). The sample was dispersed in a mixture of 1.50 mL Tol and 1.50 mL OTA, and the amounts of the sample used are indicated, 10 (a), 30 (b), 50 (c), and 100 (d) µL. For each of the four dispersions, 11 absorption spectra were recorded every 5 min up to 40 min and then every 10 min up to 60 min. Respectively, the maximum optical density (OD) at 372 nm is 0.17 (5 min), 0.55 (10 min), 0.93 (20 min), and 1.85 (10 min). The values of OD presented are subtracted by the corresponding OD values at 400 nm. The amount of sMSC-371 developed and the amount of the induction period sample used seem to have a linear relationship, almost. The insets highlight the absorption in the wavelength range of 400 to 430 nm, indicating that there is little sMSC-417 evolved.
0.0 0.1 0.2 0.3 300 350 400 450 500 550 Abs or ba nc e Wavelength (nm)
a Cd(OAc)2/OLA + TeTOP
10 µL130 °C/30 min 1.50Tol−1.50OTA 60 min 0 min sMSC-371 0.00 0.01 0.02 0.03 400 410 420 430 0.0 0.3 0.6 0.9 300 350 400 450 500 550 Abs or ba nc e Wavelength (nm)
b Cd(OAc)2/OLA + TeTOP
30 µL 130 °C/30 min 1.50Tol−1.50OTA 60 min 0 min sMSC-371 0.00 0.03 0.06 0.09 400 410 420 430 0.0 0.4 0.8 1.2 300 350 400 450 500 550 Abs or ba nc e Wavelength (nm)
c Cd(OAc)2/OLA + TeTOP
50 µL 130 °C/30 min 1.50Tol−1.50OTA 60 min 0 min sMSC-371 0.00 0.04 0.08 0.12 400 410 420 430 0.0 0.8 1.6 2.4 300 350 400 450 500 550 Abs or ba nc e Wavelength (nm)
d Cd(OAc)2/OLA + TeTOP
100 µL 130 °C/30 min 1.50Tol−1.50OTA 60 min 0 min sMSC-371 0.00 0.08 0.16 0.24 400 410 420 430 S7
Scheme S1a-3. In-situ optical absorption spectroscopy monitoring the presence of sMSC-371 in the dispersion presented in Scheme 1a. 13 spectra were recorded every 5 up to 60 min. sMSC-371 evolved to its maximum (OD = 1.12, 5 min), and then decreased slightly up to 60 min (OD = 0.97) monitored. The OD value is obtained via OD at 374 nm subtracted by OD at 400 nm. It seems that there is a peak at around 415 nm that is developing (as shown by inset), suggesting the presence of sMSC-417.
0.0
0.5
1.0
1.5
300
350
400
450
500
550
Abs
or
ba
nc
e
Wavelength (nm)
Cd(OAc)
2/OLA + TeTOP
30 µL 135 °C/10 min
2.00Tol−1.00OTA
60 min
0 min
sMSC-371
0.00
0.05
0.10
0.15
400 410 420 430
S8Figure S1. Expanded views for the isosbestic points of Figure 1a and 1b in the range of 340 to 450 nm (top) and 390 to 480 nm (bottom), respectively. The 0 min spectrum in Figure 1b
deviates from the isosbestic point, which might be attributed to the unfinished generation of sMSC-417 during the 0 to 5 min period.
0.0 0.4 0.8 1.2 340 360 380 400 420 440 Abs or ba nc e Wavelength (nm) 60 min 0 min sMSC−371 sMSC−417
a Cd(OAc)2/OLA + TeTOP 135 °C/10 min 2.50Tol−0.50OTA 0.0 0.3 0.6 0.9 390 410 430 450 470 Abs or ba nc e Wavelength (nm) 120 min 0 min sMSC−417 sMSC−448
b Cd(OAc)2/OLA + TeTOP 135 °C/10 min 2.80Tol−0.20OTA
0 min
Figure S1a-1. In situ optical absorption spectroscopy exploring the development of sMSC-417 at room temperature from the induction period sample (25 µL) of the
Cd(OAc)2/OLA and TeTOP reaction, which was heated at 130 °C for 30 min. After synthesis,
the 130 °C/30 min induction period sample was stored in five times Tol (by volume) at room temperature for three days; 0.15 mL of the Tol solution (containing 25 µL of the induction period sample) was dispersed in 2.85 mL of a mixture consisting of 0.50 mL OTA. There are 17 spectra recorded at 1, 2, and 5 min, and then with a 5 min interval to 70 min, and then at 80 min. In the first two minutes, both sMSC-371 and sMSC-417 increased. Interestingly, the monotonic decrease of sMSC-371 after 2 min is synchronized by the monotonic increase of sMSC-417, with an isosbestic point at 382 nm.
0.0
0.3
0.6
0.9
300
350
400
450
500
550
Abs
or
ba
nc
e
Wavelength (nm)
80 min
0 min
sMSC-417
sMSC-371
Cd(OAc)
2/OLA + TeTOP
130 °C/30 min
2.50Tol−0.50OTA
1 min
Figure S1a-2. (Left) In-situ optical absorption spectroscopy study of the changes of sMSC-371 and sMSC-417 at room temperature. The amounts of the sample (130 °C/30 min,
as-synthesized) were 10 (a1), 30 (a2), 50 (a3), and 100 µL (a4). For each dispersion, there are 0.0 0.2 0.4 0.6 300 350 400 450 500 550 Abs or ba nc e Wavelength (nm) 60 min 0 min sMSC-371 sMSC-417
a1 Cd(OAc)2/OLA + TeTOP
10 µL130 °C/30 min 2.50Tol−0.50OTA 0.0 0.5 1.0 1.5 300 350 400 450 500 550 Abs or ba nc e Wavelength (nm) 60 min 0 min sMSC-371 sMSC-417
a2 Cd(OAc)2/OLA + TeTOP
30 µL130 °C/30 min 2.50Tol−0.50OTA 0.0 0.7 1.4 2.1 300 350 400 450 500 550 Abs or ba nc e Wavelength (nm) 60 min 0 min sMSC-371 sMSC-417
a3 Cd(OAc)2/OLA + TeTOP
50 µL130 °C/30 min 2.50Tol−0.50OTA 0.0 1.0 2.0 3.0 300 350 400 450 500 550 Abs or ba nc e Wavelength (nm) 60 min 0 min sMSC-371 sMSC-417
a4 Cd(OAc)2/OLA + TeTOP
100 µL130 °C/30 min 2.50Tol−0.50OTA 0.0 0.2 0.4 0.6 0 10 20 30 40 50 60 Abs or ba nc e
Dispersion period (min)
417 nm 371 nm b1 Cd(OAc)2/OLA + TeTOP 130 °C/30 min
10 µL2.50Tol-0.50OTA 0.0 0.7 1.4 2.1 0 10 20 30 40 50 60 A bs or ba nc e
Dispersion period (min)
417 nm 371 nm b3 Cd(OAc)2/OLA + TeTOP 130 °C/30 min
50 µL 2.50Tol-0.50OTA 0.0 0.5 1.0 1.5 0 10 20 30 40 50 60 A bs or ba nc e
Dispersion period (min)
417 nm 371 nm b2 Cd(OAc)2/OLA + TeTOP 130 °C/30 min
30 µL2.50Tol-0.50OTA 0.0 1.0 2.0 3.0 0 10 20 30 40 50 60 A bs or ba nc e
Dispersion period (min)
417 nm 371 nm b4 Cd(OAc)2/OLA + TeTOP 130 °C/30 min
100 µL2.50Tol-0.50OTA
11 absorption spectra presented, which were recorded every 5 min up to 40 min and then every 10 min up to 60 min. Increasing the amount of the induction period sample resulted in more sMSCs and faster changes. (Right) Corresponding time-dependent apparent
absorbance (with the background subtraction) at 371 (grey dots with grey traces for eye guidance) and at 417 nm (blue dots with blue traces for eye guidance). The absorbance at 450 nm was used as the background, which is subtracted. The larger the amount of the induction period sample, the smaller the amount of OTA.
With 10 μL of the induction period sample (a1, b1), sMSC-371 reached its maximum in 5 min (OD = 0.41), and dropped continuously up to 60 min (OD = 0.33). Meanwhile, sMSC-417 kept increasing from 0 (OD = 0.01) to 60 min (OD = 0.05).
With 30 μL of the induction period sample (a2, b2), sMSC-371 also decreased from 5 (OD = 1.24) to 60 min (OD = 0.57), accompanied by an increase of sMSC-417 from 0 (OD = 0.02) to 60 min (OD = 0.46).
With 50 μL of the induction period sample (a3, b3), the decrease of sMSC-371 from 0 (OD = 1.66) to 60 min (OD = 0.36) is monitored, together with the increase of sMSC-417 from 0 (OD = 0.02) to 60 min (OD = 1.01).
When 100 μL of the induction period sample (a4, b4), sMSC-371 (OD = 2.39, 0 min) declined directly and reached a minimum OD value (OD = 0.64) at 30 min and changed little afterwards. Meanwhile, sMSC-417 increased to its maximum (OD = 1.80, 30 min) from the beginning (OD = 0.02).
For the two dispersions shown in Parts a3 and a4, the isosbestic points are at about 382 and 381 nm, and the ratios of the extinction coefficient of sMSC-371 to sMSC-417 are approximatively 1.66/1.01 = 1.64 and 2.39/1.80 = 1.33, respectively.
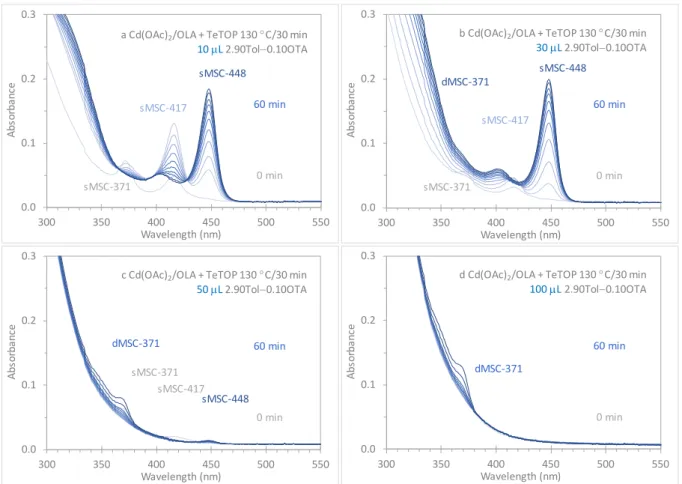
Figure S1b-a. In situ optical absorption spectroscopy exploring the development of
sMSC-371, sMSC-417, and sMSC-448 at room temperature. After synthesis, the 135 °C/10 min induction period sample was stored in four times Tol (by volume) at room temperature for 17 days; 0.15 mL of the Tol solution (with 30 µL of the induction period sample) was dispersed in 2.85 mL of a mixture consisting of 0.40 mL OTA. There are 97 spectra (recorded very 5 min for the period from 0 to 480 min) in Part a1; all the spectra shown in Parts a2 to
a4 are presented in Part a1. For the 0 to 30 min period, the spectra (recorded every 5 min) are shown in Part a2. For the 35 to 75 min period, the spectra (recorded every 5 min) are shown in Part a3. For the rest period of 80 to 480 min, the spectra (recorded every 20 min up to 120 min and then every 40 min up to 480 min) are shown in Part a4. It seems that the sequential changes from sMSC-371 to sMSC-417 (in an early stage of the first 30 min), and then from sMSC-417 to sSMC-448 (during the later stage of 80 to 480 min) took place. During the period of 30 to 80 min (a3), sMSC-417 changed little. This is worthy of notice.
0.0 0.6 1.2 1.8 300 350 400 450 500 550 Abs or ba nc e Wavelength (nm) 30 min 0 min sMSC-417
sMSC-371 a2 Cd(OAc)2/OLA + TeTOP
30 µL 135 °C/10 min 2.60Tol−0.40OTA 0.0 0.4 0.8 1.2 300 350 400 450 500 550 Abs or ba nc e Wavelength (nm) 75 min 35 min sMSC-417
a3 Cd(OAc)2/OLA + TeTOP
30 µL 135 °C/10 min 2.60Tol−0.40OTA 0.0 0.4 0.8 1.2 300 350 400 450 500 550 Abs or ba nc e Wavelength (nm) 480 min 80 min sMSC-448
a4 Cd(OAc)2/OLA + TeTOP
30 µL 135 °C/10 min 2.60Tol−0.40OTA sMSC-417 0.0 0.6 1.2 1.8 300 350 400 450 500 550 Abs or ba nc e Wavelength (nm) 480 min 0 min sMSC-417
sMSC-371 a1 Cd(OAc)2/OLA + TeTOP
30 µL 135 °C/10 min
2.60Tol−0.40OTA
sMSC-448
Figure S1b-b. In situ optical absorption spectroscopy exploring the development of
sMSC-371, sMSC-417, and sMSC-448 at room temperature. After synthesis, the 135 °C/10 min induction period sample was stored in four times Tol (by volume) at room temperature for 12 days; 0.15 mL of the Tol solution (with 30 µL of the induction period sample) was dispersed in 2.85 mL of a mixture consisting of 0.30 mL OTA. There are 97 spectra (recorded very 5 min for the period from 0 to 480 min) in Part b1; all the spectra shown in Parts b2 to
b4 are presented in Part b1. For the 0 to 10 min period, the spectra (recorded every 5 min) are shown in Part b2. For the 15 to 50 min period, the spectra (recorded every 5 min) are shown in Part b3. For the rest period of 60 to 480 min, the spectra (recorded every 20 min up to 120 min and then every 40 min up to 480 min) are shown in Part b4. The sMSC-371 to sMSC-417 and sMSC-417 to sMSC-448 changes seemed to be faster than those shown in
Figure S2b-a. The evolution of sMSC-417, accompanied with the decreasing of sMSC-371 which was generated immediately, only took place in first 10 min, and was stable to 35 min (b2). For the period from 10 to 50 min (b2 and b3), the sMSC-417 changed little. This is worthy of notice. In the period of 60 to 480 min (b4), an isosbestic point is observed at 430
0.0 0.5 1.0 1.5 300 350 400 450 500 550 Abs or ba nc e Wavelength (nm) 480 min 0 min sMSC-417 sMSC-371
b1 Cd(OAc)2/OLA + TeTOP
30 µL 135 °C/10 min
2.70Tol−0.30OTA
sMSC-448
nm, and sMSC-448 evolved into an almost single-ensemble form at 480 min.
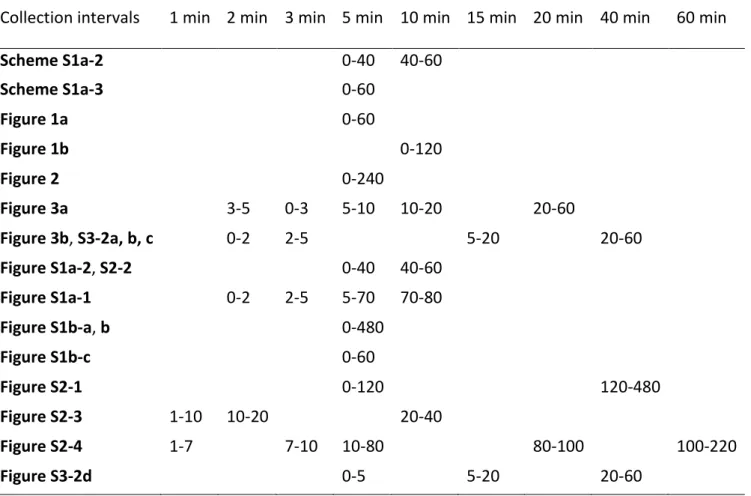
Figure S1b-c. In situ optical absorption spectroscopy exploring the development of
sMSC-371, sMSC-417, and sMSC-448 at room temperature. After synthesis, the 135 °C/10 min induction period sample was stored in four times Tol (in volume) at room temperature for 2 days; 0.15 mL of the Tol solution (with 30 µL of the induction period sample) was dispersed in 2.85 mL of a mixture consisting of 0.10 mL OTA. All the spectra collected (every 5 min) are presented in Part c1 for the period of 0 to 60 min. For the 35 to 60 min period, the spectra are shown in Part c2, during which sMSC-448 seemed to change little.
At 0 min, it seemed that sMSC-371, sMSC-417, and sMSC-448 coexisted. Immediately, sMSC-371 and sMSC-417 decreased and sMSC-448 increased. At 430 nm, an isosbestic point is detected (c1). After 35 min, sMSC-448 evolved in a single-ensemble form, and changed little up to 60 min monitored (c2).
0.0 0.3 0.6 0.9 300 350 400 450 500 550 Abs or ba nc e Wavelength (nm) 60 min 0 min sMSC-417 sMSC-371
c1 Cd(OAc)2/OLA + TeTOP
30 µL 135 °C/10 min 2.90Tol−0.10OTA sMSC-448 0.0 0.3 0.6 0.9 300 350 400 450 500 550 Abs or ba nc e Wavelength (nm) 60 min 35 min
c2 Cd(OAc)2/OLA + TeTOP
30 µL 135 °C/10 min
2.90Tol−0.10OTA sMSC-448
Figure S2-1. In situ optical absorption spectroscopy exploring the development of CdTe MSCs. After synthesis, the induction period sample (135 °C/10 min) was stored in four times Tol (by volume) at room temperature for 16 days; 0.15 mL of the Tol solution (with 30 µL of the induction period sample) was dispersed in 2.85 mL of a mixture consisting of 0.075 mL OTA. All the spectra shown in Parts b to d are presented in Part a for the period of 0 to 480 min. For the 0 to 40 min period, the spectra (recorded every 5 min) are shown in Part b. For the 45 to 115 min period, the spectra (recorded every 5 min) are shown in Part c. For the rest period of 120 to 480 min, the spectra (recorded every 40 min) are shown in Part d. At 480 min, a noticeable amount of sMSC-448 remained (which is more than that in Figure 2). The evolution of dMSC-371 seems to be slower than that shown in Figure 2.
At 0 min (b), sMSC-371 appeared (OD = 0.21), together with sMSC-417 (OD = 0.21) and sMSC-448 (OD = 0.07). It is noteworthy that there was no sMSC-371 detected in Figure 2, and the amount of sMSC-417 monitored seems to be larger than that in Figure 2, and the amount of sMSC-448 seems to be smaller than that in Figure 2. Afterwards up to 40 min, sMSC-371 and sMSC-417 decreased monotonically, while sMSC-448 increased monotonically,
S16 0.0 0.3 0.6 0.9 300 350 400 450 500 550 Abs or ba nc e Wavelength (nm) 480 min 0 min sMSC-417 dMSC-371
a Cd(OAc)2/OLA + TeTOP
135 °C/10 min 2.925Tol−0.075OTA sMSC-448 sMSC-371 0.0 0.3 0.6 0.9 300 350 400 450 500 550 Abs or ba nc e Wavelength (nm) 40 min 0 min sMSC-417 sMSC-371
b Cd(OAc)2/OLA + TeTOP
135 °C/10 min 2.925Tol−0.075OTA sMSC-448 0.0 0.3 0.6 0.9 300 350 400 450 500 550 Abs or ba nc e Wavelength (nm) 115 min 45 min dMSC-371
c Cd(OAc)2/OLA + TeTOP
135 °C/10 min 2.925Tol−0.075OTA sMSC-448 0.0 0.3 0.6 0.9 300 350 400 450 500 550 Abs or ba nc e Wavelength (nm) 480 min 120 min dMSC-371
d Cd(OAc)2/OLA + TeTOP
135 °C/10 min 2.925Tol−0.075OTA
an isosbestic point appeared at 430 nm, and single-ensemble sMSC-448 evolved, without the coexistence of sMSC-371 and sMSC-417.
In the period of 70 min from 45 to 115 min (c), the amount of sMSC-448 seemed to change little (OD = 0.42), but a tiny amount of dMSC-371 seemed to start evolving. In the period of 120 to 480 min (d), dMSC-371 grew (OD = 0.30), and sMSC-448 decreased but not disappeared (OD = 0.17, 480 min). The OD values are subtracted by the OD value at 470 nm. The evolution of dMSC-371 seems to be slower than that shown in Figure 2. The existence of ~70 min stable period for sMSC-448 is worthy of notice.
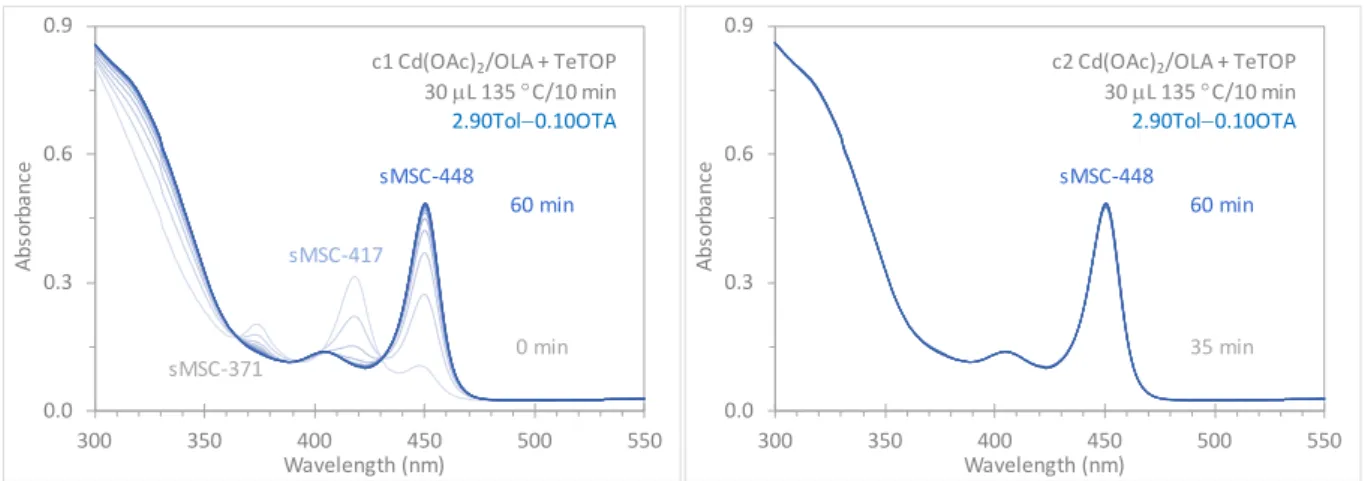
Figure S2-2. In situ optical absorption spectroscopy study of the evolution of the CdTe MSCs at room temperature from one induction periodsample (130 °C/30 min). The sample (10 (a), 30 (b), 50 (c), and 100 (d) µL) was dispersed in a mixture of 2.90 mL Tol and 0.10 mL OTA. For each of the four dispersions, there are 11 absorption spectra, which were recorded every 5 min up to 40 min and then every 10 min up to 60 min.
For Dispersion a with 10 µL of the induction period sample, the sequential evolutions
0.0 0.1 0.2 0.3 300 350 400 450 500 550 Abs or ba nc e Wavelength (nm) 60 min 0 min sMSC-417 sMSC-371
a Cd(OAc)2/OLA + TeTOP 130 °C/30 min
10 µL 2.90Tol−0.10OTA sMSC-448 0.0 0.1 0.2 0.3 300 350 400 450 500 550 Abs or ba nc e Wavelength (nm) 60 min 0 min sMSC-417 sMSC-371
b Cd(OAc)2/OLA + TeTOP 130 °C/30 min 30 µL 2.90Tol−0.10OTA sMSC-448 dMSC-371 0.0 0.1 0.2 0.3 300 350 400 450 500 550 Abs or ba nc e Wavelength (nm) 60 min 0 min dMSC-371 sMSC-371
c Cd(OAc)2/OLA + TeTOP 130 °C/30 min 50 µL2.90Tol−0.10OTA sMSC-448 sMSC-417 0.0 0.1 0.2 0.3 300 350 400 450 500 550 Abs or ba nc e Wavelength (nm) 60 min 0 min dMSC-371
d Cd(OAc)2/OLA + TeTOP 130 °C/30 min 100 µL2.90Tol−0.10OTA
from sMSC-371 to sMSC-417 and sMSC-448 are observed. At 60 min, sMSC-448 existed in a single-ensemble form.
For Dispersion b with 30 µL of the induction period sample, the sequential evolutions from sMSC-371 to sMSC-417 and sMSC-448 are observed also. At 60 min, sMSC-448
dominated, together with a tiny amount of dMSC-371. It is worthy of notice that sMSC-371 and sMSC-417 were present at 0 min but with quite small amounts; even after their
complete disappearance, the strength of sMSC-448 kept increasing.
For Dispersion c with 50 µL of the induction period sample, the evolution of a small amount of sMSC-417, sMSC-448 and dMSC-371 seemed to occur in sequence (c). At 60 min, a tiny amount of sMSC-448 dominated and dMSC-371 coexisted.
For Dispersion d with 100 µL of the induction period sample, the evolution of a small amount of dMSC-371 does not seem to involve the other three types of sMSCs, similar to what was reported.19
Figure S2-3. In situ optical absorption spectroscopy exploring the development of dMSC-371. After synthesis, the 130 °C/30 min induction periodsample was stored in five times Tol (by volume) at room temperature for 1 day; 0.15 mL of the Tol solution (with 25 µL of the
0.0 0.4 0.8 1.2 300 350 400 450 500 550 Abs or ba nc e Wavelength (nm) 40 min 0 min sMSC-448 dMSC-371
a Cd(OAc)2/OLA + TeTOP 130 °C/30 min 2.775Tol−0.20BTA sMSC-417 sMSC-371 0.0 0.3 0.6 0.9 300 350 400 450 500 550 Abs or ba nc e Wavelength (nm) 8 min 0 min sMSC-448 dMSC-371
b Cd(OAc)2/OLA + TeTOP 130 °C/30 min 2.775Tol−0.20BTA sMSC-417 sMSC-371 0.0 0.3 0.6 0.9 300 350 400 450 500 550 Abs or ba nc e Wavelength (nm) 20 min 9 min sMSC-448 dMSC-371
c Cd(OAc)2/OLA + TeTOP 130 °C/30 min 2.775Tol−0.20BTA 0.0 0.4 0.8 1.2 300 350 400 450 500 550 Abs or ba nc e Wavelength (nm) 40 min 30 min dMSC-371
d Cd(OAc)2/OLA + TeTOP 130 °C/30 min 2.775Tol−0.20BTA
induction period sample) was dispersed in 2.85 mL of a mixture consisting of 0.20 mL BTA. All the spectra shown in Parts b to d are presented in Part a for the period of 0 to 40 min. For the 0 to 8 min period, the spectra (recorded every 1 min) are shown in Part b. For the 9 to 20 min period, the spectra (recorded at 9, 10 min and then every 2 min) are shown in Part c. For the rest period of 30 to 40 min, the spectra (recorded every 10 min) are shown in Part d.
At 0 min, the presence of sMSC-371 (with the apparent OD = 0.16 at 371 nm) and sMSC-417 (OD = 0.44) was monitored (a). In the first 8 min period (b), sMSC-371 and sMSC-417 decreased, together with the increase of both sMSC-448 (OD = 0.15) and dMSC-371 (OD = 0.38).
For the period of 9 to 20 min (c), dMSC-371 kept increasing, accompanied by a decrease of sMSC-448. It is worthy of notice that, the amount of sMSC-448 decreased was relatively small, while that of dMSC-371 increased was relatively large.
For the period of 30 to 40 min (d), dMSC-371 (OD = 0.65) evolved into a
single-ensemble form without the coexistence of the other three types of sMSCs, and changed little. The OD values are subtracted by the OD value at 470 nm.
With the use of BTA instead of OTA, the evolution of dMSC-371 into a single-ensemble form occurred in the period from 30 to 40 min, with the presence of sMSC-317, sMSC-417, and sMSC-448 before 30 min.
Figure S2-4. In situ optical absorption spectroscopy exploring the development of dMSC-371. After synthesis, the 130 °C/30 min induction period sample was stored in five times Tol (by volume) at room temperature for 1 day; 0.15 mL of the Tol solution (with 25 µL of the
0.0 0.4 0.8 1.2 300 350 400 450 500 550 Abs or ba nc e Wavelength (nm) 220 min 0 min sMSC-417
dMSC-371 a Cd(OAc)2/OLA + TeTOP
130 °C/30 min 2.675Tol−0.30BTA 0.0 0.4 0.8 1.2 300 350 400 450 500 550 Abs or ba nc e Wavelength (nm) 55 min 0 min sMSC-417
dMSC-371 b Cd(OAc)2130 °C/30 min/OLA + TeTOP
2.675Tol−0.30BTA sMSC-371 0.0 0.4 0.8 1.2 300 350 400 450 500 550 Abs or ba nc e Wavelength (nm) 220 min 60 min
dMSC-371 c Cd(OAc)2/OLA + TeTOP
130 °C/30 min 2.675Tol−0.30BTA
induction period sample) was dispersed in 2.85 mL of a mixture consisting of 0.30 mL BTA. All the spectra shown in Parts b to c are presented in Part a for the period of 0 to 220 min. For the 0 to 55 min period, the spectra (recorded every 1 min to 5 min, and at 7 and 10 min, then every 5 min to 55 min) are shown in Part b. For the 60 to 220 min period, the spectra (recorded every 50 min to 80 min, then every 10 min to 100 min, then every 60 min to 220 min) are shown in Part c.
At 0 min (b), the presence of both sMSC-371 (OD = 0.55) and sMSC-417 (OD = 0.21) was monitored. During the period up to 55 min (b), sMSC-417 decreased and disappeared almost completely. The peak at ~374 nm increased a little bit (OD = 0.85) (with a tiny degree of blue shift to 373 nm), together with the increase of a peak at ~350 nm (OD = 0.51). Thus, it seems that sMSC-371 disappeared also, while dMSC-371 evolved. During the period of 60 to 220 min (c), dMSC-371 seemed to be stable. At 220 min, OD350 = 0.63, OD371 = 0.90.
Interestingly, the evolution of dMSC-371 seemed to be at the cost of sMSC-371 and sMSC-417, which does not seem to involve sMSC-448. The OD values were reduced by the OD value at 450 nm.
Figure S3-1. The background subtracted time-dependent absorbance at 448 nm for Figure 3, with light and dark blue circles for Dispersions a and b of 0.01 and 0.02 mL methanol,
respectively. The light and dark lines are for eye guidance. The absorbance at 480 nm was used as background, which is subtracted.
0.00 0.13 0.26 0.39 0 10 20 30 40 50 60 Abs or ba nc e
Dispersion period (min)
0.02Methanol
0.01Methanol
Figure S3-2. Temporal evolution of optical absorption from the induction period sample (130 °C/30 min, 25 µL) dispersed in four mixtures of Tol and ROH. After synthesis, the sample was stored in five times Tol (by volume) at room temperature for 4 days; 0.15 mL of the Tol solution (with 25 µL of the induction period sample) was dispersed in 2.85 mL of the mixtures of Tol and ROH consisting of 0.02 mL of methanol (a), ethanol (b), hexanol (c), and decanol (d). For each dispersion, there are five absorption spectra collected at 1, 2, 5, 20 and 60 min.
For the use of methanol (a), at 1 min, sMSC-448 evolved with the value of OD = 0.24; at 60 min, OD = 0.27. For the use of ethanol (b), sMSC-448 increase from OD = 0.09 at 1 min to 0.18 at 60 min. For the use of hexanol (c), a small amount of sMSC-448 developed at 60 min (OD = 0.10). For the use of decanol (d), a tiny amount of sMSC-448 developed at 60 min (OD = 0.05). The OD values are subtracted by the OD value at 480 nm.
The shorter the alkyl chain of one alcohol, the more sMSC-448 developed (at 60 min), and the equilibria of PC ⇔ PC-s448 ⇔ sMSC-448 are weighted more to the right.
0.0 0.2 0.4 0.6 300 350 400 450 500 550 Abs or ba nc e Wavelength (nm) 60 min 0 min sMSC-448
a Cd(OAc)2/OLA + TeTOP 130 °C/30 min
2.83Tol−0.02Methanol 0.0 0.1 0.2 0.3 300 350 400 450 500 550 Abs or ba nc e Wavelength (nm) 60 min 0 min sMSC-448
b Cd(OAc)2/OLA + TeTOP 130 °C/30 min
2.83Tol−0.02Ethanol 0.0 0.1 0.2 0.3 300 350 400 450 500 550 Abs or ba nc e Wavelength (nm) 60 min 0 min sMSC-448
c Cd(OAc)2/OLA + TeTOP 130 °C/30 min
2.83Tol−0.02Hexanol 0.0 0.1 0.2 0.3 300 350 400 450 500 550 Abs or ba nc e Wavelength (nm) 60 min 0 min sMSC-448
d Cd(OAc)2/OLA + TeTOP 130 °C/30 min
2.83Tol−0.02Decanol
Figure S3-3. The background subtracted time-dependent absorbance at 448 nm for Figure S3-2. The absorbance at 480 nm was used as background, which is subtracted.
0.00 0.13 0.26 0.39 0 10 20 30 40 50 60 Abs or ba nc e
Dispersion period (min)
0.02Methanol
0.02Ethanol 0.02Hexanol 0.02Decanol
Figure S3-4. In-situ optical absorption spectroscopy for one induction sample dispersed in
two dispersions containing 2.50 mL Tol and 0.01 mL methanol. For one dispersion (a), the spectra were recorded every 3 min up to 12 min; there was little change during 6 to 12 min, regarding sMSC-448. For the other dispersion (b), after the 2nd spectrum was collected at 3 min, 0.50 mL OTA was added. The evolution of sMSC-371 and sMSC-417, together with a small amount increase of sMSC-448 (during 6 to 12 min) suggests that there was a certain amount of the precursor compound in Dispersion a (after 3 min), which could evolve to the other two types of sMSCs. This observation supports our hypothesis (shown in Scheme 1e) that the transformation between two types of precursor compounds is the rate-determining step for the changes detected for corresponding two types of MSCs.
Scheme S1-1. Schematic drawing of our comprehension for the very observation presented in Figures S1b-a and S1b-b. A relatively stable period for sMSC-417exists (middle part) after the disappearance of sMSC-371 (left part by Step 2) and prior to the significant development of sMSC-448 (right part by Step 7). The PC-s417 to PC-s448 transformation (Step 6) took place so slowly that for a while, the PC-s417 ⇔ sMSC-417 equilibrium changed little.
Scheme S1-2. Schematic drawing of our comprehension for the very observation presented in Figures 2 and S2-1. A relatively stable period for sMSC-448 exists (middle part) after the disappearance of sMSC-371 and/or sMSC-417 (left part by Step 5) and prior to the significant development of dMSC-371 (right part by Step 10). The PC-s448 to PC-d371 transformation (Step 9) took place so slowly that for a while, the PC-s448 ⇔ sMSC-448 equilibrium changed little.
Scheme S1-3. Schematic drawing of our comprehension for the very observation presented in Figure S2-2b. A significant amount of sMSC-448 evolved after the disappearance of sMSC-371 and sMSC-417. In the initial stage, sMSC-371, sMSC-417, and sMSC-448 were produced via the transformations of their corresponding PCs (via Steps 1, 4, and 7,
respectively). Meanwhile, Step 3 PC-s371 to PC-s417 and Step 6 PC-417 to PC-s448 occurred. The evolution of sMSC-448 (left part Step 7) enhanced Steps 2 and 5 (left part). sMSC-371 and sMSC-417 disappeared (right part), while Step 3 PC-s371 to PC-s417 and Step 6 PC-417 to PC-s448 continued, which resulted in the continuous evolution of sMSC-448, in the absence of sMSC-371 and sMSC-417.