HAL Id: hal-02130614
https://hal.archives-ouvertes.fr/hal-02130614
Submitted on 15 May 2019
HAL is a multi-disciplinary open access
archive for the deposit and dissemination of
sci-entific research documents, whether they are
pub-lished or not. The documents may come from
teaching and research institutions in France or
abroad, or from public or private research centers.
L’archive ouverte pluridisciplinaire HAL, est
destinée au dépôt et à la diffusion de documents
scientifiques de niveau recherche, publiés ou non,
émanant des établissements d’enseignement et de
recherche français ou étrangers, des laboratoires
publics ou privés.
DETAILED ANALYSIS OF SINGLE BIOMASS
PARTICLE COMBUSTION BY SHADOWGRAPHY
Hassan Mohanna, Jean-Michel Commandre, Bruno Piriou, Gilles Vaitilingom,
Benoît Taupin, David Honoré
To cite this version:
Hassan Mohanna, Jean-Michel Commandre, Bruno Piriou, Gilles Vaitilingom, Benoît Taupin, et al..
DETAILED ANALYSIS OF SINGLE BIOMASS PARTICLE COMBUSTION BY
SHADOWGRA-PHY. 9th European Combustion Meeting, Apr 2019, Lisbonne, Portugal. �hal-02130614�
DETAILED ANALYSIS OF SINGLE BIOMASS PARTICLE COMBUSTION BY
SHADOWGRAPHY
Hassan MOHANNA
1-3*, Jean-Michel COMMANDRE
1,
Bruno PIRIOU
1, Gilles VAITILINGOM
1, Benoit TAUPIN
2, David HONORE
3 1 CIRAD UPR BioWooEB, 34398 Montpellier, France2 Veolia Recherche et Innovation (VeRI), 78520 Limay, France
3 Normandie Univ, INSA Rouen, UNIROUEN, CNRS, CORIA, 76000 Rouen, France
Abstract
An experimental study of single particle combustion is performed on a high temperature particle reactor. The particle degradation is monitored by simultaneous high magnification direct and shadowgraph imaging techniques giving access to the full behaviour of the particle even when enveloped by a flame. This allows tracing the time-resolved evolution of the particle shadow during its degradation as a function of its burnout. The new method provides the process timeline, especially the onset of the heterogeneous oxidation even during the flame phase. It is observed to occur earlier for larger particles containing lower volatile matter. The latter occupies around 40% of the initial particle shadow, which decreases with devolatilisation progress following a power trend. The char burns at the surface and then switches to internal combustion leaving an ash matrix. Effects of particle size and torrefaction levels on the different steps of particle combustion are pointed out.
Introduction*
In the view of the polluting role of coal, incorporating a fraction of biomass into coal in pulverized burners can be an effective environmental strategy. However, this significantly modifies the functionality of the installations considering the different combustion behaviour of biomass at particle and flame level [1]. The scientific effort to understand the combustion of biomass is rather new compared to coal, and more research is required to improve the available technology.
Single particle reactors are successfully employed for coal in literature while fewer studies dealt with biomass. The experimental rigs consist basically of a heated chamber in which a particle is introduced at high temperature to record its degradation. The particle can be suspended on a fixed support or in a free stream. This kind of experiments is necessary to validate the theoretical concepts describing the phenomena and to examine the related parameters of the process conditions.
Lu et al. [2] demonstrated in such experiment that shape and aspect ratio differences show measurable differences in pyrolysis rates. Schiemann et al. [3], [4] also concluded to the same result using a new stereoscopic pyrometer to measure the particle temperature and shape at the same time in a laminar flow reactor. Momeni et al. [5] reported that the ignition delay of a stationary particle is clearly influenced by the oxygen concentration. Similar aspects were assessed by Houshfar et al. [6] using gas emissions of single particles. These results serve to translate the combustion stage into empirical expressions that can be integrated in physical models [2], [7], [8]. Beside the combustion behaviour, some studies examined the impact of fuel pre-treatment. Lu
*
Corresponding author: [email protected]
Proceedings of the European Combustion Meeting 2019
et al. [9] pointed out that torrefaction shortens the devolatilization time while increases the char yield and density. Riaza et al. [10] also reported that increasing oxygen mole fraction reduces the surrounding flame luminosity.
The objective of this study is to provide additional insight to the combustion timeline of a single particle of biomass using imaging techniques. Direct visible imaging is performed to visualize particle combustion. Moreover, shadowgraphy is employed to trace the particle volume and shape evolution. Incorporating both techniques with the temperature measurement provides fundamental data on the events corresponding to each involved phenomenon. The investigation examines the impact of torrefaction and particle size on the combustion behaviour.
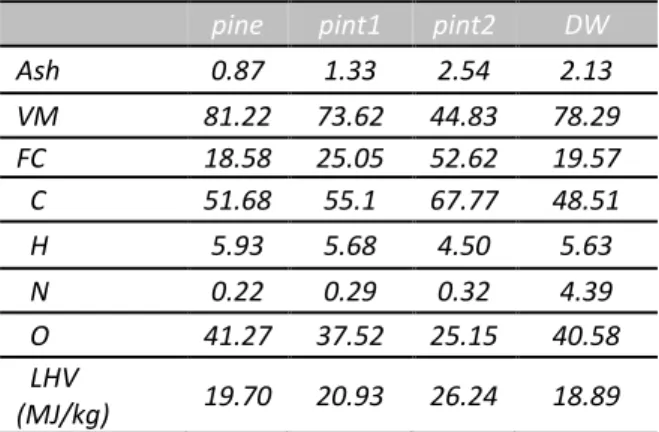
Table 1: Fuel composition analysis (%db)
pine pint1 pint2 DW
Ash 0.87 1.33 2.54 2.13 VM 81.22 73.62 44.83 78.29 FC 18.58 25.05 52.62 19.57 C 51.68 55.1 67.77 48.51 H 5.93 5.68 4.50 5.63 N 0.22 0.29 0.32 4.39 O 41.27 37.52 25.15 40.58 LHV (MJ/kg) 19.70 20.93 26.24 18.89
1. Fuel composition and properties
The fuels are selected in the purpose of investigating the volatile matter (VM) content influence on the combustion process. Pine is torrefied at 280 °C for 25 min to produce pint1 and at 450 °C for 15 min to produce pint2. Demolition wood (DW) is also used as representative of problematic fuel. The
2
proximate and ultimate analyses of the fuel are listed in Table 1 (ASTM norm).The size of the particles is in the range 0.5 and 1.5 mm possessing different aspect ratios and their mass is up to maximum 3 mg. Pine particles are mostly flake-like while torrefied pine are between cylindrical and spherical particles. Demolition wood particles are mostly thick flakes made of small compressed fragments of wood. Besides, totally carbonized pine (denoted pinc) (VM ~ 0) is tested aiming to study the influence of the presence of volatiles.
2. Experimental methods
2.1. Single particle combustion apparatus
An experimental apparatus is designed to shadow images of a solid particle during its thermal conversion. The setup (Figure 1) consists of a 12 x 13 x 14 cm3 heated combustion chamber fixed on a horizontal bench alongside with two cameras and a LED lamp. The chamber is electrically heated to a set point of 800 °C maximum and maintained at the set temperature with the help of an isolation layer. Two optical windows are situated on opposite sides of the chamber. These 3cm-dia. windows beside the small sizes of the cameras were sufficient to place both of them on the same side [11]. The monochrome camera (Sony XCD-SX90) for shadowgraphy imaging is equipped with Navitar precise eye lens, 0.25x lens attachment to increase the working distance, and 2.0x adapter producing suitable magnification (0.4 µm/pixel). The camera is adjusted to capture images (850x850 pixel²) at 37 fps with 0.2 ms exposure time. Another camera (MicroCapture) records at 30 fps direct emission images (352x288 pixel²) with an optical zoom of 85.2µm/pixel. Both cameras are held at a fixed distance from the particle position to achieve a consistent optical magnification. The background is lighted with a collimated illumination generated by a LED lamp on the same axis of the particle for shadowgraphy measurements. The advantage of shadowgraphy technique is that it can surpass the flame barrier during the combustion of volatiles and access the full particle shape and volume evolution with time that is not available with usual direct visible imaging techniques.
3.2. Methodology
The samples are dried for 24 hours before every experiment considering the high variation in moisture content (Moisture: 13% pint2, 1.9% pint1), which can hugely influence the particles behaviour and ignition delay. A significant number of particles (>30) is tested to reduce the deviations and determine
better the trends and average values.
Prior to an experiment, a particle is glued to the tip of a 25 µm thermocouple measuring the surface temperature at a temporal frequency of 12 Hz. Experimental tests carried out in TGA show that the glue addition has a non-significant influence on biomass particles combustion behaviour. Once the chamber attains and stabilizes at the experiment temperature, the particle is inserted quickly to the hot medium by the help of a guiding rod. The particle position is adjusted to be always in the field of view of both cameras during the whole process.
3.3. Analysis of simultaneous time-series of images
Shadowgraph monochrome images are binarised in order to facilitate the detection of the particle contours. The background is subtracted using the rolling ball algorithm [12]. In the progress of its combustion, the particle luminosity changes after the flame extinguish due to char radiation. Therefore, it is necessary to apply a threshold method for the flame stage followed by another for the char combustion part. The images are then processed by a contour detection program capable of generating the evolution curve of the projection area of the particle as a function of time [13]. The code can detect the thermocouple and subtract it from the calculation. In order to subtract the glue area and eliminate the sensitivity of the thresholding process, the curves were then rectified by manually integrating several points on each curve and account for the error. The two image series and the thermocouple data are zeroed at the insertion moment in order to have a synchronicity between the temporal data. Superposition of the data helps to identify the events associated with each phenomenon. Moreover, superposing both imaging techniques provides the moment of the onset of heterogeneous combustion even during the flame phase. In fact, the combustion sub-processes occur simultaneously at high heating rates, but the overlap of homogenous and heterogeneous combustion is difficult to evaluate experimentally. However, using shadowgraphy the particle can be monitored throughout the whole combustion experiment. The moment oxygen attacks the char surface is associated with a slight brightness at that position. The luminosity is so clear after the flame is completely extinguished but it can be traced back to its onset during the flame period, while the flame still appears to radiate on the direct visible images at the same time. The increase in intensity at the char surface is assumed to be the heterogeneous
MicroCapture Sony XCD-SX90 +
Navitar precise eye Heated chamber
(cross section)
LED
Particle on the thermocouple
3
ignition moment where the intensity continues to increase afterwards. Once identified, the time difference until the flame extinguishes is defined as the homo-hetero overlap.
4. Results and discussion
4.1. Visual observation of the combustion
A general trend of particle behaviour is observed for biomass. A typical size evolution of a biomass particle with time is presented Figure 2 and Figure 3
with a series of images and the corresponding time evolution of particle area. After its insertion to the hot zone, a series of events is triggered. The particle swells for a certain moment due to the increasing pressure of volatiles inside it. The swelling coefficient depends on the biomass type (pin>pint1>>pint2). The swelling is followed by a flame accompanied by rapid decrease in particle size due to the liberation of volatiles that rapidly react to produce the surrounding flame with characteristics dependent on the VM content within the particle. The flame intensity and size increases with time and then shrinks back until its extinction.
Figure 2: Particle combustion events
Around 40% of the initial projection area is lost during this step, which is the area originally occupied by the volatile content. Particle consumption slows down after the flame extinguishes. The char becomes bright glowing red by the effect of carbon oxidation. At first, the particle shrinks with the luminous region signifying the oxidation at the surface of the particle. A point of separation between the reaction zone (bright zone) and the external area is detected (denoted as reaction zone shrinks in Figure 2). The reaction front continues to travel inside the particle (internal combustion) leaving a dark ash zone behind until the complete burnout. The heterogeneous reaction zone curve in Figure 3 follows the bright zone that separates at a certain moment from the external area curve. The result is a hollow particle of ash that swells sometimes at the end. Fragmentation of the particle is also sometimes observed especially for DW.
4.2. Temperature-time history of biomass particles Similar to area evolution, a trend of temperature
Figure 3: Typical size evolution of biomass with time
Figure 4: Temperature variation of biomass particle during
combustion with corresponding events (1-5) detailed in 4.2
profile is observed for biomass during their burnout history. Figure 4 presents the temperature and its derivative (dT/dt) with time which is the result of the energy balance of the particle. The insertion is at t=0 in synchronicity with images recordings.
The temperature derivative peaks at three events: upon insertion and rapid heating, maximum flame size, and flame extinguish. The flame was detected visually in the two images series, when the volatile cloud around the particle is lit, and by the sudden increase in the surface temperature profile giving the ignition temperature (1). The second peak (2) corresponds to the devolatilisation peak where dT/dt decreases afterwards due to lower volatile emission rate. This is also obtained in TGA experiments by the DTG peak and oxygen consumption peak [14]. The peak value declines with increasing particle mass, which suggests that lighter particles undergo intense pyrolysis. dT/dt reduction arrives to a local minimum (3), which coincides with the heterogeneous ignition detected by the previously mentioned technique. The char combustion heats the particle. Once the volatile flame quenches, the heat production is reduced, and the particle temperature starts decreasing, whence the second chute. This peak is attributed to the flame extinguish (4). Sometimes a shorter overlap between the volatile and char combustion makes this peak less pronounced. A significant difference between the wall and particle temperatures reverses the heat flow direction after the particle reaches its maximum temperature. Subsequently, a balance is established between the energy production and loss until the
0 2 4 6 8 10 0 1 2 3 4 5 6 7 A re a (p ix el ² x10000) Time (sec) External area Heterogeneous reaction zone -150 50 250 450 650 850 1050 0 2 4 6 [° C ], [ °C /se c] time(sec) T (°C) dT/dt (°C/sec) 1 2 3 4 5
Insertion Swelling and
flame Flame extinguish Char oxidation (bright) Reaction zone shrinks End Flame end Flame ignition Internal combustion burnout Hetero. ignition
4
complete burnout, which is characterized by a third chute (5) with no more energy production. The temperature then stabilizes at the chamber temperature (800°C).
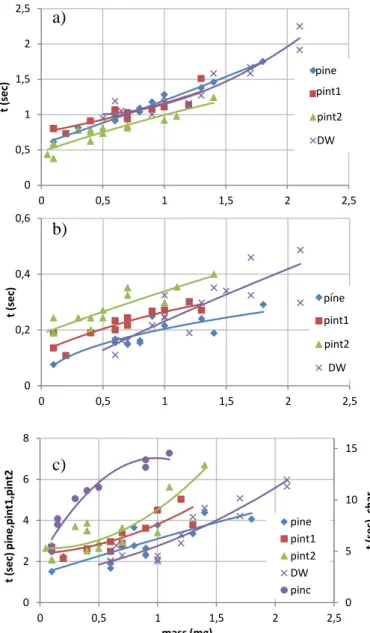
4.3. Combustion durations 4.3.1. Volatile flame duration
Figure 5,a plots the flame duration as a function of
the particle mass. The trend is logical since more volatiles require more time to burn [15]. Beside, bigger particle’s temperature rises slower than finer particle’s at the same heating conditions. This slows down the devolatilisation rate. However, little to no difference is detected between the flame durations of different fuel types. Only, pint2 flame duration appears shorter than the other flames due to relatively poor volatile content. Akinrinola et al. [16] reported a similar result of close flame duration for raw and torrefied Nigerian biomass. It was reported longer by 10-15% in the torrefied state for Miscanthus and Beechwood in [17]. The authors attributed that to the increasing influence of the catalytic metals in the fuels. It is also possible that the new pores created during torrefaction facilitate the emission of volatiles. In this case, the flux of volatile emission is lower for the treated biomass, which elongates the emission time for the same amount of volatiles in their raw counterparts.
4.3.2. Homo-hetero combustion overlap
The overlap of flame combustion and char combustion is introduced in Figure 5,b. Note that the points only represent the particles that their heterogeneous ignition coincides with the local minimum in the temperature derivative curve. In other cases, the difference between the luminosity detection and the local minimum for some particles may be addressed by the fact that the ignition may be triggered from the backward side of the particle so that the minimum dT/dt appears earlier than predicted by the rear view. The maximum overlap was obtained for DW with 0.48 sec for a 2.1 mg particle. On the other hand, a 0.1 mg pine particle had the minimum overlap of 0.076 sec. The heterogeneous ignition occurs earlier for larger particles containing lower volatile content, and thus increases the overlap duration. When the particle is surrounded by flame, the temperature is high enough for the heterogeneous ignition to happen. The ignition of carbonized pine starts at significantly lower temperatures. Nonetheless, the delay is caused by the lack of oxygen at the surface. This may occur early for a particle in a free stream where the motion of the irregularly shaped particle may expose an edge to the hot stream out of the spherical flame envelope. Mock et al. [18] in these conditions observed overlap taking place in the last 40% of the flame duration for coffee waste and sewage sludge particles (150-215 µm). On the other hand, the more spherical treated wood experienced a relatively short overlap (9% of flame
Figure 5: Combustion durations: a) flame; b) overlap; c)
burnout
duration). However, for a stationary particle in the current study, the char undergoes ignition while enveloped by a flame. Therefore, the ignition here is controlled by the diffusion of oxygen to the surface through the volatile cloud without being consumed or diverted away. Larger particles with more surface area receive more oxygen than smaller ones. This explains why larger particles of the same fuel present higher overlap. The same analysis may apply in explaining why the overlap increases with the torrefaction degree. Torrefaction reduces the particle density so that a raw particle of the same mass as a torrefied one has larger size, and thus higher overlap. Moreover, the outward flow of volatile matter seems to obstruct the molecular diffusion of oxygen towards the particle surface. Results show that the volatile flow tends to be more intense with smaller particles and with more VM. Therefore, the probability of oxygen passing the volatile cloud to react with the char is lower for smaller particles and for higher VM
0 0,5 1 1,5 2 2,5 0 0,5 1 1,5 2 2,5 t (s e c) pin pint pinc bb pint1 pint2 pine DW 0 0,2 0,4 0,6 0 0,5 1 1,5 2 2,5 t (s e c) pin pint pinc bb pint1 pint2 pine DW 0 5 10 15 0 2 4 6 8 0 0,5 1 1,5 2 2,5 t (s e c), char t (s e c) pi ne ,pi nt 1, pi nt 2 mass (mg) pine pint1 pint2 DW pinc
a)
b)
c)
5
content so that the probability of ignition is lower.
4.3.3. Burnout time
The higher interference between the flame phase and char combustion phase shortens the total burnout duration. Figure 5,c shows the total burnout duration of each biomass. An increasing tendency of combustion duration versus mass is measured for all fuels. Lower volatile content favours longer combustion duration since more fixed carbon is retained in the char for the torrefied biomass caused by the increase in C-C bonds during the decomposition of the lignocellulose component. Yet, the 45% reduction of VM for pint2 does not lead to a significant difference with pine and pint1 as expected. This is attributed to the higher interference between the two combustion phases and to the improved catalytic effect of ash in both torrefied fuels due to higher ash content. The role of volatile matter in accelerating the combustion is evident that the carbonized pine (pinc) takes up to three times more time to complete its oxidation. On top of rapid combustion of VM in the surrounding flame, volatile ejection deforms the particle and creates new pores in the char structure enhancing its reactivity.
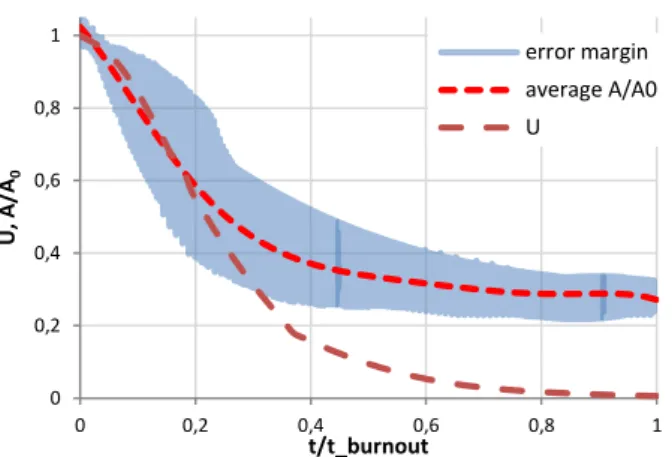
4.4. Evolution of the projection area
The evolution of the projection area gives an indication of the particle size evolution assuming homogeneous and isotropic behaviour. In order to compare the area evolution of different particles, the projection area is normalized by the initial projection area (at t=0) versus the normalized combustion time t/t_burnout where t_burnout is the total combustion duration of each fuel type. On the other hand, the unburnt fraction (𝑈 = 1 − 𝑐𝑜𝑛𝑠𝑢𝑚𝑒𝑑 𝑚𝑎𝑠𝑠/ 𝑖𝑛𝑖𝑡𝑖𝑎𝑙 𝑚𝑎𝑠𝑠) is also traced versus the normalized combustion time. The unburnt fraction is obtained from combustion experiments of the samples performed in a horizontal batch reactor at the same temperature (800°C), where similar combustion events and durations are observed. Figure 6 shows the normalized area (A/A0) of pine particles and their
average with the unburnt fraction (U) of pine vs the corresponding normalized time of each parameter. The procedure is repeated for every particle and the result is the average of all curves. The coefficient of determination (R²) is higher than 0.9 for all fuel types. The variations between the particles are more pronounced during the char combustion. Nevertheless, high similarity is found during the flame phase. The average curves of each fuel are in
Figure 7. The rupture of each curve is the separation
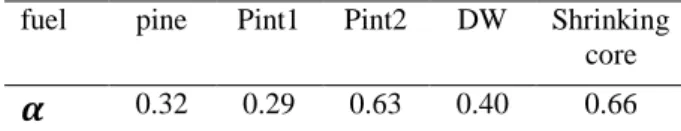
point of the flame and char phase (dashed lines). 44%, 37%, 40% and 46% of the initial projected area for pine, pint1, pint2 and DW respectively are lost during the flame phase. The curves follow a power trend (𝐴 = 𝐴0𝑈𝛼) for the flame part where α is the
power coefficient summarized in Table 2 for each fuel. It is noticeable that it gets higher with lower VM
content except for torrefied pine. The table also includes the shrinking core model for char combustion that assumes a constant particle density during char combustion. According to the model, char oxidation occurs in a diffusion controlled process.
Figure 6: Normalized area (A/A0) and unburnt fraction (U)
vs the normalized combustion time of pine
Figure 7: Projection area evolution as a function of the
unburnt fraction of all fuels (reversed U axis)
Figure 8: Comparison between experimental char
evolution and shrinking core model (reversed Uc axis)
The model depicts well the evolution of the reaction zone rather than the particle volume. DW char is the closest to the model as it undergoes fragmentation during its oxidation and leaves little to no ash matrix after the complete burnout. However, the other fuel
0 0,2 0,4 0,6 0,8 1 0 0,2 0,4 0,6 0,8 1 U , A /A 0 t/t_burnout error margin average A/A0 U 0 0,2 0,4 0,6 0,8 1 0 0,2 0,4 0,6 0,8 1 A /A 0 U pin pint pinc DW pint1 pint2 pine 0,0 0,2 0,4 0,6 0,8 1,0 0,0 0,2 0,4 0,6 0,8 1,0 A /A 0 Uc shrinking core char pinepinc
6
chars follow the carbonized pine profile given in
Figure 8. The curve totally represents char oxidation
in comparison with the shrinking particle model as a function of the unburnt char fraction (Uc is the ratio of the remaining carbon to the fixed carbon content).
Table 2: Exponent of power trend of area evolution
fuel pine Pint1 Pint2 DW Shrinking core
𝜶
0.32 0.29 0.63 0.40 0.66 The model is fairly correct at the beginning of the char combustion but the data diverge later at the point of separation of the two curves in Figure 3 to an approximately constant volume as the combustion progresses. Carbon is reacting with small variation of the external volume that ends with 33% to 39% of the initial projection area after the complete burnout of all the fuel types except for DW with low ash residue. Higher ash content accounted for larger ash matrix at the end. The char was sometimes swelling in the course of its oxidation. This is obvious in the curve of carbonized pine that increases at the end and then shrinks again to 56% of its original shadow. The swelling is probably caused by trapped volatiles in the ash matrix (most likely lignin volatiles) that are liberated at the end because of the build-up pressure. Ejections of particle fragments are also observed at the end when the particle swells. The phenomenon is notable for pint1 and it can be spotted by the rapid increase in the slope of torrefied pine size as U approaches zero. Assuming spherical particles and isotropic consumption, the particle volume can be directly evaluated from its projection area. Even with initial irregular particle shape which rapidly tend to disappear and becomes more rounded than the mother particle [17], [19].Conclusion
The combustion of single particles of raw and torrefied biomass is studied using shadowgraphy and direct visible imaging techniques. The method is deemed successful for investigating the combustion events at the particle level. It gives insight to the phenomena occurring at the particle surface and around it during the whole process, including the onset of heterogeneous ignition and the volume evolution. The study verified the important role of the particle size and VM content in determining the combustion intensity and durations. Higher VM particles undergo intense devolatilisation for comparable durations as less volatile containing fuel. The flame duration appears to be more influenced by the particle size than the particle composition. This leads to more intense combustion for higher VM particles that obstructs the oxygen diffusion to the particle and delays the heterogeneous ignition. On the other hand, the char left is more reactive and burn faster than less VM particles. A particle with no VM
burns three times slower than its raw counterpart. The projection area evolution was traced versus the burnout using gas emission results. VM occupy around 40% of the initial particle shadow which decreases with devolatilisation progress following a power trend. The char follows the shrinking core model at first but diverges later to a constant ash volume. An empirical model of volume evolution obtained by shadowgraphy will be integrated in a 1-D solid combustion model developed and validated for different compositions and preparations of biomass.
Acknowledgments
The financial support of ANRT for H.Mohanna's PhD scholarship is acknowledged. Convention CIFRE - N° 2016/0523
References
[1] J. Riaza, J. Gibbins, and H. Chalmers, Fuel, vol. 202, pp. 650–655, Aug. 2017.
[2] H. Lu, E. Ip, J. Scott, P. Foster, M. Vickers, and L. L. Baxter, Fuel, vol. 89, no. 5, pp. 1156–1168, May 2010.
[3] N. Vorobiev and M. Schiemann, in 40th
International Technical Conference Clean Coal Fuel System, 2015.
[4] M. Schiemann, S. Haarmann, and N. Vorobiev,
Fuel, vol. 134, pp. 53–62, Oct. 2014.
[5] Maryam Momeni, Aalborg University, 2012. [6] E. Houshfar, L. Wang, N. Vähä-Savo, A. Brink,
and T. Løvås, CHEMIICAL ENGIINEERIING
Trans., vol. 35, pp. 613–618, 2013.
[7] P. E. Mason, L. I. Darvell, J. M. Jones, M. Pourkashanian, and A. Williams, Fuel, vol. 151, pp. 21–30, Jul. 2015.
[8] J. Brix, P. A. Jensen, and A. D. Jensen, Fuel, vol. 90, no. 6, pp. 2224–2239, Jun. 2011.
[9] Z. Lu, J. Jian, P. A. Jensen, H. Wu, and P. Glarborg, Energy & Fuels, vol. 30, no. 7, pp. 5772–5778, Jul. 2016.
[10] J. Riaza et al., Biomass and Bioenergy, vol. 64, pp. 162–174, May 2014.
[11] J. Andrzejewski, A. Charlet, P. Higelin, A. Sapinski, and G. Vaitilingom, French Patent numbre FR2694092 A1.
[12] Sternberg, Computer (Long. Beach. Calif)., vol. 16, no. 1, pp. 22–34, Jan. 1983.
[13] T. Daho et al., Biomass and Bioenergy, vol. 46, pp. 653–663, 2012.
[14] J. F. Saldarriaga, R. Aguado, A. Pablos, M. Amutio, M. Olazar, and J. Bilbao, Fuel, vol. 140, pp. 744–751, Jan. 2015.
[15] T. G. Bridgeman, J. M. Jones, I. Shield, and P. T. Williams, Fuel, vol. 87, no. 6, pp. 844–856, May 2008.
[16] F. S. Akinrinola, The University of Leeds, 2014. [17] A. Panahi, Y. A. Levendis, N. Vorobiev, and M.
Schiemann, Fuel Process. Technol., vol. 166, pp. 41–49, Nov. 2017.
[18] C. Mock, H. Lee, S. Choi, and V. Manovic,
Energy & Fuels, vol. 30, no. 12, pp. 10809–10822,
Dec. 2016.
[19] C. Meesri and B. Moghtaderi, Combust. Sci.