HAL Id: hal-00304737
https://hal.archives-ouvertes.fr/hal-00304737
Submitted on 1 Jan 2002HAL is a multi-disciplinary open access archive for the deposit and dissemination of sci-entific research documents, whether they are pub-lished or not. The documents may come from teaching and research institutions in France or abroad, or from public or private research centers.
L’archive ouverte pluridisciplinaire HAL, est destinée au dépôt et à la diffusion de documents scientifiques de niveau recherche, publiés ou non, émanant des établissements d’enseignement et de recherche français ou étrangers, des laboratoires publics ou privés.
recharge in Chalk catchments
R. B. Bradford, R. Ragab, S. M. Crooks, F. Bouraoui, E. Peters
To cite this version:
R. B. Bradford, R. Ragab, S. M. Crooks, F. Bouraoui, E. Peters. Simplicity versus complexity in mod-elling groundwater recharge in Chalk catchments. Hydrology and Earth System Sciences Discussions, European Geosciences Union, 2002, 6 (5), pp.927-937. �hal-00304737�
Simplicity versus complexity in modelling groundwater recharge
in Chalk catchments
R.B. Bradford1, R. Ragab1, S.M. Crooks1, F. Bouraoui2 and E. Peters3
1Centre for Ecology and Hydrology, Wallingford, OX10 8BB, UK
2Joint Research Centre,Institute for Environment and Sustainability, Via Fermi, 21020 Ispra (VA), Italy
3Wageningen University, Dept of Environmental Sciences, Nieuwe Kanaal 11, 6709 PA Wageningen,The Netherlands
Email for corresponding author: [email protected]
Abstract
Models of varying complexity are available to provide estimates of recharge in headwater Chalk catchments. Some measure of how estimates vary between different models can help guide the choice of model for a particular application. This paper compares recharge estimates derived from four models employing input data at varying spatial resolutions for a Chalk headwater catchment (River Pang, UK) over a four-year period (1992-1995) that includes a range of climatic conditions. One model was validated against river flow data to provide a measure of their relative performance. Each model gave similar total recharge for the crucial winter recharge period when evaporation is low. However, the simple models produced relatively lower estimates of the summer and early autumn recharge due to the way in which processes governing recharge especially evaporation and infiltration are represented. The relative uniformity of land use, soil types and rainfall across headwater, drift-free Chalk catchments suggests that complex, distributed models offer limited benefits for recharge estimates at the catchment scale compared to simple models. Nonetheless, distributed models would be justified for studies where the pattern and amount of recharge need to be known in greater detail and to provide more reliable estimates of recharge during years with low rainfall.
Keywords: Chalk, modelling, groundwater recharge
Introduction
The Chalk is the main aquifer in south-east England and the drift-free Chalk outcrop covers an area of nearly 10 000 km2. Reliable estimates of recharge are needed to develop
effective catchment management strategies that will help safeguard the groundwater resources as well as the high ecological value of rivers draining the Chalk outcrop. However, recharge estimates produced by recharge models are subject to uncertainty as the spatial and temporal variability in the different processes governing recharge to the Chalk aquifer are still poorly understood and inadequately quantified.
Recharge estimates in UK are often based on simple water balance models, such as the widely used Meteorological Office Rainfall and Evaporation Calculation System (MORECS) (Hough and Jones, 1997), that combine a model of evaporation with a model of soil moisture. They tend to be a compromise between the availability of input data and
a satisfactory representation of the processes governing recharge. Ragab et al. (1997) found that they do not adequately simulate extreme years, produce a range of recharge values for any given year, and that MORECS overestimates soil moisture deficits. Finch (1998) found that such models are most sensitive to the soil parameters, such as rooting depth, but relatively insensitive to vegetation canopy parameters for short vegetation.
More detailed representations of the processes governing recharge together with higher spatial resolutions of input parameters (rainfall, evapotranspiration, soil characteristics, and land cover) are being incorporated into recharge models. As yet, however, there is no practical way to check the accuracy of recharge estimates for the Chalk aquifer produced by any particular model or its reliability over the likely range of climatic variability. Conventional approaches, such as groundwater flow models or water level monitoring data, are often constrained by a lack of
information on aquifer parameter values, delay responses in the unsaturated zone (Calver, 1997) and non-linear variations in aquifer parameters with groundwater head. As a result the validation of a model’s performance tends to rely on comparison with point-scale field experiments undertaken for different soil types and land cover.
Whilst the accuracy of recharge estimates derived with a particular model cannot be ascertained, knowledge of the relative performance of alternative models would assist in the choice of model for a particular application and provide a qualitative measure of its limitations. However, with the exception of Ragab et al. (1997), little has been published on how recharge estimates vary between different models, particularly the more complex distributed models.
The main objective of this paper is to assess the relative performance of a range of models of different complexity for estimating groundwater recharge in Chalk aquifers. This is based on four models that vary in the level of spatial and temporal resolution, the way they represent recharge processes and in their data requirements. These were applied to the same Chalk catchment (River Pang, UK) and four-year period and one model was validated against river flows to provide a measure of their relative performance. Site and model descriptions are given in detail in the following sections.
Study area and model descriptions
STUDY AREA
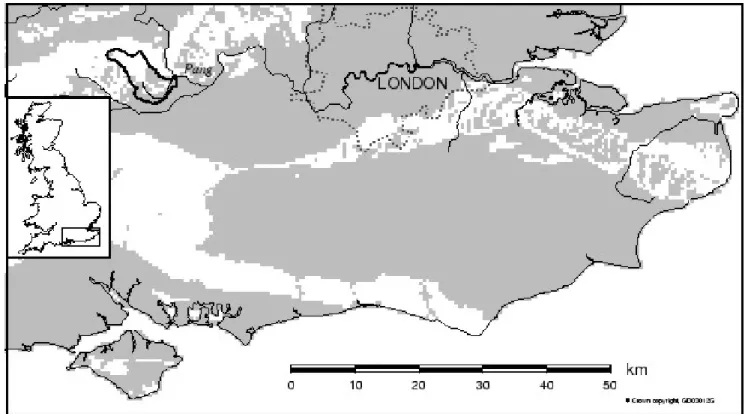
The Pang catchment is situated on the dip slope of the Chalk outcrop in the eastern part of the Berkshire-Marlborough Downs, UK (Fig. 1). It is a rural catchment with cereals and grassland as the dominant land cover. The Chalk is largely drift-free and dips at a shallow angle to the south-east beneath impermeable Lower London Tertiary deposits in the southern part of the catchment. The topography of the dip slope is subdued: elevations vary from about 35–40 metres above Ordnance Datum (mOD) along the Thames valley to about 200 mOD at the main watershed along a steep, north-facing Chalk scarp slope. It has a maritime climate with an average rainfall of 670 mm y-1.
The Pang is a tributary of the River Thames and has a surface catchment area of 171 km2. Runoff at Pangbourne
gauging station, situated at the confluence with the Thames, is 117 mm y-1 based on the surface catchment area, of which
86% is derived from groundwater discharge from the Chalk aquifer in the upper part of the catchment. However, the groundwater catchment of the Pang differs from the surface catchment as the regional groundwater flow pattern is influenced by the Thames and by springs along the northern
Fig. 1. Study area location. Unshaded areas are HOST Class 1 and 2 soils (Boorman et al., 1995) which, in this figure, are predominantly
escarpment. Flows at Pangbourne also include a significant component of direct runoff from the Lower London Tertiaries in the lower part of the catchment. Bradford (2002) provides a fuller description of the hydrological functioning of the Chalk in the West Berkshire Downs.
MODEL REPRESENTATIONS OF THE PANG CATCHMENT
Four models were selected and applied to the same Chalk catchment, the River Pang in the Thames Valley, UK, based on a four-year period that includes a range of climatic variability. The models used were:
z a generalised soil water balance model, MORECS
(Hough and Jones, 1997)
z a zoned catchment water balance model, Thames
Catchment Model (TCM) (Wilby et al., 1994);
z a fully distributed, hydraulic transfer model, Areal
Non-point Source Watershed Environment Response Simulation model (ANSWERS) (Bouraoui and Dillaha, 1996; Haverkamp et al., 1998);
z a fully-distributed distributed, soil water balance model
with varying root depth, Root Layer Model (RLM) (Ragab et al., 1997)
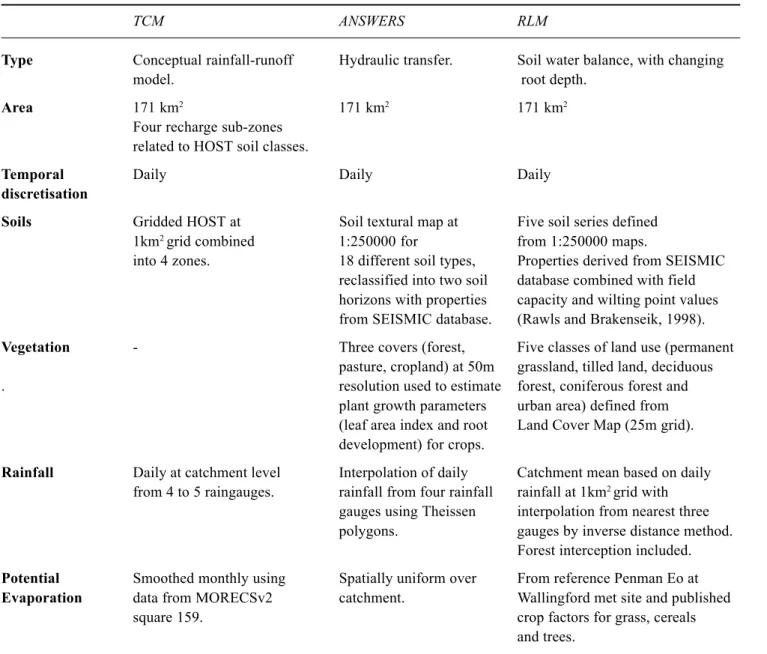
Table 1 summarises the input data used in each distributed model to generate estimates of recharge. Daily estimates of recharge were derived for each of these three models to produce monthly, seasonal and annual values for the period January 1992 to December 1995. This period includes the last stage of a prolonged drought (1992) and two successive years of above average winter rainfall (1993/4 and 1994/ 5). Monthly values of recharge (as hydrologically effective precipitation, HEP) for the same period based on grass cover and soils with a medium available water capacity and a single rainfall station were obtained from MORECS (version 2).
MORECS
MORECS uses daily synoptic weather data from 140 weather stations to produce weekly and monthly average potential evapotranspiration (PE), actual evaporation (AE), soil moisture deficit (SMD) and HEP for 201 individual grid squares covering the UK each of 40 × 40 km (Hough et
al., 1996; Hough and Jones, 1997). The upper part of the
Pang catchment, where most recharge occurs, lies within MORECS grid square 159.
Daily evapotranspiration is calculated for a range of soil covers using a modified form of the Penman-Monteith equation (Monteith and Unsworth, 1990). These are
converted to actual evaporation by progressively reducing the rate of water loss as the available water decreases from a fraction, p, of its maximum values to zero. The value of p depends on the combination of soil and crop types and ranges from 60% for bare soil to 25% or less for some types of soil and crops.
The water balance (SMD and HEP) is also calculated daily. The SMD on a particular day is the difference between actual evaporation and precipitation (P) when added to the SMD of the previous day. HEP is then calculated as the difference between actual evaporation and precipitation when SMD=0. Interception losses by vegetation are taken into account using a leaf area index (LAI) for different vegetation covers. These estimates also take account of the different types of cropped surfaces and average land use for each square (obtained mainly from satellite imagery and crop census returns). Data for soil available water are derived from LandIS (Land Information System), which incorporates a digitised National Soils Map with a base resolution of 1 ha (Soil Survey, 1983), and the National Catalogue of Soils, which contains data on soil properties from benchmark soil profiles.
In MORECS the soil water reservoir available to plants (TAW, total available water) is considered conceptually to have two components: ‘easily available water’ (EAW) held between 5 kPa (field capacity) and 200 kPa, and ‘restricted available water’ (RAW) held at higher suctions of 200 to 1500 kPa (wilting point). Soil water is drawn from EAW until depleted and then from RAW and similarly excess precipitation will recharge EAW before replenishing RAW. A dense rooting pattern is assumed for the upper soil layer, where TAW (or available water capacity, AWC) is available to the crop from field capacity to wilting point, and a sparser rooting pattern for the subsoil, where only EAW is considered to be available.
Thames Catchment Model (TCM)
The Thames Catchment Model (TCM) is a continuous simulation, conceptual rainfall-runoff model represented by a series of three connected, process-based ‘stores’ (Wilby
et al., 1994). A drying curve sub-model is incorporated in
the soil moisture store to determine actual evaporation. The unsaturated layer is represented as a linear store from which outflow to the non-linear saturated store is proportional to storage volume. A number of sets of such stores can be used to represent different spatial zones within a catchment to account for different land uses, soil types etc. A proportion of the precipitation exceeding potential evapotranspiration in each spatial zone bypasses the soil moisture store to become direct recharge to the unsaturated zone store. This
Table 1. Model input data summary
TCM ANSWERS RLM
Type Conceptual rainfall-runoff Hydraulic transfer. Soil water balance, with changing
model. root depth.
Area 171 km2 171 km2 171 km2
Four recharge sub-zones related to HOST soil classes.
Temporal Daily Daily Daily
discretisation
Soils Gridded HOST at Soil textural map at Five soil series defined
1km2 grid combined 1:250000 for from 1:250000 maps.
into 4 zones. 18 different soil types, Properties derived from SEISMIC
reclassified into two soil database combined with field horizons with properties capacity and wilting point values from SEISMIC database. (Rawls and Brakenseik, 1998).
Vegetation - Three covers (forest, Five classes of land use (permanent pasture, cropland) at 50m grassland, tilled land, deciduous
. resolution used to estimate forest, coniferous forest and
plant growth parameters urban area) defined from (leaf area index and root Land Cover Map (25m grid). development) for crops.
Rainfall Daily at catchment level Interpolation of daily Catchment mean based on daily from 4 to 5 raingauges. rainfall from four rainfall rainfall at 1km2 grid with
gauges using Theissen interpolation from nearest three
polygons. gauges by inverse distance method.
Forest interception included.
Potential Smoothed monthly using Spatially uniform over From reference Penman Eo at
Evaporation data from MORECSv2 catchment. Wallingford met site and published
square 159. crop factors for grass, cereals
and trees. proportion can vary between zones and allows a small
amount of recharge to occur during the summer even when there is a soil moisture deficit. The total runoff for the catchment is given by the sum of the outflows from the non-linear store for each zone.
The HOST (Hydrology of Soil Types) classification (Boorman et al., 1995) was used to distinguish two main zones influencing recharge and runoff in the Pang catchment:
zone 1 (96.4 km2), representing the combined area of HOST
Classes 1 (Chalk) and 18 (slowly permeable soils overlying the chalk with no permanent watercourses). zone 2 (40 km2), comprising areas of drift deposits (HOST
Class 25) that occur in the southern part of the catchment
Each of these two main zones was divided into two to give a ‘quick’ and ‘slow’ component of flow from each main zone. The output from zone 1 provides the groundwater component of flow in the Pang. The two zones cover that part of the topographic catchment contributing to the flow at Pangbourne. The groundwater catchment area was derived from regional groundwater contours ranging between high water level conditions in January 1995 and low water levels in August 1976 (an extreme drought year when the Pang was supported only by perennial springs). This area was then assumed to be constant, although in reality it will vary with seasonal fluctuations in groundwater head. The difference between the groundwater and topographic catchments represents the northern part of the surface catchment (34.6 km2) from which unmeasured groundwater
flow takes place out of the catchment. This part of the catchment has permeable chalk soils of HOST Class 1.
Daily rainfall for the Pang catchment for 1968 to 1996 was derived from a weighting method using five rainfall gauges located within the catchment. A smoothed distribution of monthly potential evapotranspiration was derived from MORECS data for grid square 159. The TCM model was calibrated against mean daily flows at Pangbourne for 1968 to 1976 and validated using data for 1977 to 1996. It was then run to produce aggregate monthly totals of recharge from the soil moisture store to Zone 1 for 1992 to 1995.
ANSWERS Model
The Areal Non-point Source Watershed Environment Response Simulation model (ANSWERS) (Bouraoui and Dillaha, 1996; Haverkamp et al., 1998) is a continuous, distributed-parameters, daily water-balance model discretised into a matrix of square elements each having uniform topographic, soil hydrodynamic and crop characteristics. Basic parameters for the model are derived from soil texture, land cover and climatic data (daily potential evapotranspiration and distributed rainfall data). It employs a raster-based GIS (Geographical Information System) GRASS (Geographical Resources Analysis and Support System) to process input and output data.
The soil is characterised by the soil water pressure (h) and soil moisture content (θ) whose relationship is expressed by the water retention curve (h(θ)), according to van Genuchten (1980). Infiltration is simulated by the Green-Ampt (1911) equation. The infiltration process is considered as a wetting-front moving through the soil profile where the soil moisture ahead of the wetting front is equal to the antecedent soil moisture. The soil water redistribution is computed assuming gravity drainage under unsaturated conditions between rainfall events.
Plant growth is represented by a time-varying leaf area index (LAI) employing ten stages of plant growth for each type of crop cover using idealised values after Knisel (1980) with daily interpolation for each growth stage. The root depth is also computed daily (Borg and Williams, 1986). Evapotranspiration is based on Ritchie’s approach (1972) and each daily value of LAI is used to partition potential evapotranspiration into potential soil evaporation and potential plant transpiration.
A digitised soil textural map (1 : 250000 scale) of the Pang catchment was used to classify the 18 soil types found in the Pang catchment into maps showing clay, silt, sand and bulk density (porosity) for two soil horizons. These maps were used to derive effective shape and normalisation
parameters of the soil hydraulic characteristics on a 200 m grid square scale. Plant growth parameters (LAI and root development) were obtained from a vegetation map of the three main covers (forest, pasture, cropland) at a resolution of 50 m.
Daily rainfall data for the period 1991 to 1995 from four gauges within the catchment were used to determine the spatial distribution of rainfall based on Theissen polygons. Potential evapotranspiration was assumed to be uniform over the catchment. The model was initialised with data for 1991.
Root Layer Model (RLM)
The Root Layers Model (RLM) is a soil water balance model employing a daily time-step (Ragab et al., 1997). Two versions of the model are available: a single-phase, 4-layered version with a constant root depth with time to simulate permanent grass and forest cover, and a two-phase, 5-layered version for cropped areas with time-varying root depth representing bare soil (pre-planting) to crop harvesting conditions. The model employs a limited number of parameters: rooting depth, soil water content at field capacity and at wilting point, rainfall and potential evapotranspiration (constant root depth version). Crop growing season and crop coefficients are applied to convert reference potential evapotranspiration to potential evapotranspiration in the variable root depth version.
Each layer in the constant root depth version represents 25% of the total rooting depth, with root water uptake from each layer being a function of the root density distribution. A capacity approach is employed, i.e. water in excess of the water content at field capacity moves down to the next layer and any water exceeding the field capacity of the lowest layer is considered to be potential recharge. Inflow to the top layer is taken to be effective rainfall, the proportion of actual rainfall that enters the soil matrix. (Any remaining rainfall is considered to be surface runoff, although surface runoff from Chalk soils is usually insignificant.)
Flow by-passing the soil to contribute to recharge via fractures (by-pass flow) generally recognised as occurring in the Chalk is an important process during intensive rainfall events (Hassan and Gregory, 2000). Unlike clays which swell and shrink, Chalk fractures do not change their geometry over seasons and hence a reasonable and pragmatic approach to describe flow through these fissures is to use a fixed ratio of rainfall. Smith et al. (1970) concluded that about 15% of the recharge to the Chalk took place through fractures based on an analysis of a profile of the tritium content from the unsaturated zone of the Chalk. Using 15% by-pass flow on two chalk aquifer soil moisture experimental sites near Winchester, Hampshire, and east of Cambridge,
Cambridgeshire, Ragab et al. (1997) obtained a good agreement between the simulated and observed moisture content and moisture deficit profiles, which also improved the groundwater recharge estimates for these two sites. Consequently, RLM incorporates a constant fraction of 15% of the rainfall to simulate flow that by-passes the soil matrix to contribute directly to groundwater recharge via fissures in the unsaturated zone. The spatial distribution of these fissure zones is not known, although they are better developed in valley areas.
The different soil series for the Pang catchment identified from 1 : 250 000 scale soil map (Soil Survey, 1983) were combined into the five most common and comparable soils with respect to rooting depth and soil texture (Andover, Coombe, Frilsham, Hornbeam, and Wickham). Their properties were obtained from the SEISMIC database (Soil Survey and Land Research Centre, 1995) combined with values of field capacity and wilting point from Rawls and Brakensiek (1988). The Andover1 and Coombe1 series are the dominant soil series in the upper part of the catchment where most recharge occurs, although these cover about 37% of the surface catchment area. Both soil series are thin, well-drained, silty soils.
Information on land use was obtained from the Land Cover Map produced by the Centre for Ecology and Hydrology, which records 25 types of cover on a 25 m grid. These were reduced to five main classes: (permanent) grassland, tilled land, deciduous forest, coniferous forest and (sub)urban area. The area of each main land use type for each main soil series was calculated. The dominant land use is cereals, followed by grass which accounted for 59% and 23%, respectively, of the surface catchment area in 1997. The most dominant arable crops are cereals (wheat and barley) and these were used as the reference arable crop.
Average daily rainfall for the Pang catchment was calculated on a 1 km grid using available rain gauge data. To allow for forest rainfall interception, a value of 17% in winter and 33% in summer was assigned for deciduous forest (Dolman, 1987) and a constant value of 38% applied throughout the year for coniferous forest (Dolman and Moors, 1993). Penman evaporation is used as the reference evaporation. This was derived using data from a meteorological site at Wallingford some 10 km north of the Pang catchment. Potential evapotranspiration was then obtained by multiplying by a crop factor.
Results and Discussion
Daily values of recharge obtained with each model were aggregated to give monthly, seasonal, and annual totals for the four-year period January 1992 to December 1995,
inclusive. The TCM model, which is widely used for hydrological studies of the Thames Basin, was calibrated and validated against time-series gauged flows of the River Pang to provide a reference against which the relative performance of the other three models could be compared. Figure 2 shows the calibration results for TCM for January 1992 to December 1995. This illustrates the relative contributions to the total flow at Pangbourne from the two modelled chalk zones and from the overlying impermeable deposits in the south of the catchment, compared with the observed hydrograph. The model simulation on a daily basis was run for 1968 to 1995. The simulation was successful as the goodness of fit criterion was 82% (as given by 1-[Σ(OI – MI)2/Σ(OI – O)2] where OI is the observed daily
mean flow, MI is the modelled flow and O is the observed mean flow for I=1 to n; Nash and Sutcliffe, 1970). The percentage error in the long term water balance of the simulated flows compared with observed flows for 1968 to 1995 is –0.03%, with a value of –1.8% for the four years 1992 to 1995. There is good agreement between the modelled and observed flow hydrographs (Fig. 2) and between the slopes of the groundwater recession curves when there is little or no flow from zone 2, for example July to October 1994. This correlation, combined with the good overall water balance over both the four-year study period and the longer 27-year simulation period, provides confidence that the recharge estimates from TCM are reliable.
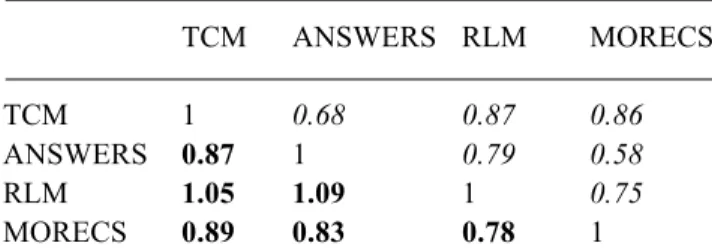
The relative performance of each model was represented by the correlation between each model as shown in Table 2. These are based on a linear fit to monthly data for the four-year period, including those months where a model records zero recharge. ANSWERS and MORECS were found to underestimate recharge compared to TCM, whilst RLM tends to slightly overestimate recharge. TCM shows a similar, high correlation with RLM and MORECS whilst ANSWERS shows the weakest correlation with the other models, particularly with MORECS.
Table 2. Model correlations
TCM ANSWERS RLM MORECS
TCM 1 0.68 0.87 0.86
ANSWERS 0.87 1 0.79 0.58
RLM 1.05 1.09 1 0.75
MORECS 0.89 0.83 0.78 1
The relationship between each model is shown in bold. These are applied to the model in the top row (e.g. ANSWERS = 0.87 TCM. Numbers in italics are correlation coefficients (r2).
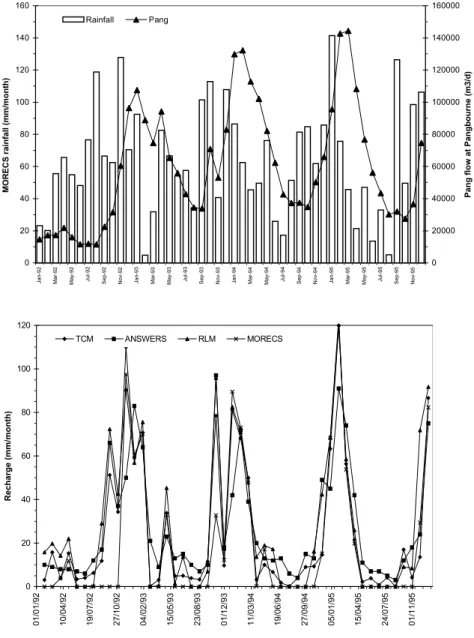
Monthly recharge values derived with each model together with monthly rainfall from MORECS and mean gauged flow of the Pang at Pangbourne are plotted in Fig. 3. The figure shows that the pattern of monthly recharge produced by RLM, TCM and ANSWERS is similar. Whilst these are close to the monthly recharge values from MORECS during late winter, the absence of summer recharge and the late onset of recharge calculated by MORECS is particularly noticeable. Over the 48-month period, MORECS recorded a total of 28 months having zero recharge compared to 14 months with RLM and only one month with TCM, whilst recharge occurs in every month with ANSWERS. The delayed onset of recharge calculated by MORECS, which occurs as late as November in three of the four years, is not compensated by additional recharge at the end of the recharge season, i.e. there is no corresponding shift in the period over which recharge occurs. MORECS also records no recharge at times when recharge is suggested by an increase (or a reduced rate of recession) in Pang flows, particularly in late summer/early autumn: the variation in flow more closely reflects the recharge pattern produced by TCM and ANSWERS, and to a lesser extent RLM.
Figure 4 shows the monthly cumulative recharge, rainfall and Pang flow at Pangbourne over the crucial winter recharge period (October to March) for 1992, 1993 and
1994. RLM produces relatively higher estimates than the other distributed models and MORECS the lowest estimates. However, the cumulative winter totals are very similar ranging by about +/–30 mm, or about +/–10% of the mean winter recharge derived from the four models. Total recharge for the summer period (April to September) derived by each distributed model is also similar overall with the highest values being produced by ANSWERS. However, there is a marked difference between these models and MORECS in the amount of summer recharge, particularly in years with drier summers (1992 and 1995). Summer recharge in MORECS only accounts for 6% of the total mean annual recharge over the three hydrological years compared to about 11.5–13% in TCM and RLM increasing to 19% for ANSWERS. Over the 4-year period summer recharge calculated from the distributed models is 3.5 to 5 times greater overall than that from MORECS.
Figure 5 shows the total annual recharge for each model. RLM produces consistently relatively higher estimates of annual recharge than either ANSWERS or TCM, whilst the three distributed models produce higher values than MORECS in any particular year, notably in 1992, a drought year. TCM exceeded MORECS by only about 7% in 1994 and 1995, which were years with above average rainfall. The mean percentage differences range from 26 (TCM) to
1992 1993 1994 1995 1996
0 1 2 3
mean daily flow (m
3 s
−1
)
Observed flow Total modelled flow Chalk flow zone 1 Chalk flow zones 1+2
0 20 40 60 80 100 120 140 160
Jan-92 Mar-92 May-92 Jul-92 Sep-92 Nov-92 Jan-93 Mar-93 May-93 Jul-93 Sep-93 Nov-93 Jan-94 Mar-94 May-94 Jul-94 Sep-94 Nov-94 Jan-95 Mar-95 May-95 Jul-95 Sep-95 Nov-95
MORECS rainfall (mm/month)
0 20000 40000 60000 80000 100000 120000 140000 160000
Pang flow at Pangbourne (m3/d)
Rainfall Pang
Fig. 3 Monthly recharge, rainfall and Pang flows
0 20 40 60 80 100 120 01/01/92 10/04/92 19/07/92 27/10/92 04/02/93 15/05/93 23/08/93 01/12/93 11/03/94 19/06/94 27/09/94 05/01/95 15/04/95 24/07/95 01/11/95 Recharge (mm/month) TCM ANSWERS RLM MORECS
47% (RLM) but each exceeded MORECS by about 80 to 110% in 1992. The mean annual recharge expressed as a percentage of rainfall over the same period ranged from 39 to 45% for the three distributed models compared to 31% for MORECS. The cumulative mean annual recharge as a percentage of cumulative rainfall ranges from 31% for MORECS to 45% for RLM.
The percentage difference in annual recharge between the distributed models only is shown in Fig. 6. RLM and ANSWERS show wider differences from year to year but with an overall difference of only 5.5% over the four-year period, whereas the difference between RLM and TCM is more consistent but rather larger overall at 16%. ANSWERS and TCM also show a wide difference in percentage terms but have an overall variability of about 10%.
The capacitance approach used in RLM and MORECS generates recharge only if the soil moisture exceeds field capacity, which is rarely the case during the summer months. However, ANSWERS calculates water fluxes according to Darcy’s law, where water flows according to the potential gradient, and hence some flow can take place in ANSWERS under unsaturated soil conditions, such as those occurring during the summer or years with low recharge. Similarly, a varying proportion of the precipitation in TCM that exceeds potential evapotranspiration directly passes the soil store, which allows some recharge to occur during the summer even when a soil moisture deficit is present. Once soil moisture deficits are overcome in the autumn, reduced actual evapotranspiration enables a high proportion of subsequent rainfall to become recharge. Hence, each model produces
0 50 100 150 200 250 300 350 400 450 500
Oct Nov Dec Jan Feb Mar
1992 0 50 100 150 200 250 300 350 400 450 500
Oct Nov Dec Jan Feb Mar
1993 0 50 100 150 200 250 300 350 400 450 500
Oct Nov Dec Jan Feb Mar
TCM ANS RLM MORECS Rainfall 1994
Fig. 4. Monthly recharge derived by TCM, ANSWERS, RLM and MORECS models for Pang catchment, 1992-95.
similar average estimates of recharge for the crucial winter period despite the different modelling approaches and the level of detail of the distributed input parameters.
In common with most Chalk outcrop catchments the land use, soil type hydrology and meteorological parameters are relatively uniform in the upper part of the Pang catchment
where most recharge occurs. Furthermore, except during the summer months or dry years, the subsurface representation (e.g. rooting depths or by-pass flow) is likely to be less important than the major meteorological parameters governing recharge. In addition, output from each model is given as the average recharge over the
Fig. 5. Annual recharge 0 100 200 300 400 1992 1993 1994 1995 Annual recharge (mm) MORECS TCM ANSWERS RLM
Fig. 6. Percentage difference in annual recharge derived from distributed models
-5 0 5 10 15 20 25 30 1992 1993 1994 1995 Difference % RLM-TCM RLM-ANSWERS ANSWERS-TCM
catchment rather than differences at a single point in time. Consequently, simple models perform relatively well compared to the more complex models in producing estimates of catchment-scale recharge in Chalk headwater catchments.
Conclusions
The four models produced similar estimates of total recharge over the crucial winter period, when errors in estimating actual evaporation are less important. Differences in monthly and total annual recharge between each model can be
attributed partly to the level of detail of the input data and how processes influencing recharge are incorporated or represented. In particular, concerning the way in which summer recharge is accommodated in each model, as the differences in total annual recharge are due mainly to the amount of summer recharge. Summer recharge accounts for 13–19% of the total annual recharge in the three distributed models compared to 6% in MORECS, which produces no recharge in most summer months even though river flows suggest that some recharge may be taking place.
MORECS, a generalised, simple soil model, tends to relatively underestimate summer recharge and the onset of
winter recharge whilst RLM, a distributed soil moisture model containing a more detailed representation of subsurface processes, has a tendency to slightly overestimate recharge. However, total winter recharge estimated by MORECS is on average only 11% less than TCM. This would suggest that the more readily available estimates from MORECS provide a reasonable - and conservative - basis for long-term groundwater resource estimates at the catchment level and where limited data determines the choice of model.
The relative uniformity of land use, soil types and rainfall across headwater, drift-free Chalk catchments suggests that complex, distributed models offer limited benefits for recharge estimates at the catchment scale compared to simple models. Nonetheless, distributed models would be justified for studies where the pattern and amount of recharge need to be known in greater detail, such as the effect of significant changes in land use, and to provide more reliable estimates of recharge during years with low rainfall.
Acknowledgements
MORECS data were supplied the Meteorological Office, Bracknell, UK. The authors are particularly grateful to Rosalie Franssen and Arwen Looijaard (both formerly of Wageningen University, Netherlands) for applying the RLM to the Pang catchment and to Henny van Lanen and Wageningen University for permission to use the results.
The modelling described in this paper was undertaken as part of two EU-funded projects: ARIDE (Assessment of the Regional Impact of Droughts in Europe, ENV-CT97-0553) and GRAPES (Groundwater and River Resources Action Programme at the European Scale, ENV4-CT95-0186) (Acreman, 2000).
References
Acreman, M.C. (Ed.), 2000. Groundwater and river resources programme on a European scale (GRAPES). Institute of Hydrology, Wallingford, UK.
Boorman, D.B., Hollis, J.M. and Lilly, A., 1995. Hydrology of
soil types: a hydrologically-based classification of the soils of the United Kingdom. Report No. 126, Institute of Hydrology,
Wallingford, UK.
Borg, H. and Williams, D.W., 1986. Depth development of roots with time: An empirical description. Trans. Amer. Soc. Agr..
Eng., 29, 194–197.
Bouraoui, F. and Dillaha, T.A., 1996. ANSWERS-2000: runoff and sediment transport model. J. Environ. Eng., 122, 493–502. Bradford, R.B., 2002. Controls on the discharge of Chalk streams of the Berkshire Downs, UK. Sci.Total Environ., 282-283, 65– 80.
Calver, A.F., 1997. Recharge response functions. Hydrol. Earth
Syst. Sci., 1, 47–53.
Dolman, A.J., 1987. Summer and winter rainfall interception in an oak forest, predictions with an analytical and a numerical simulation model. J. Hydrol., 90, 1–9.
Dolman, A.J and Moors, E.J., 1993. The water budget (De waterhuishouding). Nederlands Bosbouw Tijdschrift (Dutch Forestry Journal), 65, 306–314 (in Dutch).
Finch, J.W.F., 1998. Estimating direct groundwater recharge using a simple water balance model — sensitivity to land surface parameters. J. Hydrol., 211, 112–125.
Green, W.H. and Ampt, W.G., 1911. Studies of soil physics, Part 1. The flow of air and water through soils. J. Agr., 4, 1–24. Haverkamp, R., Parlange, J.-Y., Cuenca, R., Ross, P.J. and
Steenhuis, T.S., 1998. Scaling of Richard’s equation and its application to water shed modelling. In: Scale invariance and
scale dependency in hydrology, G. Sposito (Ed.). Cambridge
University Press, New York, USA.
Hough M.N. and Jones, R.J.A., 1997. The United Kingdom Meteorological Office rainfall and evaporation calculation system: MORECS version 2.0 — an overview. Hydrol. Earth
Sys. Sci., 1, 227–239.
Hough, M.N., Palmer, S.G., Lees, M.J., Barrie, I.A. and Weir, V., 1996. The Meteorological Office rainfall and evaporation calculation system: MORECS version 2.0 (1995), Meteorological Office, Bracknell, UK.
Knisel, W.G., 1980. CREAMS: A field scale model for chemical, runoff and erosion from agricultural management systems. Conservation Res. Report No 26, USDA-SEA.
Mahmood-ul-Hassan, M. and Gregory, P.J., 2002. Dynamics of water movement on Chalkland. J. Hydrol., 257, 27–41. Monteith, J.L. and Unsworth, M., 1990. Principles of
environmental physics. Edward Arnold, London, UK.
Nash, J.E. and Sutcliffe, J.V., 1970 River flow forecasting through conceptual models. Part 1. A discussion of principles. J. Hydrol.,
10, 282–290.
Ragab, R., Finch, R.W. and Harding, R., 1997. Estimation of groundwater recharge to chalk and sandstone aquifers using simple soil models. J. Hydrol., 190, 19–41.
Rawls, W.J. and Brakenseik, D.L., 1988. Estimation of soil water retention and hydraulic properties. In: Unsaturated flow in
hydrological modelling: theory and practice, H.J.
Morel-Seytoux (Ed). NATO ASI Series C. Mathematical and Physical Sciences, 275, 329–300. Kluwer Academic Press, Netherlands. Ritchie, J.T., 1972. A model for predicting evapotranspiration from a row crop with incomplete cover. Water Resour. Res., 8, 1204– 1213.
Smith, D.B., Wearn, P.L., Richards, H.J. and Rowe, P., 1970. Water movement in the unsaturated zone of high and low of high and low meability strata by measuring natural tritium. Isotope
Hydrology: Proc. Symp. Int. Atomic Energy Agency, Vienna.
73–87.
Soil Survey of England and Wales, 1983. Soils of South East England. Sheet 6 of 1:250000 Soil Map Series. Ordnance Survey, Southampton, UK.
Soil Survey and Land Research Centre, 1995. SEISMIC User Manual. Cranfield University, Silsoe, UK.
Van Genuchten, M.Th., 1980. Predicting the hydraulic conductivity of unsaturated soils. Proc. Soil Sci. Soc. Amer.,
44, 892–898.
Wilby R., Greenfield, B. and Glenny, C., 1994. A coupled synoptic hydrological model for climate change impact assessment. J.