HAL Id: hal-00318819
https://hal.archives-ouvertes.fr/hal-00318819
Submitted on 1 Jan 2003
HAL is a multi-disciplinary open access
archive for the deposit and dissemination of
sci-entific research documents, whether they are
pub-lished or not. The documents may come from
teaching and research institutions in France or
abroad, or from public or private research centers.
L’archive ouverte pluridisciplinaire HAL, est
destinée au dépôt et à la diffusion de documents
scientifiques de niveau recherche, publiés ou non,
émanant des établissements d’enseignement et de
recherche français ou étrangers, des laboratoires
publics ou privés.
Improved near real-time data management procedures
for the Mediterranean ocean Forecasting
System-Voluntary Observing Ship program
G. M. R. Manzella, E. Scoccimarro, N. Pinardi, M. Tonani
To cite this version:
G. M. R. Manzella, E. Scoccimarro, N. Pinardi, M. Tonani. Improved near real-time data
manage-ment procedures for the Mediterranean ocean Forecasting System-Voluntary Observing Ship program.
Annales Geophysicae, European Geosciences Union, 2003, 21 (1), pp.49-62. �hal-00318819�
Annales Geophysicae (2003) 21: 49–62 c European Geosciences Union 2003
Annales
Geophysicae
Improved near real-time data management procedures for the
Mediterranean ocean Forecasting System-Voluntary Observing Ship
program
G. M. R. Manzella1, E. Scoccimarro2, N. Pinardi2, and M. Tonani3
1ENEA Progetto Speciale Clima, La Spezia, Italy
2Universit`a di Bologna, Corso di Scienze Ambientali, Ravenna, Italy 3INGV, Istituto Nazionale di Geofisica e Vulcanologia, Roma, Italy
Received: 19 June 2002 – Revised: 5 November 2002 – Accepted: 7 November 2002
Abstract. A “ship of opportunity” program was launched as
part of the Mediterranean Forecasting System Pilot Project. During the operational period (September 1999 to May 2000), six tracks covered the Mediterranean from the north-ern to southnorth-ern boundaries approximately every 15 days, while a long eastwest track from Haifa to Gibraltar was cov-ered approximately every month. XBT data were collected, sub-sampled at 15 inflection points and transmitted through a satellite communication system to a regional data centre. It was found that this data transmission system has limitations in terms of quality of the temperature profiles and quantity of data successfully transmitted. At the end of the MFSPP operational period, a new strategy for data transmission and management was developed. First of all, VOS-XBT data are transmitted with full resolution. Secondly, a new data management system, called Near Real Time Quality Con-trol for XBT (NRT.QC.XBT), was defined to produce a par-allel stream of high quality XBT data for further scientific analysis. The procedure includes: (1) Position control; (2) Elimination of spikes; (3) Re-sampling at a 1 metre verti-cal interval; (4) Filtering; (5) General malfunctioning check; (6) Comparison with climatology (and distance from this in terms of standard deviations); (7) Visual check; and (8) Data consistency check. The first six steps of the new procedure are completely automated; they are also performed using a new climatology developed as part of the project. The vi-sual checks are finally done with a free-market software that allows NRT final data assessment.
Key words. Oceanography: physical (instruments and
tech-niques; general circulation; hydrography)
1 Introduction
Frequent and timely in situ observations of the ocean tem-peratures are necessary for the assessment of the health of
Correspondence to: G. M. R. Manzella
the marine environment and its changes, and to predict fu-ture trends. New sophisticated satellite observations provide a powerful system for ocean monitoring of, for example, the sea surface temperature, sea state, and surface winds. How-ever, satellite observations need to be complemented with in situ measurements providing information on the internal thermohaline structure of the ocean.
A cost effective way to collect temperature profiles is of-fered by ships of opportunity, i.e. merchant vessels used op-erationally for the measurements of the upper thermal con-ditions of the ocean by means of eXpandable BathyThermo-graphs (XBTs). These ships are part of the worldwide Ships Of Opportunity Program (SOOP) or Voluntary Observing System (VOS) if surface meteorological measurements are conducted along with the XBT collection. In the Mediter-ranean, XBTs represent the major contribution to the his-torical temperature data base (more than 155 000 XBTs vs. 50 000 bottles and CTDs in the MedAtlas data base - Medat-las Group, 1994). This means that XBTs contribute substan-tially to our knowledge of the Mediterranean Sea large-scale circulation variability. However, the XBTs were collected sporadically for research purposes and a systematic VOS was never launched before MFSPP in the Mediterranean.
The role of the VOS-XBT sampling was re-considered in the ’90s, as a consequence of the development of skilful mod-els and data assimilation schemes, in conjunction with novel satellite observations, such as Sea Level and Sea Surface Temperature (SST) from satellites (Molinari, 1999). In addi-tion, the success of projects like the Tropical Oceans-Global Atmosphere (TOGA-McPhaden, 1996) pushed the interna-tional oceanographic community toward a combined usage of buoy networks, VOS-XBT measurements and satellite ob-servations for the preparation of accurate initial conditions for El Nino predictions.
After 1990, the general development of what is called “op-erational oceanography” has posed new problems on the data management and delivery in NRT of VOS-XBTs. In 1999, Smith et al. (1999) stated that: “all upper ocean thermal data are to be distributed as soon as in practical after
measure-50 G. M. R. Manzella et al.: Improved near real-time data management procedures
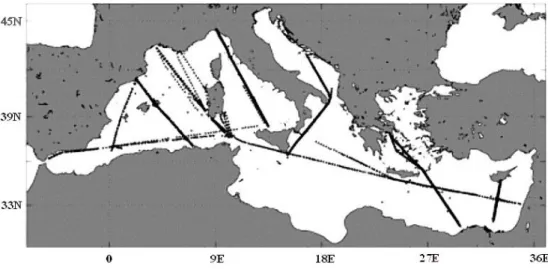
Fig. 1. The approximate position of the VOS seven tracks program in MFSPP.
ments (preferably 12 h). The strong preference is to keep in-tervention to a minimum, perhaps just automated processes. There should be a well-supported second stream, which al-lows for improved quality control and scientific evaluation of the data sets.”
Regarding the VOS XBT global data sets, the real-time data are actually released within 12 h from their collection, but at the cost of a heavy vertical sub-sampling of the pro-files. This is required by the low bit rate satellite system provided by Argos (Du Penhoat, 1999), the basic data trans-mission system of the Global Telecommunication System (GTS). The VOS-XBTs are distributed in NRT through the GTS to the meteorological services around the world that normally use only the near surface information to correct satellite SST (Reynolds, 1982). However, in the frame-work of operational oceanography, the subsurface tempera-ture profiles are becoming an essential data set. The sub-sampling of XBT profiles at inflection points, while gener-ally reducing data transmission requirements, precludes any high level of quality control. Thus, it is evident that the sub-sampling of the profiles has to be eliminated from the NRT transmission procedures and new protocols for data quality assurance have to be developed. In addition, new systems for data transmission should be used that allow for the full resolution profile to be sent.
In the framework of the Mediterranean Forecasting Sys-tem Pilot Project-MFSPP (Pinardi and Flemming, 1998; Pinardi et al., 2003), particular care was put on the develop-ment of protocols for the quality assurance of data collected operationally during the project, including “quality assur-ance of field work” (Manzella and MFS-VOS Group, 2002), “quality assurance of the NRT data” (MFS-VOS Group, 2000) and quality assurance of delayed mode data (Medat-las Group, 1994).
The data received in NRT were quickly compared by means of a broad range check with existing climatology. It was immediately evident that the method used to sub-sample the full resolution profiles was problematic in areas where
different water masses interleave. Many inversions in tem-perature profiles could not be selected adequately by sim-ple decimation software, with a limited number of inflection points.
In this paper, we describe the MFSPP VOS system in its totality and complexity. We then assess its functioning and show the limitations of the conventional VOS data manage-ment system. In addition, we develop and demonstrate a novel quality control procedure for full resolution profiles. We believe this procedure is in line with Smith’s concept of “a well-supported second stream, which allows for im-proved quality control and scientific evaluation of the data sets”. Thus, the final aim of the paper is to show the limita-tions of the generally accepted global VOS-XBT system and to develop the new methodology for future NRT VOS-XBT systems with higher quality standards.
This paper reviews the MFSPP VOS system in Sect. 2, together with the relevant XBT climatological data set. In Sect. 3 we present the assessment of the operational MF-SPP NRT data management system and develop the con-cept of the NRT Quality Controlled XBT data management (NRT.QC.XBT). The discussion and conclusions are offered in Sect. 4.
2 Data and methods
2.1 MFSPP-VOS program
For the first time, MFSPP implemented a basin wide op-erational monitoring system of the Mediterranean based on XBT data collection on VOS. The main characteristics of the system were the near-real-time data delivery, the open and user friendly access to near-real-time data through the project web page, and the high time and space resolution. The project, which has been part of the IOC-WMO Ships of Opportunity Programme, developed protocols and common methodologies for data collection and transmission, in order
G. M. R. Manzella et al.: Improved near real-time data management procedures 51 to assure data comparability and compatibility (MFS-VOS
Group, 2000).
The design of the routes was defined with the aim to detect the mesoscale variability in the Mediterranean Sea, across and along the main stream of waters of Atlantic origin, in ar-eas of dense water formation and permanent/recurrent gyres. The leading idea was to detect the temporal and spatial vari-ability along transects from boundary to boundary, in order to complement satellite data in the assimilation system for forecasting (Demirov et al., 2003) and in order to analyse in-dependently only from data, the circulation variability in the Mediterranean sub-basins.
The details of the design in terms of start and end ports and alternative tracks are reported in Table 1 and shown in Fig. 1. The monitoring period can be divided into three parts:
– the training phase, from September to November 1999;
in this period the temporal sampling was one month and allowed the check of the protocols developed for data collection and the transmission system;
– the MFSPP VOS targeted phase, from December 1999
to May 2000; in this period the tracks were repeated approximately every 15 days with XBT launched at 10 n.m. nominal resolution;
– the MFS extension, from June to December 2000; in
this period some tracks have been maintained (tracks 1, 4, 5, 6 up to August 2000; tracks 4 and 5 up to December 2000).
The first two periods can be shortly called “operational pe-riods”. There have been some deviations from the normal schedule and nominal tracks, due to extreme weather con-ditions or ship unavailability. Other problems in the tempo-ral sequences of the trips were due to strikes or unexpected changes in ship schedules or the suppression of trips.
The data collection/transmission system was composed by the following hardware components:
– Personal computer with Window 95 or 98,
– Sippican XBT hand launcher LM 3A,
– Sippican MK12 board card,
– GPS connected to the PC for inclusion of position in the
Sippican exchange files,
– IESM Argos transmitter including a second GPS
nec-essary to the Argos software (www.cls.fr/html/argos/ ocean/xbt fr.html).
The Sippican software used during the pilot project was the version 3.03 running on Windows. The Argos software was expressly developed for the project on the DOS sys-tem. The data acquisition was managed through the Argos software, that started the Sippican software. At the end of the profile collection, the Argos software validated the pro-file (gross range checks in Table 2), selected 15 significant
points, coded the data and transmitted them. Thus, the data collection-transmission system was completely managed by the IESM Argos unit.
Two kind of messages were transmitted through Argos: the message containing 7 GPS fixes and the one containing a pile of 12 XBT decimated profiles. The strategy consisted of sending 1 message GPS followed by 4 messages from the data pile. The pile was updated every hour.
The data management system was developed using the ex-perience of the most important international programmes, such as IGOSS (International Global Ocean Services Sys-tem) and SOOP-IP (Ships Of Opportunity Program, Imple-mentation Panel) (UNESCO, 1999) and the experience gath-ered as part of the EU projects (Medatlas Group, 1994). In summary, the following steps composed the data flow:
1. XBT profiles were acquired by means of the Sippican systems, stored in the PC hard disk in both rdf (raw data file) and edf (exchange data file) formats;
2. The edf files were quality controlled by the Argos soft-ware with a gross temperature check;
3. Sub-sampled profiles were generated and sent to the transmitter where a local logger stored up to 12 profiles; 4. Data were transmitted from the Argos service in Toulouse to the meteorological Global Telecommunica-tion System (GTS) and to the ENEA centre in Italy (the XBT NRT Data Centre);
5. After a final control the decimated data were transferred to the project ftp site, openly accessible through WWW; 6. Each partner sent the full resolution profiles to ENEA for final check and storage. Cruise reports were also filled in order to have information on any problem en-countered during the data collection.
Full resolution data were checked for elimination of spikes and small flickers. The first 5 m were eliminated since the signal was still contaminated by the air temperature. Fur-thermore, an along track visual data consistency check was done as described in Fusco et al. (2003).
The general characteristics of the Mediterranean water masses were considered in order to adapt the existing Argos software for data transmission. In fact, the methodologies of data “decimation” and transmission developed for the ocean cannot be applied to the Mediterranean for many reasons:
– Vertical homogeneity – Vertically homogeneous profiles
are usually found in particular areas of dense water for-mation (e.g. the northwestern Mediterranean, in the Adriatic, in the Aegean and portion of the Levantine basin) and also widely in the Ionian basin. The com-monly used version of the Argos software was checking that the temperature difference between the upper and lower layers was greater than 2◦C; otherwise, the profile was not transmitted. In MFSPP the control was elimi-nated in order to provide data in vertically homogeneous areas.
52 G. M. R. Manzella et al.: Improved near real-time data management procedures
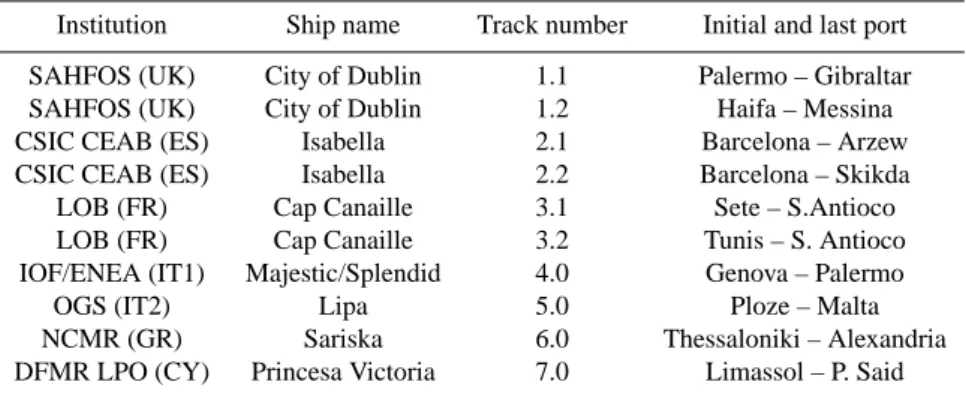
Table 1. Institutions, names of ships, track numbers and start/end ports of the initial monitoring design
Institution Ship name Track number Initial and last port SAHFOS (UK) City of Dublin 1.1 Palermo – Gibraltar SAHFOS (UK) City of Dublin 1.2 Haifa – Messina CSIC CEAB (ES) Isabella 2.1 Barcelona – Arzew CSIC CEAB (ES) Isabella 2.2 Barcelona – Skikda LOB (FR) Cap Canaille 3.1 Sete – S.Antioco LOB (FR) Cap Canaille 3.2 Tunis – S. Antioco IOF/ENEA (IT1) Majestic/Splendid 4.0 Genova – Palermo
OGS (IT2) Lipa 5.0 Ploze – Malta
NCMR (GR) Sariska 6.0 Thessaloniki – Alexandria DFMR LPO (CY) Princesa Victoria 7.0 Limassol – P. Said
Table 2. Gross range check applied by the Argos software before
decimation and transmission
1. No test from 0 to 10 m
2. Maximum depth 460 m
3. Minimum temperature 2◦C 4. Maximum temperature 33◦C 5. Maximum temperature inversion (0–200 m) 4.5◦C 6. Maximum temperature inversion (>200 m) 1.5◦C 7. Maximum temperature gradient 3◦C/m
– LIW temperature increase – Sea surface layer
tempera-tures are usually colder than at depth during winter in many Mediterranean areas. This unstable temperature gradient is compensated at depth by the salt associated with the presence of Levantine Intermediate Waters – LIW. The commonly used Argos software contained an “end of profile check” which automatically eliminated the part of the profile below 200 m having a tempera-ture increase. In the oceans this can be due to strong currents encountered during the free-fall of the sensor. In the Mediterranean the increase in the temperature be-low 200 m is due to the presence of the relatively warm LIW, for this reason the “end of profile check” was elim-inated.
– Number of significant points – The old software
pro-vided only those significant points (which could be less than 15) necessary to define the temperature profile. The new version was always calculating 15 significant points from the surface down to 460 m.
2.2 The XBT historical data set and climatology
The existing climatology cannot capture the large interan-nual and decadal variability of the Mediterranean Sea wa-ter masses (e.g. Malanotte-Rizzoli et al., 1999; Hecht and Gertman, 2001). The intensive investigations of the Mediterranean Sea from ’80s have shown dramatic changes in the circulation (Brankart and Pinardi, 2001; Demirov and Pinardi, 2002), as well as in the physical and chemical
char-acteristics of the sea. One of the consequences is that mea-surements are done in a changing environment, and that the spatial and temporal coverage of the Mediterranean Sea, pro-vided up to now by the historical data, is unable to provide the necessary information on interannual/decadal variability. In order to develop new quality control procedures for NRT XBT, a new climatology for temperature profiles was con-structed.
During the period 1994–1998, an important effort was done by two European projects to collect all the historical oceanographic data existing in the Mediterranean Sea. This effort led to the provision of temperature and salinity clima-tological data sets (Brasseur et al., 1996) and protocol for quality assessment (Medatlas Group, 1994). In particular, the MedAtlas project produced CD-Roms containing the histori-cal data used to build the climatology. From these CD-Roms, the XBT data were extracted, for a total of about 70 000 pro-files, and their spatial and temporal distribution checked on squares of 1 × 1 degrees. The original 155 000 XBT profiles used to build up the Medatlas climatology are not available yet.
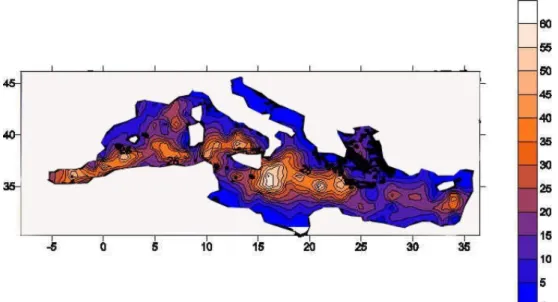
As it usually happens, the spatial and temporal distribu-tions of XBTs are uneven. In particular, it has been noted that the major part of the data in the eastern basin were col-lected during the ’90s, a period during which this portion of the Mediterranean was affected by significant changes in its physical conditions (e.g. Lascaratos et al., 1999). The spa-tial and temporal distributions of the data, shown in Fig. 2, demonstrate that it is not yet possible to have satisfactory in-formation on temperature variability. From Fig. 2 it appears that the major quantity of XBT data are along the major axis of the Mediterranean. The annual distribution of the XBT data in the Medatlas data set from 1966 to 1994 is shown in Fig. 3a. It is immediately evident that the 80’s show a low amount of data. The data distribution by month seems less unequal in the entire Mediterranean (Fig. 3b). However, there are areas where the data distribution is not acceptable for basic statistical analysis (first and second moments, i.e. mean and standard deviations).
We decided to compute a monthly mean climatology for each 1◦×1◦square in the Mediterranean from the surface
G. M. R. Manzella et al.: Improved near real-time data management procedures 53
Fig. 2. Spatial distribution of historical XBT data in the MedAtlas data set (1994).
Fig. 3. Annual (a) and monthly (b) distribution of XBT data from
MedAtlas.
to 400 m. In view of the data scarcity problem illustrated above, the climatology was computed only in those geo-graphical squares having a number of profiles greater than
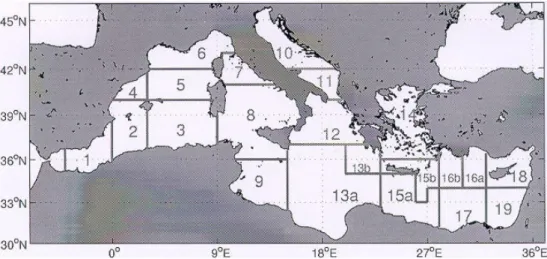
15. The number of profiles used for each 1◦×1◦ square ranged from 15 to 359. The XBT data extracted from the Medatlas data set were interpolated linearly to have temper-ature data at each metre. The total number of climatologi-cal profiles (as well as their standard deviations) were 1604, for the entire climatological year. The results allowed the definition of the 21 homogeneous areas presented in Fig. 4. Successively, the data collected from September 1999 to Oc-tober 2000 were added to the climatological data sets. As an average, about 100 profiles were collected weekly in the entire Mediterranean during the operational period. These data increased the calculation of the statistics in 475 areas and added 47 new mean profiles (and standard deviations), always retaining the rule of a 15 profile minimum.
In many cases, the MFSPP data did not significantly change the mean profiles and the standard deviations, but there have been areas were the addition was quite evident. This implementation is observed in areas of passage of water masses (regions 2 and 13, see Appendix), or dense water for-mation (6) or areas where the statistics were biased toward a particular transient phenomena (region 17). Changes of 1–2◦C in mean and standard deviations could significantly change the results of the classical control procedures. Sig-nificant differences for area 19 were also calculated for the months of January, November, December, which are periods when the major amount of XBT data were out by 4 standard deviations with respect to the Medatlas only climatological calculations. The effects on the quality control of the sig-nificant changes in calculated profiles in certain areas can be easily assessed from Fig. 5, showing the case of the clima-tological March. The mean and standard deviation profiles calculated with the Medatlas data were lower than the same profiles calculated adding the MFSPP-VOS data.
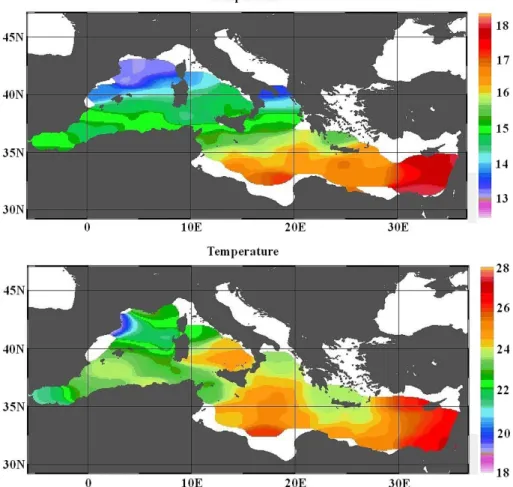
The new climatology obtained by merging MedAtlas and MFSPP VOS data is shown in Figs. 6a and b for the months
54 G. M. R. Manzella et al.: Improved near real-time data management procedures
Fig. 4. The homogeneous areas derived from comparison of mean profiles and standard deviations.
Fig. 5. Mean profiles and standard deviations obtained using the
MedAtlas data only (old) and adding the MFSPP-VOS data (new). The example is provided for the month of March in area 19. This is one particular area where MFSPP-VOS added a very significant amount of data.
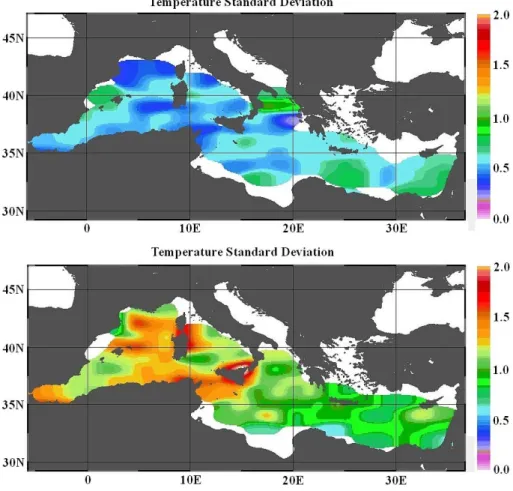
of January and July starting from the 1◦×1◦climatological data set. The standard deviations are shown, respectively, in Figs. 7a and b. In the Appendix, a short description of the mean and variability of each area is given.
3 Results
3.1 Assessment of the MFSPP-VOS NRT-XBT transmis-sion system
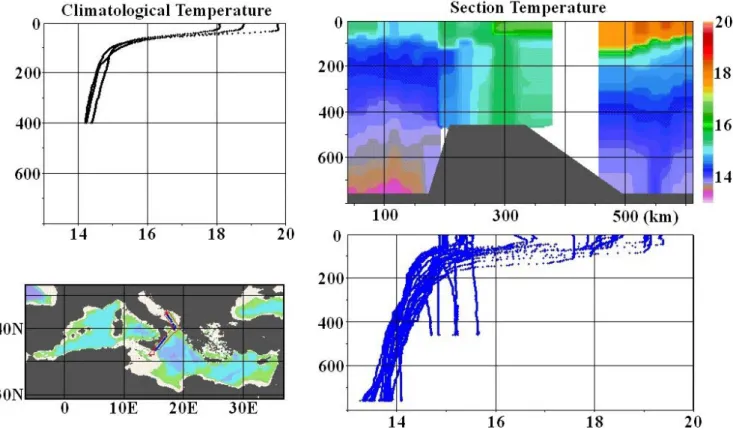
The first assessment is based upon the quality of the deci-mated profiles in terms of the capability to reproduce the full resolution profiles with sufficient accuracy, and the efficiency of the transmission system. The comparison between the “decimated data sets” and “full resolution data sets” showed that two kind of data loss affected the MFSPP-VOS pro-gram: (a) data values in the profiles not transmitted because of the decimation; (b) entire profiles not transmitted due to the checks inside the Argos software.
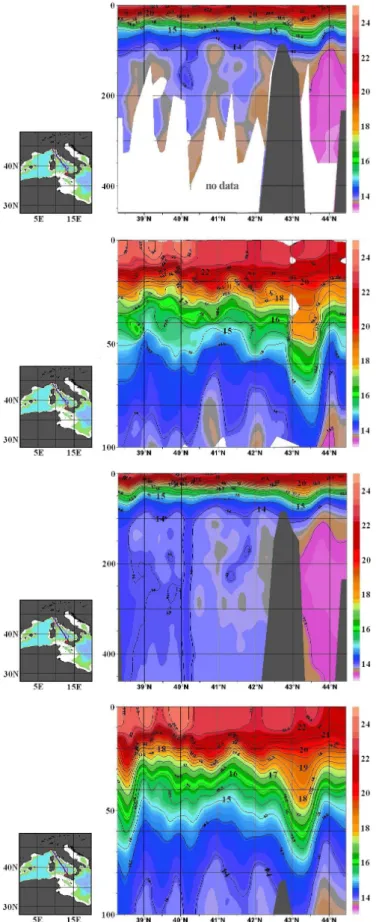
The type (a) data loss is shown in Figs. 8a–d where we present an XBT section reconstructed with decimated pro-files (Figs. 8a and b) compared with the same section con-structed with full resolution profiles (Figs. 8c and d). It ap-pears that the sub-sampled data in many cases do not pro-vide information at greater depths; cores of relatively warm waters are lost and the thermocline variability is less pro-nounced with respect to the full resolution data. Thus, even the increase to 15 decimation points is not sufficient to re-cover the full resolution profile structures from the XBT data. The reason for this is due to the presence of many inflection points at the surface and the inability of the software to select the most significant ones.
The type (b) data loss was more dramatic. Unfortunately, the software was also unable to provide a sub-sampling of vertically homogeneous profiles. From the assessment at the end of the pilot project, it resulted that only 49% of all pro-files were transmitted in real time (decimated form) during the period October 1999 to May 2000. A greater percent-age (56%) of decimated profiles was transmitted during the autumn–spring periods (when the water column was strati-fied), while only a small percentage (20%) was transmitted during the winter period, when there was no stratification.
near-real-G. M. R. Manzella et al.: Improved near real-time data management procedures 55
Fig. 6. Climatological temperature fields at surface in January (a) and July (b). Temperatures at 5 m depth.
time profile was the recording of an incorrect position, some-times the position of a station being on land. Although it is not easy to understand the origin of this error, it was certainly due to transmission faults only. These position problems can be the result of the Argos algorithm used to calculate posi-tions from the ship trajectory, which may cause the loss of the first message.
The final conclusion is that the decimation software, even if modified to better fit specific needs, has a cost/benefit ratio that is too large. There is no doubt that full resolution profiles are preferable since: (1) information on instrument faults is lost when the data are decimated, and (2) the complete posi-tion informaposi-tion is transmitted in full, eliminating this source of error.
In order to satisfy this new requirement, during the MFS extension period, a different data transmission methodology was applied along the track from Genova to Palermo. All data collected during the trip were compressed in a zip file and transmitted through GSM and the Internet. The max-imum delay was 24 h from the first profile data collection. The file was sent to the ENEA centre in La Spezia. This strategy is still used, waiting for the full development of the satellite GSM.
3.2 Assessment of the VOS tracks
During a monitoring activity, instrument faults can occur as a consequence of malfunctioning of the acquisition system or technician errors. In order to correct some of the most common errors, the assessment of the MFSPP-VOS system also included an evaluation of the collection practices applied in each track. This evaluation was done by using the files produced by the Sippican software (delayed mode data: full resolution profiles and real position of each XBT drop). In general, each track cycle was quite satisfactory; the time in-terval between two consecutive transects was about 15 days, as required by the project. The completeness of the line sam-pling was only dependent on weather conditions and affected mainly track 3, crossing the Gulf of Lion.
Problems in the tracks emerged when the check on edf de-rived drop position was done. The check compared the actual distance between drops calculated from registered locations of drops and the distance that the ship would have covered assuming its nominal speed. The check was generally pos-itive for all tracks, since less than 0.05% of incorrect posi-tions were calculated. A low quality rate was unfortunately assigned to track 2, where the errors in the position were cal-culated to be about 18%, a result that indicates that operators were manually entering the wrong position information.
56 G. M. R. Manzella et al.: Improved near real-time data management procedures
Fig. 7. Climatological standard deviations at surface in January (a) and July (b). Deviations at 5 m depth.
3.3 A new strategy for NRT Quality Controlled XBT data management
In addition to the usage of modern telecommunication sys-tems, it is necessary to develop a parallel stream of high quality, quality control XBT data that can be used for further scientific analysis. We call this strategy NRT Quality Con-trolled XBT data management, e.g. NRT.QC.XBT. These procedures could be used as a pre-processing of the full res-olution profiles for data assimilation purposes or they can be used to produce second level, quality controlled data sets for climate variability analysis. These procedures can be NRT or almost totally automated after the arrival of the full reso-lution profile to a data collection centre. The actual strategy of the project is to provide access to both original edf files produced by the Sippican software and NRT.QC.XBT data. In this way all important information contained in the origi-nal files are not lost.
The basic idea of NRT.QC.XBT is to produce a tempera-ture profile that is free of instrument failures and sensor mal-functioning signals, such as spikes. The majority of these problems are related to the wire: spiking is the result either of the wire touching the ship or of wire breaks which can result in data loss. Also, radio frequency interference can in-duce large spikes or hash, with the copper wire acting like an
antenna. In the actual project procedures, the XBT full reso-lution profiles are checked visually before the NRT.QC.XBT procedures are applied. This allows one to retain informa-tion, such as the depth at which the probe hits the bottom. There is often a small spike associated with the mechanical jarring as the probe strikes the bottom. However, we have noted that this can be absent in muddy areas or more than one small spike can be found in the profile. In this last case, the operator could define the bottom depth in the NRT.QC.XBT profile from the information of nautical maps. The “bottom check” will be implemented in the future release of the soft-ware.
The NRT.QC.XBT procedure then proceeds with 7 steps that in synthesis are:
– position control,
– elimination of spikes, – interpolation at 1 m interval,
– Gaussian smoothing,
– general malfunction control, – comparison with climatology,
– visual check, confirming the validity of profiles and
G. M. R. Manzella et al.: Improved near real-time data management procedures 57
Fig. 8. Temperature section from Genova to Palermo obtained from decimated data ((a) the data from surface down to the maximum depth, (b) the upper 100 metres) and from full resolution data ((c) the full profiles from surface to the 460 metres maximum depth, (d) the upper
58 G. M. R. Manzella et al.: Improved near real-time data management procedures The first 6 steps of the NRT.QC.XBT are now performed
in an automated way. The software was developed by try-ing different methodologies. The leadtry-ing idea was to assess the validity of such different methods for the different pur-poses of operational systems, and to choose those assuring the highest quality.
– Position control – Assuming that the first drop position
of the track is correct, the other drop positions were checked as follows. Knowing the distance and time in-terval between two consecutive stations, a correspond-ing ship velocity is derived. If this one is less than the maximum nominal ship speed, the position is consid-ered good, otherwise a “negative” flag is put in the out-put file. An implementation of the procedure could con-sist of correcting the “wrong” position by interpolation. This could be done after a check of the cruise report that the technicians on board the ships are requested to fill in.
– Elimination of spikes – A spike is identified by
comput-ing a median value of temperature in a chosen interval (3 m, i.e. 5 temperature points approximately) of the profile and comparing this median value with the origi-nal profile value at the central point of the interval. The spike is detected and removed if the difference between the value and the median is greater than an established tolerance (in this case 0.1◦C). The window interval on which to calculate the median and the tolerance was de-fined as an external parameter, to be changed by the op-erator. The spike is removed with a missing value. This does not create a problem for the final result, since an interpolation is applied after the spike elimination.
– Interpolation– All the data is re-sampled at a 1 metre
interval by means of a polynomial fit.
– Smoothing – The smoothing is done with a Gaussian
fil-ter with 4 m of e-folding depth, with the aim to eliminate high frequency noise.
– General malfunctioning – The test is to check if the
tem-perature gradient between the adjacent data is greater than a certain parametric value. This test does not elim-inate any part of the profile, but only provides a “warn-ing”. The “final user” can decide to maintain the data where the gradient is very high or to delete them. This check is active where significant changes of temper-ature occurs. The difference between spike removal and the general malfunctioning check is that in the first case, only a few data are anomalous, while in the sec-ond case a significant part of the profile has apparently anomalous temperature values. The temperature gradi-ents used in the software are 5.5◦C above the thermo-cline and 3.5◦C below the thermocline. We suppose that these gradient values in temperature can be com-pensated for by changes in salinities, the result being a vertically stable density profile, as observed in many CTD data in the Mediterranean.
– Comparison with climatology – This is done in terms
of “distance” of the XBT profile to the mean monthly profile. If this “distance” is less than 2 standard devia-tions, the XBT data are considered of good quality, if it is between 2–4 standard deviations or is greater than 4, a flag with an appropriate value is added to the profile.
– The automated procedure creates an output file
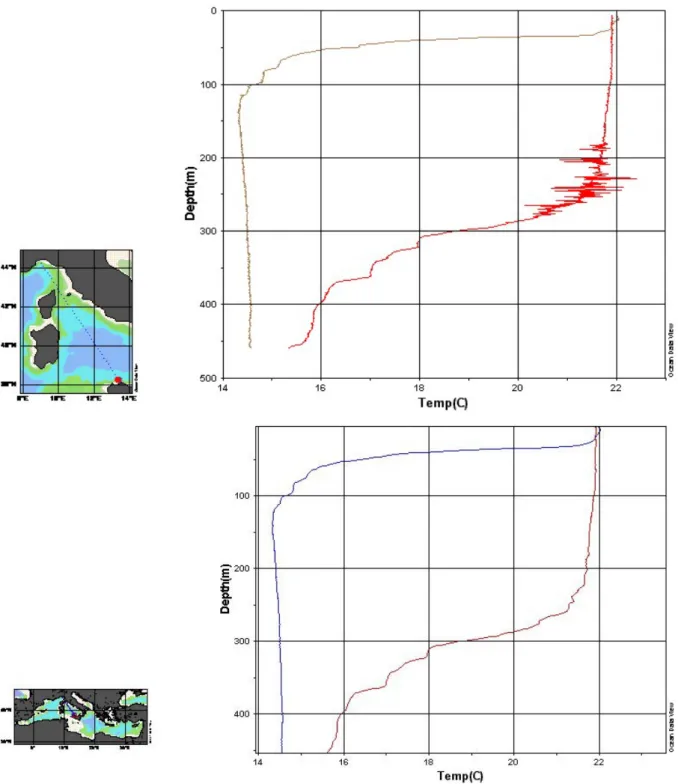
provid-ing information in terms of quality flags associated with the profile, following the recommendations of the Me-dAtlas (1994) quality control procedures. An example of the procedure is shown in Figs. 9a and b, where the original profile has some spikes and is quite noisy. The final profile has no noises and is without spikes.
– Visual Check – The data are finally inserted in the Ocean
Data View software (www.awi-bremerhaven.de/GEO/ ODV/) and a visual check is done rapidly. This also includes a visual comparison among adjacent profiles that assures the consistency of the entire data set. At the same time, the mean climatological profiles of the areas monitored with XBTs are shown graphically. The technician charged with controlling the data can com-pare the climatological profiles and the corresponding full resolution XBT profile.
It must be underlined that all profiles and each tempera-ture value in the profile are flagged following the MedAtlas recommendations.
The example for the fourth and fifth steps in the NRT.QC.XBT procedure is provided in Fig. 10, where each profile can be compared with the others of the same track and with monthly climatological profiles of the 1◦×1◦squares where the profile falls. In general, profiles having a tempera-ture significantly different from the climatology are accepted, if the profiles are consistent (i.e. there are no significant dif-ferences between one profile and the adjacent ones).
Unfortunately, not all the XBT data collected during MF-SPP can be compared with the reference climatology, due to the lack of sufficient historical data in the corresponding areas. For the MFSPP data the comparisons were done for 2213 XBT profiles over a total of 3487. The comparison shows that 1342 (equal to the 61% of the 2213) profiles were inside 2 standard deviations, while 871 (39%) were outside two standard deviations. An important result is that 220 pro-files (10%) were outside four standard deviations. A more careful analysis shows that the largest number out of the 4 standard deviation profiles were collected in autumn 1999 and spring 2000 and in the Levantine basin, where clima-tology was computed from a poor temporal data distribution from the previous years.
An automated quality control procedure must consider all of these possible causes of errors. Among the various steps, the “general malfunctioning check” is the most deli-cate, since it must include a control on gross errors in the profiles and on bathymetry. The last one can be simply done using the bathymetry of the forecast model. Although not
G. M. R. Manzella et al.: Improved near real-time data management procedures 59
Fig. 9. Raw data showing spikes and noises (a) and the same profile after the NRT QC procedure was applied (b).
precise, it does not introduce errors in the numerical compu-tations. More difficult is the “general malfunctioning check” in case of mechanical causes, typical of XBTs. Instantaneous stretches give temperature “fingers” which can be individu-alized in certain cases. The wire stretching can also induce a small, but continuous increase in temperature. This can-not be checked down to about 500 m, since the increase in temperature can be associated with the presence of relatively warmer LIW. In the Mediterranean, this check can then be
applied only below 500 m.
4 Discussion and conclusions
The MFSPP VOS-XBT system showed that it is necessary and possible to provide full resolution data of high quality for the Mediterranean Sea with a delay of one day. In addi-tion, a parallel stream of NRT Quality Controlled XBT can
60 G. M. R. Manzella et al.: Improved near real-time data management procedures
Fig. 10. Last step of the NRT.QC.XBT procedures with visual check and comparison with climatology. The visual control of the profiles of
the same track is shown on the right panels and a comparison with climatology is given in the upper left panel.
be developed to ensure a high quality data set for assimilation and climate studies.
In particular, we have shown that:
1. Data transmission: the re-sampling of the XBT profile at inflection points produces the loss of important infor-mation in the subsurface. Thus, full resolution profiles should be used at least for those sea areas such as the Mediterranean Sea (or the Atlantic region pertaining to the Mediterranean water outflow and Indian Ocean per-taining to Red Sea outflow), where temperature inver-sions are allowed by the compensating effect of salinity in the density. The experience of MFSPP shows that full resolution data can be easily transmitted with a maxi-mum delay of one day, only using GSM and the Inter-net. Future implementation of satellite GSM (or similar systems) will shorten the delay of real-time data deliv-ery.
2. NRT Quality Controlled XBT data management: a sec-ond stream of quality controlled data, based upon the full resolution profiles, was constructed to produce high reliable profiles for further scientific analysis.
The requirements set by Smith et al. (1999) for an opera-tional VOS-XBT data collection system can then be satisfied with the actual technologies based on satellite transmission systems and improved quality control systems.
An automatic procedure for the assessment of real-time data by means of six quality control steps has been illus-trated. The software can be operated in NRT and can filter the data from spikes due to the malfunctioning of the sensor. Finally, the profile is qualified in comparison with the clima-tology established from historical data sets. The comparison of the XBT profiles with climatology cannot actually be per-formed in all areas of the Mediterranean in an accurate way, since in some 1◦×1◦squares there are insufficient data to calculate a meaningful mean and standard deviation.
We believe the NRT.QC.XBT procedures demonstrated in this paper form the basis for future archiving of XBT data in historical data sets, eliminating some of the problems con-nected with the XBT sensor malfunctioning and thus releas-ing an accurate data set for climate studies in the Mediter-ranean Sea.
Appendix A Short description of the upper ocean tem-perature variability from the XBT climatology
The temperatures in the Alboran Sea (area 1) water column are the lowest of the Mediterranean during the all seasons. The stratification is always present in the profiles, also during the winter period. The major variability is found in the upper 50 m, during the summer period.
During winter, the western Algerian basin (area 2) has sur-face temperature values lower than area 1. The summer
heat-G. M. R. Manzella et al.: Improved near real-time data management procedures 61 ing is more evident, as well as the thermocline. The
maxi-mum variability is found at about 20 m, during summer time. The central Algerian basin (area 3) has monthly mean pro-files similar to those of area 2, but has a higher variability, es-pecially in the seasonal thermocline. The maximum variabil-ity is found at about 30 m, as in other areas of the Mediter-ranean.
The Catalan Sea (area 4) is characterised by a vertical ho-mogeneity in the mean profiles and standard deviations dur-ing the winter period. Both in winter and in summer, the temperature values below 300 metres are lower than in area 1 and 3, as an effect of dense water flowing in this area (Millot, 1999).
The Provencal basin (area 5) is characterised by a vertical homogeneity during the winter period. The summer tempera-ture profiles have values between those of the Algerian basin and of the northern Liguro-Provencal basin. The variability during summer is similar to that of area 4, but the depth of the mixed layer is deeper.
The Liguro-Provencal basin (area 6) has characteristics similar to those of area 5, except in the transition period from winter to summer, when there are surface temperatures (in the upper 30 m) higher of about 2◦C. Another difference is a lower variability (about 1◦C) during summer. At 400 m there is the lowest variability of the entire Mediterranean.
The centre-northern Tyrrhenian Sea (area 7) has tempera-tures higher than areas 5 and 6, since it is not directly influ-enced by the deep water formed in the northwestern Mediter-ranean, but by the water of Levantine origin coming from the Strait of Sicily (Sparnocchia et al., 1999)
The southern Tyrrhenian Sea (area 8) has the higher tem-peratures of the western Mediterranean, especially in sum-mer, when values up to 25◦C are found at the surface. The
variability is quite significant and higher of about 1◦C with respect to the other portion of the Tyrrhenian Sea.
The Strait of Sicily (area 9) has the highest summer tem-peratures, as those of the easternmost Levantine basin. The presence of the Levantine Intermediate Water is detected be-tween 100–300 m (Manzella et al., 1988). The variability is significantly lower that the neighbouring areas. At 400 m depth there is the minimum variability found in the entire basin.
The amount of data in the southern Adriatic (area 11) is not sufficient for the calculation of significant mean profiles and standard for the summer period. During January–February the surface temperature is lower than below 70 m.
The northern Ionian Sea (area 12) has lower temperatures than the southern Ionian Sea (area 13a). The other sub-area of the Ionian Sea (area 13b) is characterised by an increas-ing variability at depth, reachincreas-ing the maximal values at about 250 m. These differences are due to the path of the LIW and to the outflow of water from the Aegean Sea.
The Aegean Sea (area 14) has not been divided into sub-areas, although there are significant changes in the mean pro-files and in the standard deviations. The temperature dif-ference at surface between the northern and southern areas reaches 5◦C.
The sea around Crete has been divided into two sub-areas (15a and b) where changes in the profile and standard devia-tion characteristics are very high, especially during the win-ter period. The variability is quite significant, reaching the higher values at 250 metres in winter and at 50 m in summer. The winter variability is associated with the presence of LIW in both sub-areas. In area 15b there is a double thermocline in summer, which can be due to two different water masses: a local one originating from the summer heating, and the Crete Intermediate Water (Roether et al., 1996).
Also, the area between Rhode and Cyprus has different characteristics of temperature and variability and has been divide into two (areas 16a and b). In the Rhode basin the profiles do not show any winter vertical homogeneity, but has values greater than 15◦C at 300 m. The winter standard deviation is relatively homogeneous along the vertical, while in summer there is the highest variability at the base of the seasonal thermocline. East of this area the winter profiles are more homogeneous, but the variability reaches very high values down to 300 m. In summer there is the presence of a double thermocline as in area 15.
The mid Mediterranean jet region (area 17) has interme-diate characteristics between the neighbouring area and, as a consequence, is spatially changing and inhomogeneous. The winter variability is quite high (about 1◦C) down to 250 m.
The area 18 is influenced by the Asia Minor current. High summer temperatures (27◦C) are found here. The temper-atures are characterised by two relative standard deviation maximal values at 200 and 400 m during winter, an effect of the anticyclonic gyres affecting the area and the advection of LIW at these depths.
The southwestern Levantine basin (area 19) has the high-est summer temperatures of the Mediterranean. During win-ter, the variability is quite high down to 400 m, due to inter-mediate water convection.
Acknowledgements. This paper is dedicated to L. Simic, whose
nice passion will be remembered by all the MFSPP-VOS com-ponents. The authors are grateful to the group of technicians that were involved with the data collection during the monitor-ing: A. Baldi, D. Ballas, E. Bassano, Y. Chrysanthou, R. Co-mas, G. Gelsi, M. Ioannou, E. Lazzoni, P. Loukas, M. Morgigni, L. Paraskeva, P. Renieris, G. Spaggiari, I. Trakas, C. Tsivgiouras. They also extend their thanks to the Captains and crew members, the Board of Directors and the agents of: City of Dublin – UK, LIPA - Losinjinska Plovidba Croatia, TGT Annabella and TGT Isabella – Chemikalien Seetransport GMBH Hamburg/Europea de Consignaciones Barcelona, TGT Methane Polar, Osprey Maritime Ltd. London, Cap Canaille - DELOM France, Excelsior – Grimaldi Italy, MSC Sariska and MSC Anastasia - Mediterranean Shipping Company Greece, Princesa Victoria and Princesa Marisa-Louis Cruises Cyprus, for their valuable help and support throughout the project. This work was supported by EC MAS3-CT98-0171 (DG12 - EHKN). The technological implementation was supported by the Italian Ministry of Research - contract “Ambiente Mediterraneo”. The authors acknowledge the unknown referees whose comments improved the quality of the paper.
Topical Editor in Chief thanks A. Ribotti and another referee for their help in evaluating this paper.
62 G. M. R. Manzella et al.: Improved near real-time data management procedures
References
Brankart, J. M. and Pinardi, N.: Abrupt cooling of the Mediter-ranean Levantine Intermediate Water at the beginning of the 1980s: observational evidence and model simulation, J. Physi-cal Oceanography, 31, 2307–2320, 2001.
Brasseur, P., Beckers, J. M., Brankart, J. M., and Schoenauen, R.: Seasonal temperature and salinity fields in the Mediterranean Sea: Climatological analyses of an historical data set, Deep Sea Res., 43(2), 159–192, 1996.
Demirov, E. and Pinardi, N.: Simulation of the Mediterranean Sea circulation from 1979 to 1993. Part I: the interannual variability, J. Marine Systems, in press, 2002.
Demirov, E., Pinardi, N., Fratianni, C., Tonani, M., Giacomelli, L., and De Mey, P.: Assimilation scheme of the Mediterranean Fore-casting System: operational implementation, Ann. Geophysicae, this issue, 2003.
Du Penhoat Y.: How Argos contributes to studying El Ni˜no, Argos Newsletter, 54, 13, 1999.
Fusco, G., Manzella, G. M. R., Cruzado, A., Gasparini, G. P., Ko-vacevic, V., Millot, C., Tziavos, C., Velasquez, Z. R., Walne, A., Zervakis, V., and Zodiatis, G.: Variability of mesoscale features in the Mediterranean Sea from XBT data analysis, Ann. Geo-physicae, this issue, 2003.
Hecht, A. and Gertman, I.: Physical features of the eastern Mediter-ranean resulting from the integration of POEM data with Russian Mediterranean Cruises, Deep Sea Res., 48 (8): 1847–1876, 2001 Lascaratos, A., Roether, W., Nittis, K., and Klein, B.: Recent changes in deep water formation and spreading in the eastern Mediterranean Sea: a review, Progress in Oceanography, 44, 5– 36, 1999.
Malanotte-Rizzoli, P., Manca, B. B., Ribera d’Alcala, M., Theocharis, A., Brenner, S., Budillon, G. and Ozsoy, E.: The eastern Mediterranean in the 80s and in the 90s: the big transi-tion in the intermediate and deep circulatransi-tions, Dynamics of At-mospheres and oceans, 29, 365–395, 1999.
Manzella, G. M. R., Gasparini, G. P., and Astraldi, M.: Water ex-change between Eastern and Western Mediterranean through the Strait of Sicily, Deep Sea Res., 35, 1021–1035, 1988.
Manzella, G. M. R. and MFS-VOS Group (Bruschi,A. , Cruzado, A., Fusco, G., Gacic, M., Gasparini, G. P., Gervais, T., Ko-vacevic, V., Millot, C., Tonani, M., Tziavos, C., Velasquez, Z., Walne, A., Zervakis, V., and Zodiatis, G.): A Marine Informa-tion System for Ocean PredicInforma-tions, Ocean Forecasting:
Concep-tual Basis and Applications, (Eds) Pinardi, N. and Woods, J. D., Springer Verlag, Heidelberg, 37–53, 2002.
McPhaden, M. Y.: The Tropical Atmosphere Ocean (TAO) array is completed, Bull. Am. Meteo. Soc., 76, 739–741, 1996.
Medatlas Group: Specifications for Mediterranean data banking and regional quality controls, IFREMER, Direction Scientifique, Sismer-Brest, SISMER/IS/94-014, pp. 29, 1994.
MFS-VOS Group: VOS Data Collection and management in the Mediterranean Forecasting System project within the EU RTD Framework Programme, IOC/WMO, JCOMM Meeting Report no. 3, 2000.
Millot, C.: Circulation in the Western Mediterranean Sea, J. Marine Systems, 20, 423–442, 1999.
Molinari, R. L.: Lessons learned from operating global ocean ob-serving networks, Bull. Am. Meteo. Soc., 80, 7, 1413–1419, 1999.
Pinardi, N. and Flemming, N.: The Mediterranean Forecasting Sys-tem Science Plan, EuroGOOS Publication No. 11, Southampton Oceanography Centre, Southampton, 1998.
Pinardi, N., Allen, I., Demirov, E., deMey, P., Lascaratos, A., Le-Traon, P. Y., Maillard, C., Manzella, G., and Tziavos, C.: The Mediterranean ocean forecasting system: first phase of imple-mentation (1998–2001), Ann. Geophysicae, this issue, 2003. Reynolds, R. W.: A monthly averaged climatology of the sea
sur-face temperatures, NOAA Technical Reports, NWS31, Washing-ton, DC, pp. 33, 1982.
Roether, W., Manca, B., Klein, B., Bregant, D., Georgopoulos, D., Beitzel, V., Kovacevic, V., and Luchetta, A.: Recent changes in the Eastern Mediterranean deep waters, Science, 271, 333–335, 1996.
Smith, N. R., Harrison, D. E., Bailey, R. J., Alves, O., Delcroix, T., Hanawa, K., Keeley, R., Meyers, G., Molinari, R., and Roem-mich, D.: The role of XBT sampling in the ocean thermal net-work; Proceedings of the Ocean Observing System for Climate Conference, St. Raphael, France, 18–22 October, 1999; Vol. 1, 1999.
Sparnocchia, S., Gasparini, G. P., Astraldi, M., Borghini, M., and Pistek, P.: Dynamics and mixing of the Eastern Mediterranean outflow in the Tyrrhenian Sea, J. Marine Research, 20, 301–317, 1999.
UNESCO: Guide to operational procedures for the collection and exchange of JCOMM oceanographic data - third revised version, Unesco Manuals and guides 3, pp. 35, 1999.