DOI 10.1007/s00418-014-1206-1 OrIgInal PaPer
Coordinate‑based co‑localization‑mediated analysis of arrestin
clustering upon stimulation of the C–C chemokine receptor 5
with RANTES/CCL5 analogues
Laura Tarancón Díez · Claudia Bönsch · Sebastian Malkusch · Zinnia Truan · Mihaela Munteanu · Mike Heilemann · Oliver Hartley · Ulrike Endesfelder · Alexandre Fürstenberg
accepted: 25 February 2014 / Published online: 13 March 2014 © Springer-Verlag Berlin Heidelberg 2014
Keywords Clustering · Super-resolution microscopy ·
Single-molecule localization microscopy · g protein-coupled receptors · arrestin · CCr5
Introduction
g protein-coupled receptors (gPCrs) are membrane pro-teins that mediate a wide range of chemical signals across the cell membrane and thereby control important physi-ological processes. not surprisingly, they have therefore been major drug targets (rask-andersen et al. 2011). acti-vation of a gPCr through agonist binding (ions, small molecules, hormones,...) induces dissociation of its cyto-solic g protein, leading to downstream second messenger signalling (rosenbaum et al. 2009). In parallel, arrestin proteins are recruited from cytosolic pools (lefkowitz and Shenoy 2005). They arrest coupling between g proteins and their receptor and, independently of g protein signal-ling, also induce clathrin-mediated endocytosis as part of a desensitization process common to gPCrs (Moore et al.
2007). not all agonists trigger, however, the full signalling repertoire of gPCrs and there are now numerous examples of ligands that bias the receptor response either towards g protein coupling or towards non-g protein effectors such as arrestins (gesty-Palmer and luttrell 2011). This ability of different ligands binding to the same gPCr to trigger vari-ous pharmacological outcomes is related to the diversity of conformational states in which gPCrs exist (Kobilka and Deupi 2007; Bockenhauer et al. 2011) and has become an attractive feature for drug discovery (Kenakin and Christo-poulos 2013).
The C–C chemokine receptor 5 (CCr5) is a proto-typical gPCr for which the existence of biased ligands has been suggested (Zidar 2011; Kenakin et al. 2012).
Abstract g protein-coupled receptor activation and
desensitization leads to recruitment of arrestin proteins from cytosolic pools to the cell membrane where they form clusters difficult to characterize due to their small size and further mediate receptor internalization. We quantitatively investigated clustering of arrestin 3 induced by potent anti-HIV analogues of the chemokine ranTeS after stimula-tion of the C–C chemokine receptor 5 using single-mole-cule localization-based super-resolution microscopy. We determined arrestin 3 cluster sizes and relative fractions of arrestin 3 molecules in each cluster through image-based analysis of the localization data by adapting a method orig-inally developed for co-localization analysis from molecu-lar coordinates. We found that only classical agonists in the set of tested ligands were able to efficiently recruit arrestin 3 to clusters mostly larger than 150 nm in size and com-pare our results with existing data on arrestin 2 clustering induced by the same chemokine analogues.
Electronic supplementary material The online version of this
article (doi:10.1007/s00418-014-1206-1) contains supplementary material, which is available to authorized users.
l. Tarancón Díez · Z. Truan · a. Fürstenberg (*)
Department of Human Protein Sciences, University of geneva, CMU, rue Michel-Servet 1, 1211 geneva 4, Switzerland e-mail: [email protected]
C. Bönsch · M. Munteanu · O. Hartley Department of Pathology and Immunology, University of geneva, CMU, rue Michel-Servet 1, 1211 geneva 4, Switzerland
S. Malkusch · M. Heilemann · U. endesfelder Institute for Physical and Theoretical Chemistry, goethe-University Frankfurt, Max-von-laue-Str. 7, 60438 Frankfurt, germany
It is further an important drug target by being the major co-receptor used by HIV to infect target cells, and it can be efficiently blocked to prevent person-to-person virus transmission (Kuhmann and Hartley 2008; Karim et al.
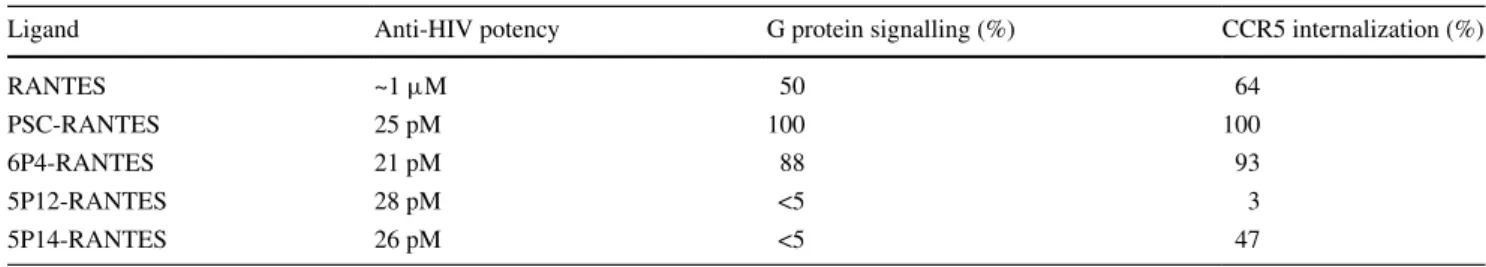
2010). analogues of the natural CCr5 ligand ranTeS were previously shown to efficiently prevent HIV infec-tion (lederman et al. 2004; Hartley et al. 2004; gaertner et al. 2008a). Interestingly, however, the pharmacologi-cal profiles of these ligands differing by only a few amino acids among the first 9 of 68 residues (Table S1) display large variations (Table 1). Molecules such as ranTeS, 6P4-ranTeS, or PSC-ranTeS act like classical partial or full agonists by causing both strong g protein activation and CCr5 internalization. The increased anti-HIV potency of PSC-ranTeS over ranTeS has been ascribed to additional long-term sequestration of CCr5 inside target cells (escola et al. 2010). On the other hand, analogues such as 5P12-ranTeS and 5P14-ranTeS display the same anti-HIV activity as PSC-ranTeS or 6P4-ranTeS but do not trigger g protein signalling and induce CCr5 internalization only partially (5P14-ranTeS) or not at all (5P12-ranTeS). It is currently not understood how these chemokine analogues all potently block HIV infection despite their very different pharmacological profiles, but stabilization of CCr5 into various conformational ensem-bles is likely involved. We recently characterized the effect of some of these ligands on arrestin 2 recruitment upon stimulation of CCr5 to test whether arrestin 2 mobiliza-tion could relate to their pharmacology and found that only those ligands capable of recruiting arrestin 2 also induced receptor internalization (Truan et al. 2013).
among the arrestin protein family, both arrestin 2 and arrestin 3 are ubiquitously expressed. These proteins inter-act with most gPCrs and cluster around clathrin-coated pits upon gPCr stimulation (Santini et al. 2002; laporte et al. 2000; luttrell et al. 1999). It has, however, tradition-ally been difficult to study the formation, the dimension, or the fate of such clusters by standard imaging proce-dures because of their size near or below the diffraction limit. Standard techniques applied to obtain information on
biomolecular interactions such as Förster resonance energy transfer (FreT) or two-colour co-localization of differently labelled molecules by fluorescence microscopy indeed suf-fer from a spatial resolution limited to typically ~200 nm because of the wave-like nature of visible light. The recent introduction of super-resolution microscopy techniques has enabled to overcome this limit (rust et al. 2006; Betzig et al. 2006; Hess et al. 2006; Hell 2007) and opened up new avenues to resolve small objects and monitor protein– protein interaction scales closer to the molecular resolution. Super-resolution methods based on the localization of sin-gle molecules (Fürstenberg and Heilemann 2013; Moerner
2012) have the advantage of providing not only an image (which means pixels with an intensity information) but also molecular coordinates that can be directly used in novel schemes for co-localization and clustering analysis (Sen-gupta et al. 2011; Malkusch et al. 2012; Owen et al. 2013; Truan et al. 2013; endesfelder et al. 2013; Specht et al.
2013).
Clustering and oligomerization are frequent types of functionally relevant protein–protein interaction in which two or several proteins of the same kind interact together. From an analysis point of view, they are, however, only a particular case of molecular entities interacting together, so that existing co-localization analysis methods based on molecular coordinates can readily be adapted to monitor clustering processes. We present here a simple modification to a recently introduced coordinate-based co-localization (CBC) analysis method (Malkusch et al. 2012) that enables to evaluate the spatial distribution of a protein recorded in a single channel and provides a physical basis for setting a threshold in image-based cluster analysis. We apply CBC-mediated cluster analysis to evaluate the dimension of arrestin 3 clusters upon stimulation of CCr5 by ranTeS analogues in order to test the hypothesis that these ligands induce differential arrestin 3 recruitment and relate this observation to their pharmacological profile. We further compare our results with recently obtained information on arrestin 2 mobilization by a similar set of ligands (Truan et al. 2013) and find that most ligands causing arrestin 2 Table 1 Functional characterization of ranTeS (Hartley et al. 2004; gaertner et al. 2008b) and of some of its analogues (gaertner et al. 2008a)
g protein signalling activity (release of Ca2+) and CCr5 internalization are expressed relatively to PSC-ranTeS, which displays maximal
response in these assays
ligand anti-HIV potency g protein signalling (%) CCr5 internalization (%)
ranTeS ~1 μM 50 64
PSC-ranTeS 25 pM 100 100
6P4-ranTeS 21 pM 88 93
5P12-ranTeS 28 pM <5 3
clustering also cause arrestin 3 clustering, except 5P14-ranTeS. This compound might thereby represent the first example of a ligand inducing recruitment of selectively one type of arrestin upon stimulation of CCr5.
Materials and methods
Materials, cell lines, and cell culture
all cell culture reagents were obtained from life Tech-nologies. Water was purified using a Milli-Q system (Mil-lipore). ranTeS and its analogues were prepared by total chemical synthesis as previously published (gaertner et al.
2008a).
Plasmids pegFP-nI with bovine arrestin 3 (Mundell et al. 2000) were a gift from Jeffrey Benovic (Thomas Jefferson University). Chinese hamster ovary cells stably expressing CCr5 (hereafter CHO-CCr5) (Hartley et al.
2004) were transfected with 0.5 μg arrestin 3-gFP plas-mid, and stable clones were obtained as described before (Truan et al. 2013).
Cells were cultured at 37 °C with 5 % CO2 in phenol-red free rPMI supplemented with 10 % foetal bovine serum, 100 units/ml penicillin, and 100 μg/ml streptomycin. For super-resolution experiments, they were plated 36–72 h beforehand on glass-bottom petri dishes (FluoroDish™, World Precision Instruments, Inc.) coated with fibronectin (Calbiochem).
Immunofluorescence
Samples for confocal microscopy and for super-resolution imaging were prepared by fixation in 4 % paraformalde-hyde as previously described (Truan et al. 2013). For super-resolution imaging, samples were further stained with a gFP-specific aTTO655-labelled gFP-Trap® nanobody
(ChromoTek) (Truan et al. 2013). When desired, samples were treated with 100 nM chemokine analogues in full medium 90 min before fixation.
Confocal microscopy
Stacks of confocal microscopy images were recorded on a Zeiss lSM700 microscope with an X63/1.4na Plan apochromat oil-immersion objective. excitation was per-formed with the 488 nm line of an ar/Kr laser, and gFP filters were used for detection. Maximum intensity projec-tions as displayed in Fig. 1 were obtained using the Zen 2011 software.
Super-resolution microscopy
Super-resolution experiments were performed on a wide-field epi-fluorescence microscope (Truan et al. 2013) with the dSTOrM (direct stochastic optical reconstruc-tion microscopy) technique (Heilemann et al. 2009) using 640 nm excitation (~3 kW/cm2, Coherent Cube 640-100-C
laser). Blinking of aTTO655 was induced with a 50 μM solution of ascorbic acid (Merck) (Cordes et al. 2010) in heavy water (D2O, 99.8 % D-atom content, armar Chemicals) (lee et al. 2013) prepared from a 1-mM stock solution in H2O. Single emitters were localized, and super-resolution images (10 × 10 nm2 per pixel) were
reconstructed with the rapidSTOrM software (version 2.13) (Wolter et al. 2010). each pixel on the eMCCD camera (andor iXoneM+ DU8987) corresponded to a 109 × 109 nm2 area in the sample plane.
Cluster analysis
ripley’s H-function (normalized form of the K-function) (ripley 1977) was calculated as previously described (Truan et al. 2013) for 5 × 5 μm2 regions of interest using
a self-written MaTlaB (The MathWorks, Inc.) routine, and edge effects were taken into account by omitting mole-cules closer than 1 μm from the edge of the region of inter-est in the calculations.
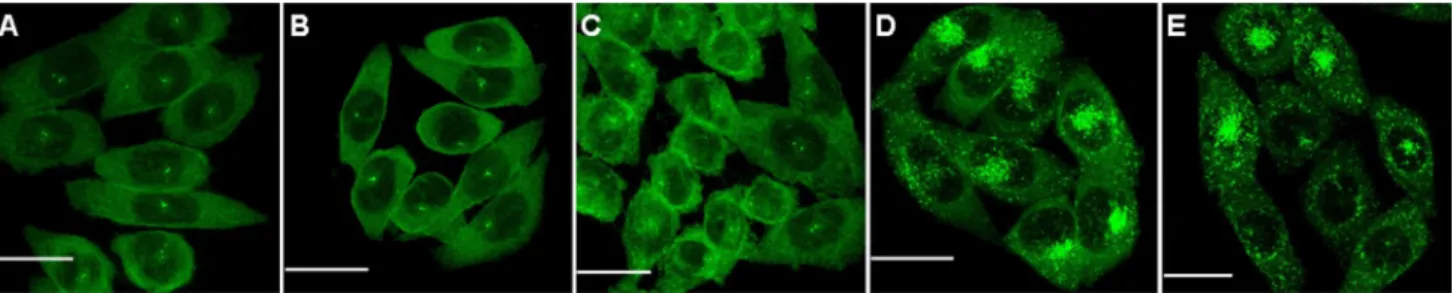
Coordinate-based co-localization (CBC)-mediated clus-ter analysis was performed using an algorithm described elsewhere (Malkusch et al. 2012). Because the algorithm Fig. 1 Confocal microscopy images (maximum intensity projection) of arrestin 3-gFP in fixed CHO-CCr5 cells in the absence of ligand (a) or
was originally written to determine co-localization of two molecules, it requires data from two channels as an input. Our data was, however, recorded in a single channel since our goal was to measure clustering of a single species. We therefore performed pre-sorting of the detected arrestin 3 molecules into molecules that were localized in odd frames and molecules that were localized in even frames, resulting in two localization files that both contain information about the distribution of the same molecules within the range of the localization accuracy (Banterle et al. 2013; nieuwen-huizen et al. 2013). By correlating the circular distributions of the arrestin 3 molecule, localizations from both locali-zation lists around a single arrestin 3 molecule with each other (Malkusch et al. 2012), a clustering value character-izing the degree of clustering could be determined for every localization. This parameter can vary between −1 and 1, a value of 1 indicating the highest probability of clustering.
localizations with clustering values above 0.7 were kept for morphological cluster analysis (custom-written soft-ware), which was performed by applying a 15-nm gaussian filter and a binary mask to the filtered data. Cluster sizes were extracted from cohesive regions in the mask, and the area of every cluster was further weighted by the integrated fluorescence intensities within every cluster to determine the fraction of arrestin 3 molecules per cluster. Cluster radii were calculated from spheres coextensive to the measured clusters.
Results
In order to visualize arrestin 3, we stably transfected CHO cells expressing CCr5 with a plasmid for arrestin 3 carry-ing a gFP fusion tag (Mundell et al. 2000). like arrestin 2, arrestin 3 proteins are randomly distributed in the cyto-plasm of resting cells (Fig. 1a). The distribution did not change when cells were exposed to a saturating concen-tration of 5P12-ranTeS or of 5P14-ranTeS (Fig. 1b, c). However, upon CCr5 stimulation with the agonists ranTeS and PSC-ranTeS (Fig. 1d, e), arrestin 3 mol-ecules were recruited from the cytosolic pool to the plasma membrane where they formed clusters (laporte et al. 2000) with dimensions around the diffraction limit, making it dif-ficult to investigate their morphology in a robust way by classical microscopy techniques.
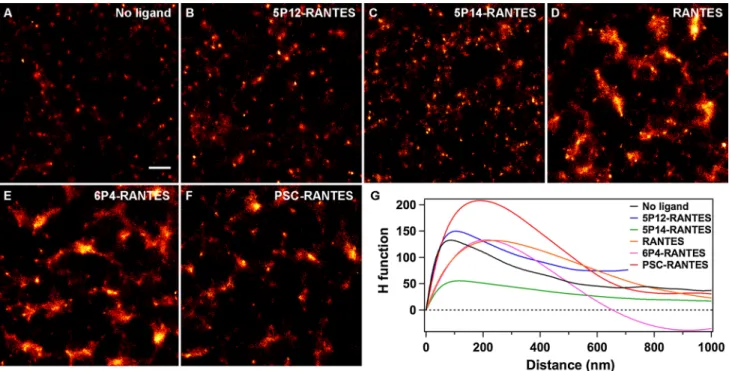
We, thus, turned to super-resolution microscopy so as to quantify the magnitude of arrestin 3 recruitment by deter-mining the size of these clusters and the relative number of arrestin 3 molecules within each cluster, using an approach that we recently successfully applied to the investiga-tion of arrestin 2 clustering and that relies on dye-labelled nanobodies selective for gFP (Truan et al. 2013; ries et al. 2012). Super-resolution images of arrestin 3 were obtained in untreated cells and in cells exposed to the dif-ferent chemokine analogues (Fig. 2a–f, Fig. S1). Images of cells treated with no ligand, with 5P12-ranTeS, or Fig. 2 representative super-resolution images of
aTTO655-nano-body-labelled arrestin 3-gFP in fixed CHO-CCr5 in the absence of ligand (a) and after treatment with different chemokine analogues for 90 min (b–f). Scale bar 0.5 μm. g ripley analysis of the dSTOrM
experiments demonstrating clustering of arrestin 3 upon stimulation of CCr5 with ranTeS, 6P4-ranTeS, and PSC-ranTeS, but not with 5P12-ranTeS or 5P14-ranTeS. The peak position is indica-tive of the typical cluster size
with 5P14-ranTeS display mainly individual proteins and small clusters, whereas much larger clusters are fre-quently visualized in cells stimulated with ranTeS, 6P4-ranTeS, or PSC-ranTeS. In order to quantify clustering, we calculated ripley’s H-function from the sin-gle-molecule coordinates obtained in the super-resolution experiment (Fig. 2g). This function is a straightforward way of characterizing the randomness of a spatial distri-bution. Positive values indicate that molecules are closer to each other than if they were homogeneously distrib-uted, which denotes clustering, and the value at which the function peaks is indicative of the average cluster size (its value is comprised between the average cluster radius and diameter). Displacement of the peak to larger values with ranTeS, 6P4-ranTeS, and PSC-ranTeS compared with untreated cells, but not with 5P12-ranTeS or 5P14-ranTeS, confirmed that the former 3 ligands selectively induce strong arrestin 3 clustering.
We next aimed at quantifying the dimensions of arrestin 3 clusters by image-based analysis of the super-resolution data (Malkusch et al. 2013; endesfelder et al. 2013; Truan et al. 2013). The goal of such analysis is to generate from each super-resolution image a binary cluster map in which every cohesive region represents a cluster whose size can then be determined by integration. Creating a binary map from a super-resolution image, which contains inten-sity information, requires, however, the application of an intensity threshold to the dSTOrM image to define clus-ter boundaries. In order to identify which localizations are part of a cluster based on a clustering parameter that can be calculated, we adapted an algorithm originally devel-oped to assess co-localization from single-molecule coor-dinates (Malkusch et al. 2012), considering that clustering is only a special case of co-localization in which all the information is collected in a single colour channel instead of two. Our coordinate-based co-localization (CBC)-medi-ated clustering algorithm (Fig. 3a) splits the list of coor-dinates obtained from a dSTOrM experiment (which is also used to reconstruct super-resolution images such as in Fig. 3b, c) into two, as if the data had been recorded in two channels, and calculates a clustering value for every locali-zation, which takes into account its direct neighbourhood (for details, see “Materials and methods” section). This clustering value can vary from −1 for anti-correlated dis-tributions through 0 for uncorrelated disdis-tributions up to 1 for perfectly correlated distributions, which would indicate a high probability of clustering. It was previously shown for co-localization analysis that overlaying two identical images with a translational shift of 10 nm results in the largest fraction of the distribution of co-localization values (analogous to the clustering values here) being above 0.7 (Malkusch et al. 2012). given the typical localization pre-cision in our super-resolution experiments of about 20 nm,
we used a minimal clustering value of 0.7 as a threshold to consider a localization as being part of a cluster and filtered out localizations with a clustering value below this threshold. CBC-mediated clustering images (Fig. 3d, e, Fig. S2) in which localizations with a clustering value above threshold are displayed in green and those below threshold in red show that rejected localizations mostly either form a cloud-like pattern throughout the cell indica-tive of single or spurious localizations or can be found at the edges of higher intensity clustered areas, thereby defin-ing the border of clusters.
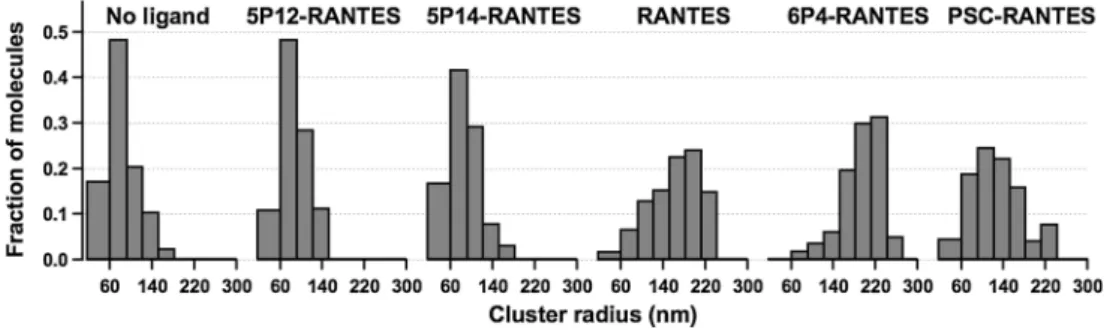
after application of the CBC-mediated clustering fil-ter to all images, clusfil-ter maps were extracted (Fig. 3f, g, Fig. S3) by applying a 15-nm gaussian blur filter, reflect-ing the finite experimental localization precision (for this reason, the clusters in the binary map, Fig. 3g, appear slightly larger than in the filtered image, Fig. 3e) (Smith et al. 2010). The area of each cohesive region was then cal-culated and weighted by its integrated fluorescence inten-sity to gain information on relative arrestin 3 molecule numbers per cluster. Figure 4 shows for each chemokine analogue the fraction of arrestin 3 as a function of clus-ter size. Clusclus-ter radii were calculated from spheres coex-tensive to the measured cluster area. In untreated cells, most arrestin 3 molecules were found in domains with a radius smaller than 120 nm, and no significant change was noticed when cells were exposed to either 5P12-ranTeS or 5P14-ranTeS, in agreement with the confocal micros-copy observations (Fig. 1). The fact that clusters, albeit of small size, are observed for these three conditions for which one could expect to find arrestin 3 homogeneously distributed throughout the cytoplasm can be ascribed to an average number of fluorophores per nanobody higher than one (1.5), to multiple detection of the same molecules due to fluorophore blinking, and to the experimental scheme requiring fluorophores to be first put into a dark state at the beginning of the experiment, inevitably leading to random but non-uniform photobleaching of dye molecules before the start of the acquisition. Similar observations were pre-viously made with arrestin 2 (Truan et al. 2013). On the other hand, upon treatment of the cells with the agonists ranTeS, 6P4-ranTeS, or PSC-ranTeS, the largest fraction of arrestin 3 molecules was found in clusters with a radius larger than 150 nm, confirming that these ligands that are all classical agonists (that is, they cause g protein activation) lead to strong clustering of arrestin 3 via CCr5.
Discussion
We have quantitatively investigated the recruitment of arrestin 3 to CCr5 using single-molecule localization microscopy and morphological cluster analysis after
stimulation of the receptor with different chemokine ana-logues. We observed that a saturating concentration of the ligands ranTeS, 6P4-ranTeS, and PSC-ranTeS, which induce both g protein signalling and lead to recep-tor internalization, induced strong arrestin 3 cluster-ing (Figs. 1, 2), whereas no arrestin 3 recruitment above
background level was observed with 5P12-ranTeS and 5P14-ranTeS, two ligands that do not activate the g pro-tein and induce no or only partial receptor internalization (Table 1). In order to extract quantitative information from the super-resolution experiments, we introduced a coordi-nate-based clustering filter derived from a coordicoordi-nate-based Fig. 3 a Flow chart of CBC-mediated cluster analysis. In
CBC-medi-ated cluster analysis, the table of localizations from the dSTOrM experiment, which is used to reconstruct super-resolution images b, c is split into two equally long tables of coordinates. a clustering value (CV) is calculated for every localization. localizations with a cluster-ing value below a 0.7 threshold are discarded. The others are kept to reconstruct a CBC-mediated clustering filtered image which is then blurred with a gaussian filter to take into account the finite localiza-tion precision of the experiment. The resulting binary image (f, g)
undergoes morphological analysis for cluster sizes and relative mole-cule numbers from every cluster to be extracted. b, c Super-resolution images of a cell exposed to 6P4-ranTeS. d, e CBC-mediated clus-tering filtered images in which every localization with a clusclus-tering value below threshold is displayed in red and with a clustering value above threshold in green. f, g Binary cluster maps extracted from the blurred CBC-mediated clustering filtered images. The yellow box in b represents the area blown up in c, e, and g. Scale bar 5 μm in b, d, f; 0.5 μm in c, e, g
Fig. 4 Distribution of arrestin
3 molecules as a function of cluster size determined from CBC-mediated morphological cluster analysis
co-localization analysis method (Malkusch et al. 2012). It enables to sort localizations based on a calculated cluster-ing value that takes into account the spatial distribution around every localization and that can be used as a thresh-old for image-based cluster analysis (Fig. 3) instead of relying on a visually set manual threshold. We successfully applied this filter to the determination of arrestin 3 clus-ter sizes and arrestin 3 distribution within these clusclus-ters. In agreement with qualitative observations, we found that the largest fraction of arrestin 3 molecules was recruited to domains with a radius of 150 nm or larger with ranTeS, 6P4-ranTeS, and PSC-ranTeS, whereas the distri-bution stayed unaltered with 5P12-ranTeS and 5P14-ranTeS compared with cells not exposed to chemokine analogues for which the domains are mostly smaller than 120 nm in radius (Fig. 4).
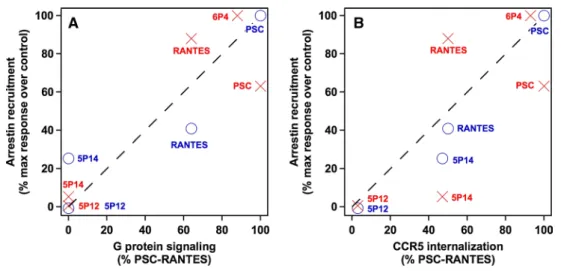
The finding that, within the tested set of ligands, only classical agonists induce arrestin 3 clustering might suggest a link between arrestin 3 recruitment and g protein activa-tion. The magnitude of arrestin 3 recruitment, calculated as the fraction of molecules found in clusters larger than 100 nm relatively to the control experiment (no ligand) and the maximal response (here 6P4-ranTeS), indeed corre-lates well with the relative magnitude of g protein signal-ling (Fig. 5a, red crosses). This conclusion differs from our recent observations on ligand-induced arrestin 2 clustering (Truan et al. 2013), where a connection between arrestin 2 clustering and CCr5 internalization had been established (Fig. 5b, blue circles). arrestin 2 and arrestin 3 have been found to be interchangeable with respect to their func-tion in many instances, in particular regarding receptor
desensitization and internalization (Pierce and lefkowitz
2001). In the case of CCr5, aramori et al. (1997) dem-onstrated that both arrestin 2 and arrestin 3 are sufficient (in conjunction with g protein-coupled receptor kinases) for the chemokine agonist MIP-1β/CCl4 to induce CCr5 internalization, with arrestin 3 being slightly more effi-cient than arrestin 2. Functional differences between the two homologues depending on some particular gPCr have, however, also been described (Pierce and lefkowitz
2001). arrestin 3 has, for example, been shown to induce
β2-adrenergic receptor internalization upon binding of the
full agonist isoproterenol 100 times more efficiently than arrestin 2 (Kohout et al. 2001).
With CCr5 and the tested set of ligands, differences in the relative magnitude of arrestin 2 and arrestin 3 recruit-ment are actually minor but for one case: ranTeS and PSC-ranTeS, which induce strong arrestin 2 cluster-ing, also lead to strong arrestin 3 clustercluster-ing, and 5P12-ranTeS does not cause mobilization of either of them; 5P14-ranTeS, however, appears capable of mediating selectively clustering of arrestin 2, not of arrestin 3. One caveat to this observation is the background clustering detected in our assay (cells not exposed to any ligand), and one cannot totally exclude that 5P14-ranTeS elicits an arrestin 3 response, which is too weak to be measured. This background level is, however, not significantly different from what was observed with arrestin 2 (Truan et al. 2013). 5P14-ranTeS might, therefore, represent the first CCr5 ligand that is biased for one arrestin over another or g pro-teins, which would only hint again (gaertner et al. 2008a; Truan et al. 2013) to the ability of this molecule to stabilize Fig. 5 relative arrestin 2 (blue) and arrestin 3 (red) recruitment
ver-sus CCr5 internalization (a) or g protein signalling efficiency (b) for the different chemokine analogues. The magnitude of arrestin recruit-ment was calculated by comparing the fraction of arrestin 3 mol-ecules found in clusters larger than 100 nm (Truan et al. 2013) com-pared with the control level (0 %), which is defined by observations
in untreated cells. arrestin 2 data were taken from (Truan et al. 2013) and reanalyzed with the CBC-mediated cluster analysis for proper quantitative comparison (differences for the values obtained by CBC-mediated cluster analysis to the originally published values lie within experimental errors and thus revalidate the visually set threshold val-ues used before)
a very special set of CCr5 conformations in comparison with other ligands. Biochemical experiments or other bio-physical assays based on the bioluminescence resonance energy transfer (BreT) technology (Bertrand et al. 2002) might be able to provide a more definitive answer to this question in the future.
Acknowledgments We thank Jeffrey Benovic (Thomas Jefferson
University) for the arrestin 3-gFP plasmid. This work was supported by the Swiss national Science Foundation through Ambizione fel-lowship PZ00P3_131935 (a.F.) and project number 310030_143789 (O.H.), as well as by Fondation Dormeur (O.H. and a.F.). M.H. acknowledges funding by the Bundesministerium für Bildung und Forschung (grant number 0315262) and the german Science Foun-dation (eXC 115).
References
aramori I, Zhang J, Ferguson SSg, Bieniasz PD, Cullen Br, Caron Mg (1997) Molecular mechanism of desensitization of the chemokine receptor CCr-5: receptor signaling and internaliza-tion are dissociable from its role as an HIV-1 co-receptor. eMBO J 16(15):4606–4616
Banterle n, Khanh Huy B, lemke ea, Beck M (2013) Fourier ring correlation as a resolution criterion for super-resolution micros-copy. J Struct Biol 183(3):363–367
Bertrand l, Parent S, Caron M, legault M, Joly e, angers S, Bouvier M, Brown M, Houle B, Menard l (2002) The BreT2/arrestin assay in stable recombinant cells: a platform to screen for com-pounds that interact with g protein-coupled receptors (gPCrs). J recept Signal Transduct res 22(1–4):533–541
Betzig e, Patterson gH, Sougrat r, lindwasser OW, Olenych S, Bonifacino JS, Davidson MW, lippincott-Schwartz J, Hess HF (2006) Imaging intracellular fluorescent proteins at nanometer resolution. Science 313(5793):1642–1645
Bockenhauer S, Fürstenberg a, Yao XJ, Kobilka BK, Moerner We (2011) Conformational dynamics of single g protein-coupled receptors in solution. J Phys Chem B 115(45):13328–13338 Cordes T, Strackharn M, Stahl SW, Summerer W, Steinhauer C,
Forthmann C, Puchner eM, Vogelsang J, gaub He, Tinnefeld P (2010) resolving single-molecule assembled patterns with super-resolution blink-microscopy. nano lett 10(2):645–651
endesfelder U, Finan K, Holden SJ, Cook Pr, Kapanidis an, Heile-mann M (2013) Multi-scale spatial organization of rna poly-merase in escherichia coli. Biophys J 105(1):172–181
escola J-M, Kuenzi g, gaertner H, Foti M, Hartley O (2010) CC chemokine receptor 5 (CCr5) desensitization—cycling recep-tors accumulate in the trans-golgi network. J Biol Chem 285(53):41772–41780
Fürstenberg a, Heilemann M (2013) Single-molecule localization microscopy—near-molecular spatial resolution in light micros-copy with photoswitchable fluorophores. Phys Chem Chem Phys 15(36):14919–14930
gaertner H, Cerini F, escola J-M, Kuenzi g, Melotti a, Offord r, rossitto-Borlat I, nedellec r, Salkowitz J, gorochov g, Mosier D, Hartley O (2008a) Highly potent, fully recombinant anti-HIV chemokines: reengineering a low-cost microbicide. Proc natl acad Sci USa 105(46):17706–17711
gaertner H, lebeau O, Borlat I, Cerini F, Dufour B, Kuenzi g, Melotti a, Fish rJ, Offord r, Springael JY, Parmentier M, Hart-ley O (2008b) Highly potent HIV inhibition: engineering a key anti-HIV structure from PSC-ranTeS into MIP-1 beta/CCl4. Protein eng Des Sel 21(2):65–72
gesty-Palmer D, luttrell lM (2011) refining efficacy: exploit-ing functional selectivity for drug discovery. adv Pharmacol 62:79–107
Hartley O, gaertner H, Wilken J, Thompson D, Fish r, ramos a, Pas-tore C, Dufour B, Cerini F, Melotti a, Heveker n, Picard l, ali-zon M, Mosier D, Kent S, Offord r (2004) Medicinal chemistry applied to a synthetic protein: development of highly potent HIV entry inhibitors. Proc natl acad Sci USa 101(47):16460–16465 Heilemann M, van de linde S, Mukherjee a, Sauer M (2009)
Super-resolution imaging with small organic fluorophores. angew Chem Int ed 48(37):6903–6908
Hell SW (2007) Far-field optical nanoscopy. Science 316(5828):1153–1158
Hess ST, girirajan TPK, Mason MD (2006) Ultra-high resolution imaging by fluorescence photoactivation localization microscopy. Biophys J 91(11):4258–4272
Karim Qa, Karim SSa, Frohlich Ja, grobler aC, Baxter C, Mansoor le, Kharsany aBM, Sibeko S, Mlisana KP, Omar Z, gengiah Tn, Maarschalk S, arulappan n, Mlotshwa M, Morris l, Taylor D, grp CT (2010) effectiveness and safety of tenofovir gel, an antiretroviral microbicide, for the prevention of HIV infection in women. Science 329(5996):1168–1174
Kenakin T, Christopoulos a (2013) Signalling bias in new drug dis-covery: detection, quantification and therapeutic impact. nat rev Drug Discov 12(3):205–216
Kenakin T, Watson C, Muniz-Medina V, Christopoulos a, novick S (2012) a simple method for quantifying functional selectivity and agonist bias. aCS Chem neurosci 3(3):193–203
Kobilka BK, Deupi X (2007) Conformational complexity of g-pro-tein-coupled receptors. Trends Pharmacol Sci 28(8):397–406 Kohout Ta, lin FT, Perry SJ, Conner Da, lefkowitz rJ (2001)
Beta-arrestin 1 and 2 differentially regulate heptahelical receptor sign-aling and trafficking. Proc natl acad Sci USa 98(4):1601–1606 Kuhmann Se, Hartley O (2008) Targeting chemokine receptors in
HIV: a status report. annu rev Pharmacol Toxicol 48:425–461 laporte Sa, Oakley rH, Holt Ja, Barak lS, Caron Mg (2000) The
interaction of beta-arrestin with the aP-2 adaptor is required for the clustering of beta(2)-adrenergic receptor into clathrin-coated pits. J Biol Chem 275(30):23120–23126
lederman MM, Veazey rS, Offord r, Mosier De, Dufour J, Mefford M, Piatak M Jr, lifson JD, Salkowitz Jr, rodriguez B, Blau-velt a, Hartley O (2004) Prevention of vaginal SHIV transmis-sion in rhesus macaques through inhibition of CCr5. Science 306(5695):485–487
lee SF, Vérolet Q, Fürstenberg a (2013) Improved super-resolution microscopy with oxazine fluorophores in heavy water. angew Chem Int ed engl 52(34):8948–8951
lefkowitz rJ, Shenoy SK (2005) Transduction of receptor signals by beta-arrestins. Science 308(5721):512–517
luttrell lM, Ferguson SSg, Daaka Y, Miller We, Maudsley S, Della rocca gJ, lin FT, Kawakatsu H, Owada K, luttrell DK, Caron Mg, lefkowitz rJ (1999) Beta-arrestin-dependent formation of beta(2) adrenergic receptor Src protein kinase complexes. Sci-ence 283(5402):655–661
Malkusch S, endesfelder U, Mondry J, gelleri M, Verveer PJ, Heile-mann M (2012) Coordinate-based colocalization analysis of sin-gle-molecule localization microscopy data. Histochem Cell Biol 137(1):1–10
Malkusch S, Muranyi W, Muller B, Krausslich Hg, Heilemann M (2013) Single-molecule coordinate-based analysis of the mor-phology of HIV-1 assembly sites with near-molecular spatial resolution. Histochem Cell Biol 139(1):173–179
Moerner We (2012) Microscopy beyond the diffraction limit using actively controlled single molecules. J Microsc 246(3):213–220 Moore CaC, Milano SK, Benovic Jl (2007) regulation of receptor
Mundell SJ, Matharu al, Kelly e, Benovic Jl (2000) arrestin iso-forms dictate differential kinetics of a(2B) adenosine receptor trafficking. Biochemistry 39(42):12828–12836
nieuwenhuizen rP, lidke Ka, Bates M, Puig Dl, grunwald D, Stall-inga S, rieger B (2013) Measuring image resolution in optical nanoscopy. nat Methods 10:557–562
Owen DM, Williamson DJ, Boelen l, Magenau a, rossy J, gaus K (2013) Quantitative analysis of three-dimensional fluorescence localization microscopy data. Biophys J 105(2):l05–l07 Pierce Kl, lefkowitz rJ (2001) Classical and new roles of
beta-arres-tins in the regulation of g-protein-coupled receptors. nat rev neurosci 2(10):727–733
rask-andersen M, almen MS, Schioth HB (2011) Trends in the exploitation of novel drug targets. nat rev Drug Discov 10(8):579–590
ries J, Kaplan C, Platonova e, eghlidi H, ewers H (2012) a simple, versatile method for gFP-based super-resolution microscopy via nanobodies. nat Methods 9(6):582–584
ripley BD (1977) Modelling spatial patterns. J roy Statist Soc B 39:172–212
rosenbaum DM, rasmussen SgF, Kobilka BK (2009) The struc-ture and function of g-protein-coupled receptors. nastruc-ture 459(7245):356–363
rust MJ, Bates M, Zhuang XW (2006) Sub-diffraction-limit imaging by stochastic optical reconstruction microscopy (STOrM). nat Methods 3(10):793–795
Santini F, gaidarov I, Keen JH (2002) g protein-coupled receptor/arrestin3 modulation of the endocytic machinery. J Cell Biol 156(4):665–676
Sengupta P, Jovanovic-Talisman T, Skoko D, renz M, Veatch Sl, lippincott-Schwartz J (2011) Probing protein heterogeneity in the plasma membrane using PalM and pair correlation analysis. nat Methods 8(11):969–975
Smith CS, Joseph n, rieger B, lidke Ka (2010) Fast, single-mole-cule localization that achieves theoretically minimum uncertainty. nat Methods 7(5):373–375
Specht Cg, Izeddin I, rodriguez PC, el Beheiry M, rostaing P, Dar-zacq X, Dahan M, Triller a (2013) Quantitative nanoscopy of inhibitory synapses: counting gephyrin molecules and receptor binding sites. neuron 79(2):308–321
Truan Z, Tarancón Díez l, Bönsch C, Malkusch S, endesfelder U, Munteanu M, Hartley O, Heilemann M, Fürstenberg a (2013) Quantitative morphological analysis of arrestin 2 clustering upon g protein-coupled receptor stimulation by super-resolution microscopy. J Struct Biol 184(2):329–334
Wolter S, Schüttpelz M, Tscherepanow M, Van de linde S, Heile-mann M, Sauer M (2010) real-time computation of subdiffrac-tion-resolution fluorescence images. J Microsc 237(1):12–22 Zidar Da (2011) endogenous ligand bias by chemokines:
impli-cations at the front lines of infection and leukocyte trafficking. endocr Metab Immune Disord Drug Targets 11(2):120–131