The MIT Faculty has made this article openly available. Please share
how this access benefits you. Your story matters.
Citation Xie, Yifei et al. “Behavioral Modeling of On-Demand Mobility
Services: General Framework and Application to Sustainable Travel Incentives.” Transportation 46, 6 (December 2019): 2017–39.
As Published http://dx.doi.org/10.1007/S11116-019-10011-Z
Publisher Springer Science and Business Media LLC
Version Author's final manuscript
Citable link https://hdl.handle.net/1721.1/125428
Terms of Use Creative Commons Attribution-Noncommercial-Share Alike
3
Yifei Xie, Corresponding Author 4
Massachusetts Institute of Technology 5
77 Massachusetts Ave, Cambridge, MA 02139 6 yifeix@mit.edu 7 8 Mazen Danaf 9
Massachusetts Institute of Technology 10
77 Massachusetts Ave, Cambridge, MA 02139 11
mdanaf@mit.edu 12
13
Carlos Lima De Azevedo 14
Technical University of Denmark 15
Anker Engelunds Vej 1 Bygning 101A, 2800 Kgs. Lyngby, Denmark 16 climaz@dtu.dk 17 18 A. Arun Prakash 19
Massachusetts Institute of Technology 20
77 Massachusetts Ave, Cambridge, MA 02139 21 arunprak@mit.edu 22 23 Bilge Atasoy 24
Delft University of Technology 25
Mekelweg 2, 2628 CD, Delft, The Netherlands 26 b.atasoy@tudelft.nl 27 28 Kyungsoo Jeong 29
Massachusetts Institute of Technology 30
77 Massachusetts Ave, Cambridge, MA 02139 31 kjeong@mit.edu 32 33 Ravi Seshadri 34
Singapore-MIT Alliance for Research and Technology (SMART) 35
1 CREATE Way, #09-02 CREATE Tower, Singapore 138602 36 ravi@smart.mit.edu 37 38 Moshe Ben-Akiva 39
Edmund K. Turner Professor of Civil and Environmental Engineering 40
Massachusetts Institute of Technology 41
77 Massachusetts Ave, Cambridge, MA 02139 42
mba@mit.edu 43
44
Word count: 6,698 words text + 3 tables x 250 words (each) = 7,448 words 45
Submission Date: November 15th, 2018
ABSTRACT 1
This paper presents a systematic way of understanding and modelling traveler behavior in 2
response to on-demand mobility services. We explicitly consider the sequential and yet inter-3
connected decision-making stages specific to on-demand service usage. The framework includes 4
a hybrid choice model for service subscription, and three logit mixture models with inter-5
consumer heterogeneity for the service access, menu product choice and opt-out choice. 6
Different models are connected by feeding logsums. The proposed modelling framework is 7
essential for accounting the impacts of real-time on-demand system’s dynamics on traveler 8
behaviors and capturing consumer heterogeneity, thus being greatly relevant for integrations in 9
multi-modal dynamic simulators. The methodology is applied to a case study of an innovative 10
personalized on-demand real-time system which incentivizes travelers to select more sustainable 11
travel options. The data for model estimation is collected through a smartphone-based context-12
aware stated preference survey. Through model estimation,lower VOTs are observed when the 13
respondents opt to use the reward system. The perception of incentives and schedule delay by 14
different population segments are quantified. The obtained results are fundamental in setting the 15
ground for different behavioral scenarios of such a new on-demand system. The proposed 16
methodology is flexible to be applied to model other on-demand mobility services such as ride-17
hailing services and the emerging MaaS (Mobility as a service). 18
19
Keywords: smart mobility, on-demand, incentives, travel behavior, stated preference,
20
sustainability, smartphone app 21
1 INTRODUCTION 1
In recent years, emerging new mobility services, including ride-hailing, ride-sharing, bike-2
sharing, and carsharing systems have gained popularity worldwide. Uber, which operates in 600 3
cities across 78 countries, gave four billion rides worldwide in 2017 alone, while it has just hit 4
five billion total rides in May 2017 since its first appearance (1). In China, DiDi Chuxing 5
completed 7.43 billion rides for 450 million users in more than 400 cities in the same year (2). 6
The French-born peer-to-peer carpooling digital platform BlaBlaCar claims to have 60 million 7
members in 22 countries and serves over 18 million travelers every quarter (3). The attempts to 8
design, test and implement MaaS (Mobility as a service) platforms which vend travel packages 9
integrated from different service providers have also emerged in the last 5 years. 10
The success and the still growing interest in these new mobility solutions are largely due 11
to the advancement of Information and Communications Technologies (ICTs) in that these 12
services usually enable on-demand, efficient, convenient and personalized usage through mobile 13
applications. All these mobility services usually require users to (i) subscribe (register) to a given 14
service, (ii) request a service menu with product option(s) through a mobile application and (iii) 15
select the preferred product. We refer to this broad group of mobility services as on-demand 16
services. 17
When designing a new transportation service/mode, predicting its demand and its 18
sensitivity with respect to service attributes is critical. Currently, the state-of-the-art approaches 19
rely on disaggregate behavioral modelling and activity-based models or ABM (4, 5). These 20
models are commonly based on discrete choice methodology and random utility maximization 21
(6, 7). Since on-demand mobility services are often dynamically tailored to different individual 22
preferences and contexts (time-of-day, supply demand matching), disaggregate behavioral 23
models are essential for the accommodation of their complex dynamics which enables the 24
quantification of user benefits and overall transportation impacts (such as congestion and other 25
externalities). Constructing and understanding these models are thus of great interest to 26
researchers, practitioners and service providers. 27
Current research on the behavior side of on-demand mobility services mainly focuses on 28
exploring the behavioral insights qualitatively based on aggregate analysis of surveys (e.g. 8,9). 29
As indicated by Jittrapirom et al. (10), models for MaaS or other on-demand mobility services 30
have been limited so far. 31
To the best of our knowledge, discrete choice models for on-demand mobility service 32
have been focusing only on either the subscription choice or the product choice. In both cases, 33
usually the service access action (i.e., opening the app) and its impact are not considered. To 34
name a few efforts put in these two streams, Ghose and Han (11) investigated the demand 35
(number of downloads) of apps through a 3-level nested logit with consumer taste heterogeneity 36
and nests divided by app attributes. Zoepf and Keith (12) estimated a logit mixture with taste 37
heterogeneity to evaluate how carsharing users value each attribute displayed in a product menu. 38
Dias et al. (13) used a bivariate ordered probit model for the use of ride-hailing and car-sharing 39
services in terms of weekly usage frequencies. Matyas and Kamargianni (14) investigated 40
subscription preferences towards Maas with various product bundles by logit mixtures with taste 41
heterogeneity. Choudhury et al. (15) used nested logit to model the mode choice between smart 42
mobility solutions and existing modes, along with other choice dimensions. While the methods 43
in these papers are useful to draw behavioral insights for a specific episode of the decision 44
process, they are missing the connections between the episodes. These segmented treatments 45
could potentially result in inaccurate conclusions and make it hard to engage the models in 1
simulations without placing assumptions on the unmodeled decision stages (e.g. if one has only 2
modelled the mode choice decision, he/she would have to assume a penetration rate for 3
subscription in simulation). 4
In the greater context of modelling car ownership or service subscriptions, the inter-5
connections between short-term and long-term decisions have been studied (e.g. 16, 17, 18).The 6
uniqueness of on-demand mobility service usage arises from an additional level of decision – 7
whether to access the service menu. This level requires specific treatment to capture the 8
behaviors of travelers who checked the service menu but opted out and who didn’t bother 9
checking the menu because they expect unattractive options would had been offered. These 10
behaviors are especially relevant for on-demand services which present their service menu 11
dynamically in real-time. 12
This paper fills the aforementioned gaps by developing a framework which explicitly 13
considers and integrates all decision-making stages of on-demand service usage, including the 14
real-time and dynamic aspects of such service. Inter-consumer heterogeneity is captured through 15
logit mixtures with distributed taste coefficients. The modelling framework could be either used 16
as a stand-alone or embedded within common ABM frameworks. 17
Our methodology could be applied to a broad range of on-demand services such as ride-18
hailing, carsharing and Maas. The capability and flexibility of it are illustrated through a case 19
study on Tripod – an innovative on-demand incentive scheme (19). Tripod doesn’t provide a 20
mobility service per se but offers incentives for more energy efficient travel options through a 21
personalized real-time travel menu. 22
The remainder of the paper is organized as follows. In the second section, we propose our 23
modelling framework. In the third section we present the data collection for the case study, 24
followed by model specifications and estimation shown in section 4. Finally, the conclusions are 25
provided in the last section. 26
2 MODELLING FRAMEWORK FOR ON-DEMAND SERVICES 1
The decision-making process relevant to an on-demand mobility service is depicted in Figure 1. 2
3
Figure 1 Conceptualized decision-making process in on-demand app usage 4
First of all, a person needs to decide whether to subscribe to a given service. This choice 5
is represented by the subscription model. It typically involves downloading the app (if app-6
based) and registering. With the goal to model the behavior in service usage, the subscription 7
here refers to people who actually consider to use the service on a regular basis. If a traveler 8
doesn’t subscribe to the on-demand service of interest, then upon travel, he/she makes a regular 9
choice, i.e., the choice set excludes options offered by this service.
10
For a subscriber, the first decision prior to trip-making is whether to access the service 11
and view the offered products at all, which is represented by the service access model. This may 12
be conditional on the context (e.g., trip purpose, traveling party) or the user’s past experience 13
with the service. Sometimes travelers don’t consider using a service as they expect the operator 14
to offer unattractive terms (for example they might expect higher price in rush hours) and 15
therefore do not check the menu – while what is offered in the menu might actually be attractive. 16
The explicit modelling of service access model captures this behavior. 17
In Figure 1 we represent the choice situation of a subscriber who doesn’t access the 18
service and that of the non-subscribers by the same model, however, it doesn’t mean that the 19
traveler should behave identically under these two situations. This potential behavioral difference 20
could be incorporated in the model specification by segmentation. 21
If the user decides to access the service, a service menu would be presented and the user 22
would evaluate the products through a menu product choice model (see an example of a product 23
menu in Figure 2 (b)). If the user likes one of the products in the menu, he/she would select it 24
and execute the trip. The user may also reject the entire menu (opt-out) and choose some other 25
alternative outside the on-demand service at stake. 26
For subscribers, the choice situation after opt-out (informed regular choice in Figure 1) is 27
different from the one without opening the app (regular choice in Figure 1) in that the options 28
offered by on-demand mobility services usually also provide users with real-time information 29
(e.g., availability of alternatives, travel time estimates). The impact of information is discussed in 30
Ben-Akiva et al. (20) and Mahmassani and Lin (21). For example, if a traveler checks a car-1
based ride-hailing app prior to travel during a congested period and opts out, she/he may be more 2
likely to select non-road modes. 3
Based on the sequential nature of the above-described decision process, higher level 4
choices influence lower level ones. However, lower levels have significant impacts on the upper 5
levels as well. When a traveler makes the subscription decision, the major consideration is 6
whether the mobility service is attractive, which is reflected through the experience and 7
perceived benefits of using the corresponding mobility service, including the app. Furthermore, 8
whether to access the service for a given trip depends on users’ perceptions of the attractiveness 9
of the menu given the context of the trip, the attributes of the potential service products and the 10
user’s sensitivities towards them. To capture this bottom-up dependency, a multi-level nesting 11
structure is proposed. The logsums feedings between levels provide measurements of 12
attractiveness of the lower levels, and their coefficients show the corresponding sensitivities. 13
In conclusion, five choice models should be considered in order to model an on-demand 14
mobility service: (1) a subscription model, (2) a service access model, (3) a menu product choice 15
model, (4) an informed regular choice model for those who opts out, (5) a regular choice model
16
for uninformed users. 17
The logsum passing directions are illustrated in Figure 1 by dashed lines. By definition, 18
logsum represents the expected maximum utility from the corresponding lower level. We want to 19
stress two logsum computations that require additional attention. First, the logsum from the menu 20
product choice model to service access model should depend on what the users expect to see,
21
rather than what would be truly offered. An example of how this is handled in the context of our 22
case study could be found in section 4.1. Second, the long-term logsum (green dashed lines in 23
Figure 1) should be computed based on corresponding lower level models applied to multiple 24
trip contexts pertinent to the traveler and weighted according to their frequency and/or 25
importance. 26
To estimate the modelling framework we described, a dataset which covers the complete 27
decision sequence is desired. While the menu product choice and subscription choice are 28
straight-forward to elicit, the service access choice is intricate. If revealed preferences (RP) data 29
is used, besides the trips and the choice that are common to most RP datasets, it has to contain 30
information regarding service access actions. These could be acquired by tracking the 31
respondents’ smartphones or by including related questions (e.g., “did you access Uber App for 32
this trip?”) in the RP survey. While the first one requires additional efforts in the data collection, 33
the second may cause under-reporting of the access-then-opt-out behavior. On the other hand, if 34
SP data is used, service access process needs to be presented and the corresponding choice needs 35
to be recorded. In sections 3 and 4 we describe how we addressed this by smartphone-based SP 36
in the context of Tripod. 37
38
3 CASE STUDY: TRIPOD BACKGROUND AND DATA COLLECTION 39
3.1 Tripod Overview 40
Tripod is an app-based on-demand system that influences individuals’ real-time travel decisions 41
by offering them information and incentives with the objective of achieving system-wide energy 42
savings (19). The travel decisions of interest are mode, route, departure time, trip-making and 43
driving style. In response to any changes in any of the above dimensions, users receive 44
incentives in the form of tokens that can then be redeemed in a market place for a variety of 1
goods and services. Like in the above-mentioned decision process, a Tripod user has to subscribe 2
to the app and decide whether to request a Tripod menu before each trip. The menu is presented 3
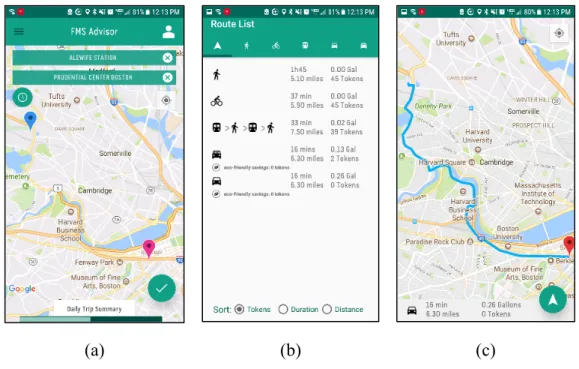
to the user (see Figure 2) with information about the recommended options and their tokens. The 4
tokens for each alternative are calculated based on the energy savings from the expected choice 5
and the menu is personalized according to the user’s preferences, characteristic and network 6
attributes (22). The user may select an option from the menu and use the Tripod app to navigate 7
to the destination or opt out. In the first case, the app monitors the travel of the user and rewards 8
her/him at the end of the trip if the guidance was followed. 9
(a) (b) (c)
Figure 2 User interface of the Tripod app 10
*From left to right: (a) filling in destination and requesting a menu with options (b) menu 11
displayed (c) guidance provided and trip being monitored 12
13
3.2 Data Collection Method 14
In this section we describe the data collection for Tripod, which is based on the methodology 15
proposed by Atasoy et al. (23). 16
The core data collection platform is the smartphone-based Future Mobility Sensing 17
(FMS) (24, 25, 26). It overcomes the main limitations associated with the traditional “paper-and-18
pencil” or purely web-based questionnaires, such as under-reporting of trips, inaccurate time and 19
location information, high cost, and lack of detailed route information (25). FMS typically 20
collects high quality RP data. In this study, a context-aware SP was integrated into FMS for 21
preferences towards Tripod. Pre- and post-surveys (also integrated within the app) elicit 22
information on socio-demographics and long-term preferences and perceptions, respectively. 23
Data collection was carried out in Boston-Cambridge region and its vicinity where 1940 24
observations from 202 participants were obtained, out of which 154 participants have finished 25
the required 14 days of responses and exited the survey at the time of writing this paper (July 1
2018). Each respondent who had provided 14 days of RP data and completed the corresponding 2
SP was rewarded with a 100-dollar Amazon gift card1.
3 4
3.2.1 Pre-survey Data
5
Upon downloading the app and registering, respondents were asked to fill out the pre-survey. 6
They were asked about their socio-demographic characteristics, such as age, gender, working 7
status, income, car ownership, bike ownership, and how frequently they use different 8
transportation modes. 9
10
3.2.2 Revealed Preferences Data
11
After completing the pre-survey, RP data was collected in the form of trip and activity diaries. 12
The app collects location data (GPS, WiFi, GSM) on a continuous basis. The data is processed in 13
the backend for stop detection and inference for trip mode and activity type. The app interface 14
presents partially filled activity diaries and reminds the respondents to validate their trip and 15
activity diaries at the end of each day. For activities, the data included activity purpose, location, 16
start and end times. For trips, the origin, destination, travel mode, arrival and departure times 17
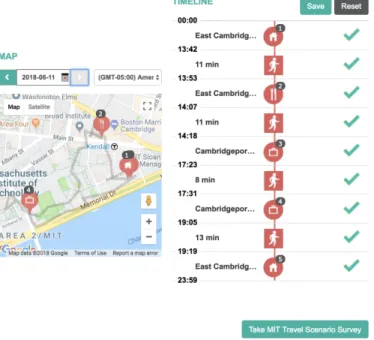
were obtained. Figure 3 shows an example of a validated trip/activity diary. More details 18
available in Cottrill et al. (24) and Zhao, et al. (25). 19
20
Figure 3 Trip/activity diary validation 21
1 In the same data collection effort, SP surveys were also generated for another mobility survey
(23). The 14 surveys required for each respondent are a mixture of the two (randomly presented with a higher frequency of Tripod appearance).
3.2.3 Stated Preferences Data
1
Upon validating their diaries, respondents were presented with daily SP questions. For each 2
validated day, a trip is randomly selected and the respondent is asked about his/her choice if the 3
trip had to be repeated under a hypothetical scenario (Figure 4 (a)). 4
The context-aware SP we adopted is different from the conventional SP’s in that the 5
context of the experiments, although being still hypothetical, is coming from the accurately 6
collected RP data. Furthermore, the respondent-specific information collected in advance 7
through the pre-survey, such as, vehicle ownership, usage of car/bike sharing services, etc. is 8
used in the SP survey generation process as constraints. Google Maps API is used on the fly in 9
order to obtain the travel times and distances associated with different modes corresponding to 10
the specific trip. As a result, we expect our SP to be closer to the true decision-making scenarios 11
and hence able to elicit more realistic responses compared to alternative state-of-the-art SP 12
approaches (23). 13
Each SP choice task is presented through a “profile”, defined as a menu that includes all 14
travel alternatives available to the respondent (along with their attributes), with the addition of a 15
Tripod menu including options provided by Tripod (see example in Figure 4 (b), (c)). 16
The set of alternatives might include non-motorized modes (walking, biking, and bike-17
sharing), private motorized modes (car and carpooling), on-demand modes (e.g. Uber/UberPool, 18
Lyft/Lyft Line, carsharing, and taxi), and transit (with walk, bike, or car access). The attributes 19
of these alternatives are presented in Atasoy et al. (23). Each of these sets are shown in a separate 20
tab, alongside the tab for Tripod menu (Figure 4 (b), (c)). Furthermore, respondents are presented 21
with ranges that reflect uncertainty in the attributes such as travel time and waiting time. 22
The Tripod menu presents a subset of the existing alternatives with changes across 23
multiple dimensions that generate energy savings, e.g., the departure time may be delayed 24
(between 15 and 90 minutes), a different route or driving in an eco-friendly way may be 25
presented. Information on energy savings (relative to the RP choice) and tokens assigned to 26
alternatives are also presented. Energy consumption values are obtained from TripEnergy (27). 27
Only alternatives with positive energy savings could be included in this menu. 28
Upon accessing the SP for the first time, respondents are presented with a “marketplace” 29
showing the items that can be purchased with tokens (Figure 4 (d)). The redemption value of 30
tokens is fixed for each individual. The marketplace is accessible to the respondents throughout 31
the SP. 32
SP Profiles are generated based on a random design and validated using validity checks 33
that eliminate dominant and inferior alternatives or unrealistic attribute combinations. The profile 34
generation algorithm was validated using Monte-Carlo simulations. During each SP session, 35
respondents’ actions on the app are tracked. 36
(a) (b) (c) (d) Figure 4 Tripod SP: trip context options and market place
1
*From left to right: (a) recall of trip context; (b) an option in Tripod tab; (c) an option in Drive 2
tab; (d) the market place for a respondent 3
4
3.2.4 Post-survey Data
5
Upon completing two weeks of data collection, respondents are presented with the post-survey, 6
which collects feedback on the potential use of Tripod if it existed in real life, attitudes and 7
perceptions towards energy consumption, environment, mobile apps and technology in general. 8
As an example, respondents rate statements like “I would use Tripod if it were available today” 9
on a 5-point Likert scale (see section 4 for more details). 10
11
3.3 Sample Characteristics 12
After data cleaning, sessions completed within 10 seconds were excluded (likely 13
correspond to random selections), as well as profiles corresponding to trips with very long 14
distances (e.g. flights and inter-city trips). As a result, 1155 surveys from 183 individuals are 15
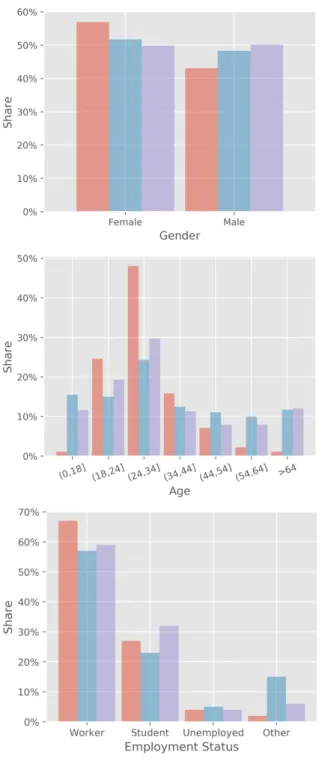
used in the analysis. Figure 5 shows the sample distributions of age, number of household 16
vehicles, gender, household income, and employment status compared to the population 17
distributions in the survey region based on American Community Survey (ACS) (28). For 18
employment status distribution in the population, we only considered population 16 years old 19
and over because younger population is not considered as the market of Tripod (limited 20
discretion and not allowed to drive). Since the survey is smartphone-based, the sample is biased 21
towards young respondents as expected. In addition, females and household income group $50k 22
to $99k (annual) are slightly oversampled. 23
Figure 5 Sample characteristics 1
2
4 CASE STUDY: MODEL FORMULATION AND ESTIMATION 3
In this section, we apply the model structure proposed in section 2 to the case of Tripod and we 4
formulate and estimate each model component with the data described in section 3. 5
In our SP setting, we present attributes (such as travel time and cost) of all the 6
alternatives to the respondents and expect them to assume the values are real. As a result, the 7
regular choice model which should be based on expected attributes under uninformed conditions
cannot be estimated using the SP data. To circumvent this difficulty, we estimated the informed 1
regular choice model and used it as the regular choice model in the logsum calculations for
2
model estimation as an approximation. We refer to this model as regular choice model in the rest 3
of the paper. Due to the limited sample size, the behavioral of subscribers and non-subscribers 4
are not differentiated in regular choice model. 5
The models are estimated sequentially from the bottom in the following order: regular 6
choice model, menu product choice, service access model and subscription model. This allows us
7
to compute the logsums of the lower levels which is required for the estimations of higher-level 8
models. The model specifications and results are presented in this order as well. 9
10
4.1 Model formulation and specification 11
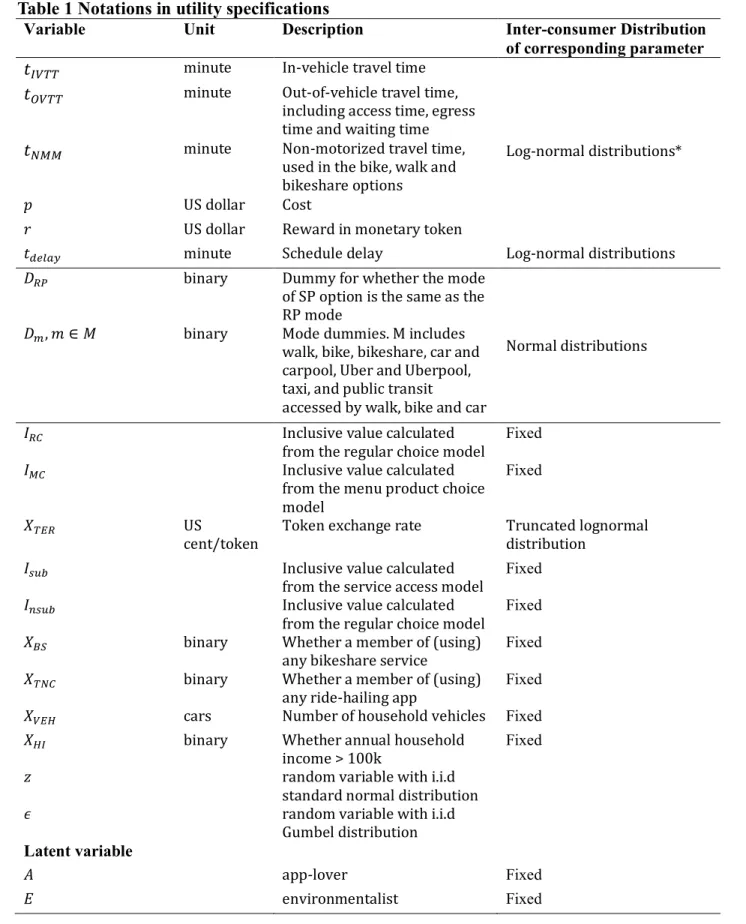
The utility equations of each model are specified below. The notations are explained in Table 1. 12
𝛽, 𝛼, 𝛿, 𝜆, 𝜎, and 𝐴𝑆𝐶 are the coefficients to be estimated. Selected mode in the corresponding 13
RP trip is considered in the utility equations to capture inertia. Binary variables are denoted as 14
𝐷’s. 15
Regular choice model
16
Equation (1) shows the utility specification for an alternative in the regular choice model. 17
The travel time is divided into in-vehicle travel time, out-of-vehicle travel time and non-18
motorized travel time. 19 20 𝑈+,-.+/ = −𝑒3!"##𝑡 5677− 𝑒3$"##𝑡8677− 𝑒3%&&𝑡9::− 𝑒3'𝑝 + 𝛽./=>-.?𝐷@A + B 𝛽C𝐷C C∈: + 𝜖 21 22
Menu product choice model
23
Equation (2) shows the utility specification for an option in the menu while equation (3) 24
shows it for the opt-out option. To capture respondents’ perceptions of the value of the tokens, 25
we include the tokens as monetary value ($) converted by the token exchange rate that had been 26
randomly assigned to the respondents upon their registration of the survey (the rate is implicitly 27
indicated to them by the price of goods in the marketplace, see Figure 4 (d)). 28 29 𝑈C=/F +,-.+/ = −𝑒3!"##𝑡5677− 𝑒3$"##𝑡8677 − 𝑒3%&&𝑡9::− 𝑒3'𝑝 + 𝛽 ./=>-.?𝐷@A + B 𝛽C𝐷C C∈: 30 + 𝑒3(𝑟 − 𝑒3)*+,-logL𝑡 M=N?O + 1Q + 𝜖 31 32 𝑈+F- = 𝐴𝑆𝐶+F-+ 𝛽5+F-𝐼@S+ 𝜖 33 34
Service access model
35
Equations (4) and (5) show the utilities of accessing and not accessing the mobile app in 36
the service access model respectively. 37 38 𝑈/?T = 𝐴𝑆𝐶/?T+ 𝛽5/?T𝐼@S+ 𝜖 39 40 𝑈?T = 𝐴𝑆𝐶?T+ 𝑒3#./𝑋7V@ + 𝛽5?T𝐼:S+ 𝜖 41 (1) (2) (3) (4) (5)
As mentioned in section 2, the logsum entering equation (5) should be based on what the 1
respondents expect to see rather than what is truly offered. Tripod’s personalization algorithm 2
limits the number of offered alternatives (currently to 5). Based on past experience, a respondent 3
might be expecting a different set of alternatives than the one that is generated from the 4
personalization algorithm for a trip. In this case, he/she would still access the service in the first 5
place. Thus, in our estimation we used all the possible alternatives (the ones with energy-savings 6
and hence positive incentives) from Tripod before the personalization for logsum calculation 7
rather than what would truly appear on the single trip-specific menu. This provides us with an 8
optimistic approximation of respondents’ expectations. Ideally a behavioral expectation model 9
would be necessary to couple with the logsum transfer. This modeling and data collection effort 10
is however left for future work. The same practice should be carried out accordingly when 11
applying the estimated model in simulation. 12
13
Subscription Model
14
We formulate the subscription model as a hybrid choice model. Equations (6) and (7) 15
show the structural equations for the latent variables “app-lover” and “environmentalist”. 16
Equations (8) and (9) show the measurement equations of the latent variables with their 17
corresponding questions specified in Table 1. Equation (10) shows the utility of app subscription. 18 19 𝐴 = 𝐴𝑆𝐶W+ 𝛽XY𝑋XY+ 𝛽79S𝑋79S + 𝜎W𝑧 20 21 𝐸 = 𝐴𝑆𝐶V + 𝛽6V\(𝑋6V\ > 1) + 𝛽\5𝑋\5 + 𝜎V𝑧 22 23 𝑖W/ = 𝛼W/+ 𝜆W/𝐴 + 𝜖, 𝑓𝑜𝑟 𝑛 = 1,2,3 24 25 𝑖V/ = 𝛼V/ + 𝜆V/𝐸 + 𝜖, 𝑓𝑜𝑟 𝑛 = 1,2,3 26 27 𝑈gFhgT>.h= = 𝐴𝑆𝐶gFh+ 𝛽W𝐴 + 𝛽V𝐸 + 𝛽5gFh𝐼gFh+ 𝛽5/gFh𝐼/gFh+ 𝜖 28 29
The responses to the indicators of measurement equations and whether to subscribe are in 30
5-point Likert scales ranging from “strongly disagree” to “strongly agree”. As the error terms in 31
equations (8), (9) and (10) follow the Gumbel distribution, the models of the responses are in 32
forms of ordinal logit. Due to the limited sample size and the answers being framed as 33
symmetric, we assumed the to-be-estimated threshold values to be symmetric as shown in 34
equation (11) using the ones for the whether-to-subscribe question as an example. The thresholds 35
for each question of each latent variable are estimated separately. In section 4.2, the estimated 36
thresholds are subscripted according to the measurement equations’ subscripts. 37 38 strongly disagree −∞ < 𝑈 < −𝛿g,t− 𝛿g,u disagree −𝛿g,t− 𝛿g,u < 𝑈 < −𝛿g,t neither agree nor disagree if −𝛿g,t < 𝑈 < 𝛿g,t agree 𝛿g,t < 𝑈 < 𝛿g,t+ 𝛿g,u strongly agree 𝛿g,t+ 𝛿g,u < 𝑈 < ∞ (6) (7) (8) (9) (10) (11)
Table 1 Notations in utility specifications 1
Variable Unit Description Inter-consumer Distribution
of corresponding parameter 𝑡5677 minute In-vehicle travel time Log-normal distributions* 𝑡8677 minute Out-of-vehicle travel time, including access time, egress time and waiting time 𝑡9:: minute Non-motorized travel time, used in the bike, walk and bikeshare options 𝑝 US dollar Cost 𝑟 US dollar Reward in monetary token
𝑡M=N?O minute Schedule delay Log-normal distributions
𝐷@A binary Dummy for whether the mode of SP option is the same as the RP mode
Normal distributions 𝐷C, 𝑚 ∈ 𝑀
binary Mode dummies. M includes walk, bike, bikeshare, car and carpool, Uber and Uberpool, taxi, and public transit accessed by walk, bike and car 𝐼@S Inclusive value calculated from the regular choice model Fixed 𝐼:S Inclusive value calculated from the menu product choice model Fixed 𝑋7V@ US
cent/token Token exchange rate Truncated lognormal distribution
𝐼gFh Inclusive value calculated from the service access model Fixed 𝐼/gFh Inclusive value calculated from the regular choice model Fixed 𝑋XY binary Whether a member of (using) any bikeshare service Fixed 𝑋79S binary Whether a member of (using) any ride-hailing app Fixed 𝑋6V\ cars Number of household vehicles Fixed 𝑋\5 binary Whether annual household income > 100k Fixed 𝑧 random variable with i.i.d standard normal distribution 𝜖 random variable with i.i.d Gumbel distribution Latent variable 𝐴 app-lover Fixed 𝐸 environmentalist Fixed
Measurement Equations
indicator intercept slope Corresponding question asked in the post-survey
𝑖Vt 𝛼Vt 𝜆Vt “I am aware of the energy impact of my daily travel” 𝑖Vu 𝛼Vu 𝜆Vu “I am interested in knowing how much energy I can save in my commute” 𝑖Vy 𝛼Vy 𝜆Vy “I would like to share my energy savings with friends and family” 𝑖Wt 𝛼Wt 𝜆Wt “I am a regular customer of eCommerce services” 𝑖Wu 𝛼Wu 𝜆Wu “I am interested in the latest technological advancements” 𝑖Wy 𝛼Wy 𝜆Wy “I am interested in mobility apps”
*the distribution of the parameters of travel time and cost are segmented by full-time workers 1
and other populations (different means and standard deviations) 2
3
4.2 Estimation results 4
We estimated the set of models by BIOGEME (29). The models with inter-consumer 5
heterogeneity were estimated with maximum simulated likelihood. Halton draws (30) were used 6
and the number of draws was decided based on the stationarity of the parameters. 7
The regular choice and menu product choice models are estimated with the chosen 8
alternatives in individual SP experiment. The action of clicking on the Tripod tab in a SP is 9
recorded and considered as a service access action for the estimation of the service access model. 10
Finally, the subscription model is based on the degree of agreement on the post-survey statement 11
“I would use Tripod if it were available today”. 12
To clearly identify the click action on Tripod tab, the surveys where the default tab (the 13
tab shown when respondent opened the page, randomly assigned in survey generation) is Tripod 14
had to be excluded. In addition, we noticed that in 30%of the surveys the respondents viewed 15
only 1 tab. To nudge the respondents to make the choice of which tab to click, we recommend 16
that future studies trying to elicit this action do not provide a default tab so that the respondent 17
has to make a choice of which tab to click before selecting the final option. 18
The estimation results are presented in Table 2 with the notations specified in section 4.1. 19
In the menu product choice model, due to the sample size, the standard deviations of the travel 20
time coefficients’ logarithms are fixed to be the same across population segments. Normalized 21
parameters are shown without standard errors. The normalization in the hybrid choice model is 22
done according to Daly et al. (31). 23
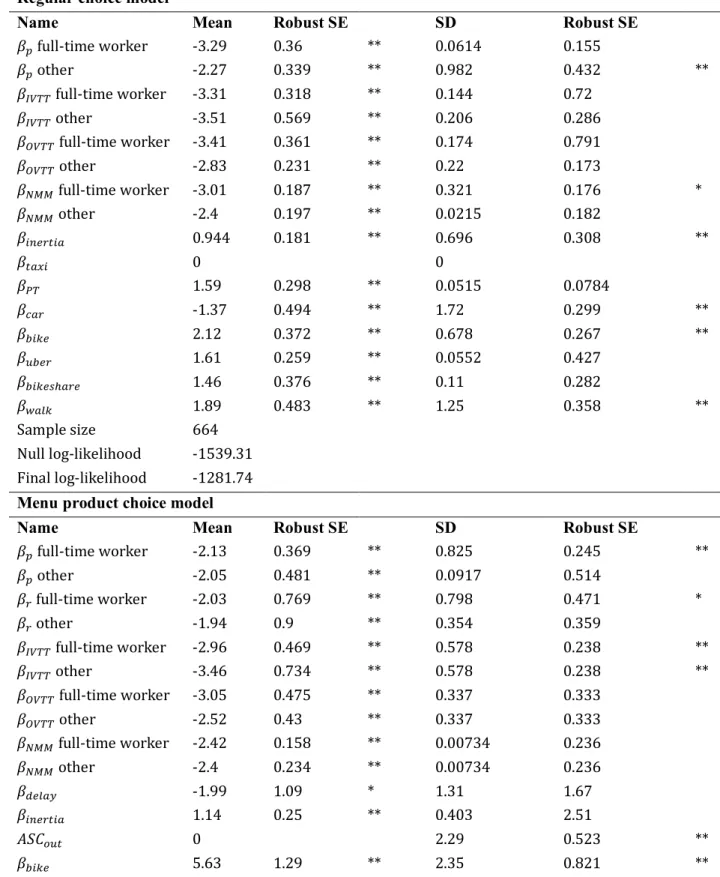
Table 2 Estimation results 1
Regular choice model
Name Mean Robust SE SD Robust SE
𝛽, full-time worker -3.29 0.36 ** 0.0614 0.155 𝛽, other -2.27 0.339 ** 0.982 0.432 ** 𝛽5677 full-time worker -3.31 0.318 ** 0.144 0.72 𝛽5677 other -3.51 0.569 ** 0.206 0.286 𝛽8677 full-time worker -3.41 0.361 ** 0.174 0.791 𝛽8677 other -2.83 0.231 ** 0.22 0.173 𝛽9:: full-time worker -3.01 0.187 ** 0.321 0.176 * 𝛽9:: other -2.4 0.197 ** 0.0215 0.182 𝛽./=>-.? 0.944 0.181 ** 0.696 0.308 ** 𝛽-?z. 0 0 𝛽A7 1.59 0.298 ** 0.0515 0.0784 𝛽T?> -1.37 0.494 ** 1.72 0.299 ** 𝛽h.{= 2.12 0.372 ** 0.678 0.267 ** 𝛽Fh=> 1.61 0.259 ** 0.0552 0.427 𝛽h.{=g|?>= 1.46 0.376 ** 0.11 0.282 𝛽}?N{ 1.89 0.483 ** 1.25 0.358 ** Sample size 664 Null log-likelihood -1539.31 Final log-likelihood -1281.74
Menu product choice model
Name Mean Robust SE SD Robust SE
𝛽, full-time worker -2.13 0.369 ** 0.825 0.245 ** 𝛽, other -2.05 0.481 ** 0.0917 0.514 𝛽> full-time worker -2.03 0.769 ** 0.798 0.471 * 𝛽> other -1.94 0.9 ** 0.354 0.359 𝛽5677 full-time worker -2.96 0.469 ** 0.578 0.238 ** 𝛽5677 other -3.46 0.734 ** 0.578 0.238 ** 𝛽8677 full-time worker -3.05 0.475 ** 0.337 0.333 𝛽8677 other -2.52 0.43 ** 0.337 0.333 𝛽9:: full-time worker -2.42 0.158 ** 0.00734 0.236 𝛽9:: other -2.4 0.234 ** 0.00734 0.236 𝛽M=N?O -1.99 1.09 * 1.31 1.67 𝛽./=>-.? 1.14 0.25 ** 0.403 2.51 𝐴𝑆𝐶+F- 0 2.29 0.523 ** 𝛽h.{= 5.63 1.29 ** 2.35 0.821 **
Menu product choice model – continue
Name Mean Robust SE SD Robust SE
𝛽A7 4.66 1.21 ** 0 𝛽T?> 4.86 1.15 ** 1.45 0.62 ** 𝛽h.{=g|?>= 4.37 1.24 ** 2.62 0.624 ** 𝛽-?z. 5.25 1.27 ** 1.17 1.15 𝛽Fh=> 6.22 1.21 ** 0.946 1.14 𝛽}?N{ 6.95 1.31 ** 0.147 0.669 𝛽5+F- 0.905 0.355 ** Sample size 455 Null log-likelihood -796.831 Final log-likelihood -601.226
Service access model
Name Mean Robust SE SD Robust SE
𝐴𝑆𝐶/~• 0 0.00713 0.0141 𝐴𝑆𝐶?T -1 1.12 0 𝛽7V@ -1.82 1.1 * 2.93 1.38 ** 𝛽5/?T 0.578 0.229 ** 𝛽5?T 0.201 0.201 Sample size 369 Null log-likelihood -255.771 Final log-likelihood -219.805
Subscription model - structural equations for App lover
Name Value Robust SE Name Value Robust SE
𝛽XY 2.65 1.89 𝛽79S 3.17 1.75 * 𝐴𝑆𝐶W 0 𝜎W 4.72 2.11 **
Subscription model - structural equations for Environmentalist
Name Value Robust SE Name Value Robust SE
𝛽6V\ 0.163 0.194 𝛽\5 -0.535 0.241 ** 𝐴𝑆𝐶V 0 𝜎V 0.735 0.301 **
Subscription model - utility in choice model
Name Value Robust SE Name Value Robust SE
𝐴𝑆𝐶gFh 0.856 0.791 𝛽5gFh 0.0946 0.101 𝛽W 0.164 0.0827 ** 𝛽5/gFh -0.437 0.3 𝛽V 0.71 0.548
Thresholds for the choice model
Name Value Robust SE Name Value Robust SE
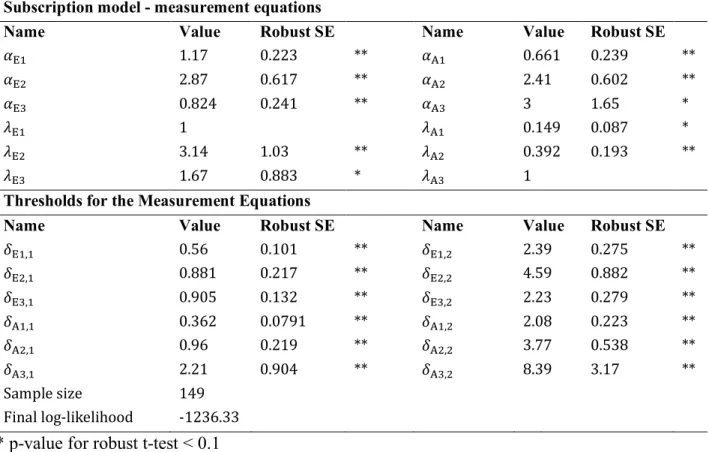
Subscription model - measurement equations
Name Value Robust SE Name Value Robust SE
𝛼•t 1.17 0.223 ** 𝛼‚t 0.661 0.239 ** 𝛼•u 2.87 0.617 ** 𝛼‚u 2.41 0.602 ** 𝛼•y 0.824 0.241 ** 𝛼‚y 3 1.65 * 𝜆•t 1 𝜆‚t 0.149 0.087 * 𝜆•u 3.14 1.03 ** 𝜆‚u 0.392 0.193 ** 𝜆•y 1.67 0.883 * 𝜆‚y 1
Thresholds for the Measurement Equations
Name Value Robust SE Name Value Robust SE
𝛿•t,t 0.56 0.101 ** 𝛿•t,u 2.39 0.275 ** 𝛿•u,t 0.881 0.217 ** 𝛿•u,u 4.59 0.882 ** 𝛿•y,t 0.905 0.132 ** 𝛿•y,u 2.23 0.279 ** 𝛿‚t,t 0.362 0.0791 ** 𝛿‚t,u 2.08 0.223 ** 𝛿‚u,t 0.96 0.219 ** 𝛿‚u,u 3.77 0.538 ** 𝛿‚y,t 2.21 0.904 ** 𝛿‚y,u 8.39 3.17 ** Sample size 149 Final log-likelihood -1236.33
* p-value for robust t-test < 0.1 1
** p-value for robust t-test < 0.05 2
3
4.3 Discussion 4
All the signs and relative magnitudes of the estimated coefficients are as expected, and most of 5
them are statistically significant. In this section we present and discuss the distributions of the 6
monetary values of travel time, schedule delay and tokens. 7
8
4.3.1 Value of Travel Time (VOT)
9
We present the VOT (in terms of in-vehicle travel time, out-of-vehicle travel time and non-10
motorized travel time) for the menu product choice model and regular choice model for the two 11
population segments (full-time workers and others) in Table 3. 12
13
Table 3 Value of travel time 14
Regular Choice Menu Product Choice
Unit: $/hr IVTT OVTT NMM IVTT OVTT NMM
full-time worker mean 59.5 54.1 83.7 43.5 35.6 63.1
other mean 28.7 56.9 85.3 17.4 39.9 42.5
full-time worker median 58.8 53.2 79.4 26.2 23.9 44.9
As can be seen, full-time workers have higher VOT in both choice situations which is 1
likely due to their higher income and tighter schedules. For the other segment, the VOT is valued 2
in the order of NMM, OVTT and IVTT from high to low, while for full-time workers, the VOT 3
for IVTT and OVTT are similar, possibly because full-time workers make longer trips, which 4
makes them more lenient towards waiting time and access/egress time. 5
For each population segment, lower VOTs in the menu product choice model are 6
observed as expected. Travelers are more likely to accept one of the Tripod options when they 7
have flexible schedule and in search for low-cost alternatives. 8
9
4.3.2 Value of Schedule Delay
10
In the menu product choice model, the log-transformed delay shows a better fit compared to the 11
linear case. This indicates that the marginal disutility caused by schedule delay decreases as 12
delay increases. This sensitivity to delay is specified to be distributed across consumers. From 13
the estimation result, the monetary value of a 30-minute schedule delay has a median of $4.0 and 14
a mean of $13.1 for the full-time worker segment, while it has a median of $3.6 and a mean of 15
$8.6 for the other population segment. The monetary value of 2 hours schedule delay has a 16
median of $5.5 and a mean of $18.3 for the full-time worker segment, while it has a median of 17
$5.1 and a mean of $12.1 for the other population segment. Furthermore, schedule delays cause 18
less disutility than travel times, possibly because travelers may spend the delay time on other 19
tasks. The diminishing marginal disutility of schedule delay also makes sense to the authors 20
since larger periods of such time might be easier to utilize. 21
22
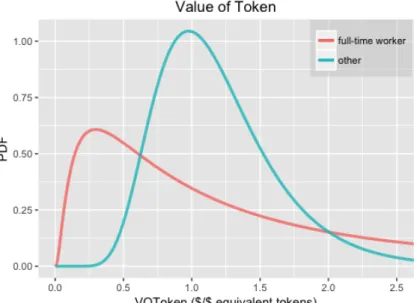
4.3.3 Value of Incentives (Tokens)
23
The probability density function of the value of tokens is shown in Figure 6, segmented by full-24
time worker and other population segments. The value of token represents how much the 25
respondents value an amount of tokens that has the purchasing power of 1 dollar. 26
Since the tokens could only be used in the Tripod marketplace to exchange for gift cards 27
and merchandise, we expected that the token is valued less than the equivalent amount of real 28
money. However, contrary results were observed. The lognormally distributed value of token for 29
full-time workers has a median of 1.1 and a mean of 2.1, while the median and mean for other 30
populations are both around 1.2. A bit surprisingly, half of the respondents value the dollars in 31
equivalent tokens more than the real money. 32
1
Figure 6 Distributions of value of token 2
3
We think there are three potential causes for this. First, the process of token redemption is 4
not included in the SP. Consequently, the potential inconvenience of it might be unrealized by 5
some of the respondents. This effect would no longer be relevant when the RP data regarding 6
Tripod becomes available. Second, since the token value in Tripod is generated based on the 7
energy savings, the valuation of energy savings is partially incorporated through the valuation of 8
tokens. Since Tripod promotes environmentally friendly travel options, we expect a group of 9
environmentalists to appear, in addition to the ones purely motivated by incentives. 10
Third, since the tokens are perceived as rewards while travel costs are perceived as out-11
of-pocket expenses, they could be perceived very differently. In the case of Tripod, since energy-12
efficient and hence highly rewarded options are usually associated with low costs, the situations 13
where the decision maker needs to evaluate a trade-off between token and real money seldom 14
happens. In addition, the marginal utility and disutility of gain and loss (cost) are expected to 15
decreases as gain and loss (cost) increases respectively (32). Under this hypothesis, with the 16
simplification of utility linear in token and cost might cause the current observation as shown in 17
Figure 7. To confirm this, it would be interesting to conduct a comparable experiment with 18
rewards being offered in terms of real money. If our hypothesis is true, we expect the 19
respondents to value the monetary rewards even higher compared to the token rewards. 20
1
Figure 7 Hypothesis explaining the higher perception of tokens 2
3
5 CONCLUSION 4
In this paper, we presented a general framework for modelling the behavior of on-demand 5
mobility services. The framework uses a nested structure to explicitly account for the 6
subscription, service access, menu product and opt-out choices and their connections. The 7
inclusion of the complete service usage decision process differentiates our work from previous 8
research on the choice modelling of on-demand mobility services. 9
The framework is applied to modelling the demand of Tripod, which influences 10
individuals’ real-time travel decisions by offering information and incentives for system-wide 11
energy efficiency. Context-aware SP data was collected by a smartphone-based data collection 12
platform for the model estimation. Inter-consumer heterogeneity was captured in the model 13
specification. Through estimation and sensitivity analysis, we found that the rewards associated 14
with energy-savings are valued higher than cost savings in real money. As expected, the VOTs in 15
the Tripod menu product choice model is much smaller than the VOTs in the regular choice 16
model (cases where the traveler is not subscribing Tripod, not accessing Tripod or selecting
opt-17
out), which indicates that Tripod’s acceptance would be higher in the lower income population 18
segments and its usage would be likely associated with trips with less time constraints. 19
One main difficulty faced in the present work is the actual data collection process. 20
Compared to traditional one-time “paper-and-pencil” SP surveys, the higher quality of the data 21
collected by longitudinal RP-SP data collection process is at the cost of longer efforts from the 22
respondents, especially in our case study where the respondents need to first understand what 23
Tripod is. 24
As suggested by the reviewers, it would be interesting to investigate how the service 25
access action is influenced by other factors such as the ease of access to information. We think 26
these factors are of great relevance and should be included in future related studies. Several other 27
future research directions could be developed based on this paper. The first is to collect RP data 28
for mobility services which meets the data requirements of our framework as mentioned in 29
section 3. Second, the behavior framework could be extended to incorporate a revision process 30
where the en-route opt-out behavior would be handled. The necessity of this additional 31
complexity from a modelling point of view also requires further investigations. Finally, further 32
work needs to be done to fully integrate the models into an ABM simulator and use it for system-33
true token true cost Estimated token Estimated cost
Reward Cost
Utility
wide optimization. This process is essential to on-demand incentivization systems such as the 1 Tripod system. 2 3 ACKNOWLEDGEMENTS 4
This work is funded under the U.S. Department of Energy Advanced Research Projects Agency-5
Energy (ARPA-E) TRANSNET program, Award Number DE-AR0000611. 6
7
AUTHOR CONTRIBUTION STATEMENT 8
The authors confirm contribution to the paper as follows: study conception and design: Yifei 9
Xie, Mazen Danaf, Carlos Lima de Azevedo, Arun Prakash Akkinepally, Bilge Atasoy, Ravi 10
Seshadri, Moshe Ben-Akiva; data collection: Yifei Xie, Mazen Danaf, Carlos Lima de Azevedo, 11
Bilge Atasoy, Kyungsoo Jeong; analysis and interpretation of results: Yifei Xie, Mazen Danaf, 12
Carlos Lima de Azevedo, Arun Prakash Akkinepally, Bilge Atasoy, Kyungsoo Jeong, Ravi 13
Seshadri, Moshe Ben-Akiva; draft manuscript preparation: Yifei Xie, Mazen Danaf, Carlos Lima 14
de Azevedo, Arun Prakash Akkinepally, Bilge Atasoy, Kyungsoo Jeong. All authors reviewed 15
the results and approved the final version of the manuscript. 16
17
REFERENCES 18
1. Bhuiyan, J. Uber powered four billion rides in 2017. It wants to do more — and 19
cheaper — in 2018.
https://www.recode.net/2018/1/5/16854714/uber-four-billion-20
rides-coo-barney-harford-2018-cut-costs-customer-service. Accessed July 28, 21
2018. 22
2. China Daily. DiDi completes 7.43b rides in 2017. 23
http://www.chinadaily.com.cn/a/201801/09/WS5a541c98a31008cf16da5e76.html. 24
Accessed July 28, 2018. 25
3. BlaBlaCar. BlaBlaCar – About us. https://www.blablacar.com/about-us. Accessed 26
July 28, 2018. 27
4. Rasouli, S. and Timmermans, H. Activity-based models of travel demand: 28
promises, progress and prospects. International Journal of Urban Sciences, Vol. 29
18, 2014, pp. 31-60. 30
5. Viegas de Lima, I., Danaf, M., Akkinepally, A., Lima de Azevedo, C., and Ben-31
Akiva, M. Modeling framework and implementation of activity-and agent-based 32
simulation: an application to the Greater Boston Area. Transportation Research 33
Record: Journal of the Transportation Research Board, 2018.
34
6. McFadden, D. The measurement of urban travel demand. Journal of Public 35
Economics, Vol. 3, 1974, pp. 303-328.
36
7. Ben-Akiva, M., and Lerman S. R. Discrete choice analysis: theory and application 37
to travel demand. MIT press, Cambridge, 1985.
38
8. Rayle, L., Dai, D., Chan, N., Cervero, R., and Shaheen, S. Just a better taxi? A 39
survey-based comparison of taxis, transit, and ridesourcing services in San 40
Francisco. Transport Policy, Vol. 45, 2016, pp. 168-178. 41
9. Clewlow, R. R. Carsharing and sustainable travel behavior: Results from the San 42
Francisco Bay Area. Transport Policy, Vol. 51, 2016, pp. 158-164. 43
10. Jittrapirom, P., Caiati, V., Feneri, A. M., Ebrahimigharehbaghi, S., González, M. J. 44
A., and Narayan, J. Mobility as a service: A critical review of definitions, 45
assessments of schemes, and key challenges. Urban Planning, Vol. 2, 2017, pp. 1
13-25. 2
11. Ghose, A., and Han, S. P. Estimating demand for mobile applications in the new 3
economy. Management Science, Vol. 60, 2014, pp. 1470-1488. 4
12. Zoepf, S. M., and Keith, D. R. User decision-making and technology choices in the 5
US carsharing market. Transport Policy, Vol. 51, 2016, pp. 150-157. 6
13. Dias, F. F., Lavieri, P. S., Garikapati, V. M., Astroza, S., Pendyala, R. M., and 7
Bhat, C. R. A behavioral choice model of the use of car-sharing and ride-sourcing 8
services. Transportation, Vol. 44, 2017, pp. 1307-1323. 9
14. Matyas, M. and Kamargianni, M. The potential of mobility as a service bundles as 10
a mobility management tool. Transportation, Vol. 45, 2018, pp. 1-18. 11
15. Choudhury, C.F., Yang, L., de Abreu e Silva, J. and Ben-Akiva, M. Modelling 12
preferences for smart modes and services: A case study in Lisbon. Transportation 13
Research Part A: Policy and Practice, Vol. 115, 2018, pp. 15-31.
14
16. Pinjari, A. R., Pendyala, R. M., Bhat, C. R., and Waddell, P. A. Modeling the 15
choice continuum: an integrated model of residential location, auto ownership, 16
bicycle ownership, and commute tour mode choice decisions. Transportation, Vol. 17
38, 2011, pp. 933-958. 18
17. Le Vine, S., Lee-Gosselin, M., Sivakumar, A., and Polak, J. A new approach to 19
predict the market and impacts of round-trip and point-to-point carsharing systems: 20
case study of London. Transportation Research Part D: Transport and 21
Environment, Vol. 32, 2014, pp. 218-229.
22
18. Plevka, V., Astegiano, P., Himpe, W., Tampère, C., and Vandebroek, M. How 23
personal accessibility and frequency of travel affect ownership decisions on 24
mobility resources. Sustainability, Vol. 10, 2018, pp. 912-936. 25
19. Lima de Azevedo, C., Seshadri, R., Gao, S., Atasoy, B., Akkinepally, A. P., 26
Christofa, E., Zhao, F., Trancik, J. and Ben-Akiva, M. Tripod: Sustainable travel 27
incentives with prediction, optimization, and personalization. Transportation 28
Research Board 97th Annual Meeting, 2018, Washington DC.
29
20. Ben-Akiva, M., Palma, A. D. and Kaysi, I. Dynamics of commuting decision 30
behavior under advanced traveler information systems, Transportation Research 31
Part A: Policy and Practice, Vol. 25, 1991, pp. 251-266.
32
21. Mahmassani, H. S., and Liu, Y. Dynamics of commuting decision behavior under 33
advanced traveler information systems. Transportation Research Part C: 34
Emerging Technologies, Vol. 7, 1999, pp. 91-107.
35
22. Song, X., Danaf, M., Atasoy, B. and Ben-Akiva, M., Personalized menu 36
optimization with preference updater: A Boston case study. Transportation 37
Research Record: Journal of the Transportation Research Board, 2018.
38
23. Atasoy, B., Lima de Azevedo, C., Danaf, M., Ding-Mastera, J., Abou-Zeid, M., 39
Cox, N., Zhao, F. and Ben-Akiva, M. Context-aware stated preferences surveys for 40
smart mobility, International Conference on Travel Behavior Research (IATBR), 41
July 15-20, 2018. 42
24. Cottrill, C., Pereira, F., Zhao, F., Dias, I., Lim, H., Ben-Akiva, M., and Zegras, P. 43
Future mobility survey: Experience in developing a smartphone-based travel 44
survey in Singapore. Transportation Research Record: Journal of the 45
Transportation Research Board, No. 2354, 2013, pp. 59-67.
1
25. Zhao, F., Ghorpade, A., Pereira, F. C., Zegras, C., and Ben-Akiva, M. Quantifying 2
mobility: pervasive technologies for transport modeling. Adjunct Proceedings of 3
the 2015 ACM International Joint Conference on Pervasive and Ubiquitous
4
Computing and Proceedings of the 2015 ACM International Symposium on
5
Wearable Computers, 2015, pp. 1039-1044.
6
26. Seshadri, R., Kumarga, L., Atasoy, B., Danaf, M., Xie, Y., Lima de Azevedo, C., 7
Zhao, F., Zegras, C. and Ben-Akiva, M. Understanding preferences for automated 8
mobility on demand using a smartphone-based stated preference survey: A case 9
study of Singapore, Transportation Research Board 98th Annual Meeting, 2019, 10
Washington DC. 11
27. Needell, Z. A., McNerney, J., Chang, M. T., and Trancik, J. E. Potential for 12
widespread electrification of personal vehicle travel in the United States. Nature 13
Energy, Vol. 1, 2016.
14
28. United States Census Bureau. American Community Survey (ACS). 15
https://www.census.gov/programs-surveys/acs/. Accessed Nov 5, 2018. 16
29. Bierlaire, M. BIOGEME: a free package for the estimation of discrete choice 17
models. Proceedings of the 3rd Swiss Transportation Research Conference, 18
Ascona, Switzerland, 2013. 19
30. Halton, J. On the efficiency of evaluating certain quasi-random sequences of 20
points in evaluating multi-dimensional integrals. Numerische Mathematik, Vol. 2, 21
1960, pp. 84–90. 22
31. Daly, A., Hess, S., Patruni, B., Potoglou, D., and Rohr, C. Using ordered 23
attitudinal indicators in a latent variable choice model: a study of the impact of 24
security on rail travel behaviour. Transportation, Vol. 39, 2012, pp. 267-297. 25
32. Kahneman, D., and Tversky, A. Choices, values, and frames. American 26
Psychologist, Vol. 39, 1984, pp. 341-350.
27
View publication stats View publication stats